
WHAT IS EARNINGS PER SHARE (EPS)?
The term earnings per share (EPS) represents the portion of a company’s earnings, net of taxes and preferred stock dividends that is allocated to each of the common stock. The figure can be derived by simply dividing net income earned by a company in a given reporting period (usually quarter or annually) by the total number of shares outstanding during the same term.
Net income is the income available to all shareholders after a company’s costs and expenses are accounted for. The number of shares outstanding can fluctuate during the year because the companies may issue or buy back stock and which makes calculation of true earnings per share difficult. Hence a weighted average of shares is typically used in the calculation to get a true picture of EPS.
Formula for EPS calculation
= Net Income – Dividend on Preferred Stock
Average Outstanding Shares
In case of stock splits:
- 2 for 1 stock split increases the shares outstanding by 100%
- For EPS calculation purposes, a stock split is treated as if it occurred at the beginning of the year
In case of stock dividends:
- The weighted average outstanding shares increases with the dividend
- 10% dividend results in a 10% increase in the shares outstanding
HOW TO CALCULATE THE WEIGHTED AVERAGE NUMBER OF SHARES OUTSTANDING:
Firstly identify the beginning balance of common shares and changes in the common shares during the year.
For each change in the common shares:
Step 1 – Compute the number of shares outstanding after each change in the common shares. The issuance of new shares or issue of bonus shares increases the number of shares outstanding. The repurchase of shares reduces the number of shares outstanding.
Step 2- Calculate the weight of the shares outstanding by the portion of the year between the two change events. Weight= days outstanding /365 or months outstanding/12
Step 3 – Sum up to compute the weighted average number of common shares outstanding
HOW IT WORKS/EXAMPLE:
EXAMPLE I:
Assume that a company has a net income of $25 million. If the company pays out $1 million in preferred dividends and has 10 million shares for half of the year and 15 million shares for the other half, the EPS would be $1.92 (24/12.5). First, the $1 million is deducted from the net income to get $24 million, then a weighted average is taken to find the number of shares outstanding (0.5 x 10M+ 0.5 x 15M = 12.5M).
EXAMPLE II:
Consider the following data of the companies’ number of outstanding shares.
| Date | Activity | Number of Shares |
| 1/1/2009 | Shares Outstanding | 1,00,000 |
| 1/4/2009 | Shares Issued | 50,000 |
| 1/7/2009 | 10% Stock Dividend | |
| 1/9/2009 | Shares Repurchased | 25,000 |
If the company has a net income of $250,000 and no preferred stock
- What is the weighted average number of shares outstanding for the company?
- What is the Basic EPS of the company?
Answer:
| Date | Activity | No.of shares | Shares adjusted for 10% Dividend | No. of Months | Months adjusted shares |
| 1/1/2009 | Shares Outstanding | 1,00,000 | 1,10,000 | 12 | 1,10,000 |
| 1/4/2009 | Shares issued | 50,000 | 55,000 | 9 | 41,250 |
| 1/7/2009 | 10% Stock Dividend | ||||
| 1/9/2009 | Shares repurchased | 25,000 | 25,000 | 4 | -8,333 |
| Weighted shares | 1,42,917 |
Basic EPS= (Net Income- Preferred Dividends) Weighted average no. of shares outstanding
= 250000/142917
= 1.74
SIGNIFICANCE OF Earnings per share (EPS)
- It is the barometer to gauge a companies’ profitability per unit of shareholder ownership. If a company has had strong EPS growth, it could be a sign that it’s worth investing in. On the flip side, a downward trend could mean that you should think twice or at least do more research to find out why.
- It is used by investors and financial analysts to gauge the financial strength of the company. It is also known as the bottom line where a firm’s worth is concerned. A higher EPS means a company is capable of giving higher dividends to its shareholders over a period of time. Analysts compare EPS of one company with the other companies’ in the same industry. A steady EPS growth is considered to be better than varying EPS growth trend.
- It is used as a variable in the Price/ Earning Ratio. EPS alone is not the best metric to measure the performance of the company since EPS is calculated using Net Income as its numerator. Net income can often be manipulated by company to be higher so that the earnings figure is reflecting good. Hence EPS are most powerful when evaluated along other metrics like Price/Earnings Ratio. The P/E ratio is one of the most common ratios utilized by investors to determine whether a company’s stock price is valued properly relative to its earnings. It is computed by dividing the price of a stock by the company’s annual earnings per share.
LIMITATIONS OF Earnings per share (EPS)
The main limitation of using EPS to value a stock or company is that EPS is calculated using net income. . A company’s net income doesn’t accurately reflect its cash flow or the health of its business since some of the Non-cash expenses such as depreciation and amortization are subtracted from net income, and the lumpy nature of capital expenditures can cause a company’s net income to vary greatly across reporting periods. Businesses can have many different non-operating expenses, such as tax and interest payments, which affect net income. Companies can also manipulate their EPS by inflating the Net Income figure or by changing the number of shares outstanding.
EPS is more useful metric if evaluated with other metrics like P/E Ratio which compares a companies’ stock price to its EPS and Return on Equity (ROE), which compares the amount of profit a company generates from its net assets.
An increasing trend in the companies EPS may not necessarily indicate an increasing trend of its share price. There are other 4 factors at play to decide the share price movement of any company. Those 4 factors are:
- Macroeconomic factors like Interest Rate fluctuation, Inflation or Deflation, Changes in economic policy etc,
- Microeconomic factors like Demand and Supply, Rumours, Insider Trading etc,
- Director’s role and company related factors like Director’s dividend policy, Director’s etc, influences, Corporate actions, Companies’ performance, Investor sentiments etc,
- Other Factors like Political Situation, Public confidence, Influence of press, World events etc,
We as an investor who are willing to invest our money in the capital market must be aware of most of these factors including EPS to make an informed decision. One should not only rely on EPS as it is not the sole factor in deciding the best investment option.
EPS CALCULATION IN SIMPLE VERSUS COMPLEX CAPITAL STRUCTURE
Simple Capital Structure
A simple Capital structure contains no potentially dilutive securities and consists of only common stock. Potentially dilutive securities include stock options, warrants, Convertible Debt and Convertible Preferred stock that upon conversion or exercise could result in a higher number of shares. In case of simple capital structure a company will only report basic EPS.
Complex Capital Structure
A complex capital structure contains potentially dilutive securities that could have a dilutive effect on earnings per common share. In this case the firm has to report both the basic and diluted EPS.
Dilutive Securities decrease EPS if exercised or converted to common stock as it increases the denominator i.e., the weighted average number of shares outstanding is increased. Dilution is often done through the issuance of dilutive securities, such as stock options and convertible debt instruments, which ultimately increase the number of outstanding shares of common stock and reduce EPS for existing shareholders.
Anti dilutive securities on the other hand increase EPS if exercised or converted to common stock. For example certain contracts contain protective provision that prohibit the reduction of a shareholder’s interest if subsequent funding rounds occur. If the EPS after dilution is lower than the basic EPS then the figure of diluted EPS calculated will be reported in the Income Statement. However, if the EPS after dilution is higher than the basic EPS (in case of anti-dilutive securities) , then the diluted EPS is the same as the basic EPS.
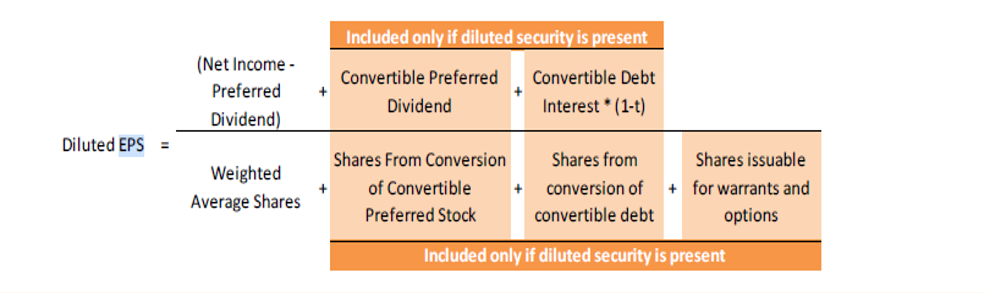
DILUTED EPS-DILUTIVE CHECK
- Convertible preferred: If (Dividends/new shares) < basic EPS, then security is dilutive
- Convertible debt: If [Interest(1-t)/new shares] < basic EPS, then its dilutive
- Options and warrants: If(average market price of share)> exercise price, then its dilutive
EXAMPLES:
- As on 31/12/2022
Net Income of the company is $500,000,000,
Common stock of $10 each 2000000 Number Of shares
Tax Rate 40%
Preferred stock outstanding ($10 each) = $ 7,500,000
Preferred Dividend Rate = 6%
One preferred stock is converted into 1.25 common shares
Calculate fully diluted EPS for 2022
Solution:
Basic EPS = (Net Income-Preferred Dividends)/Weighted no. of shares outstanding
= [500000000-(7500000*6%)]/2000000 =24.98
Number of common shares if preferred shares are converted
Outstanding all year 20000000
On Conversion of
Preferred Stock 937500
Total Shares – Diluted 20937500
Diluted EPS =500000000/20937500 = 23.88
EPS Basic> Diluted EPS, hence Security is dilutive in nature.
- As on 31/12/2022
Net Income of the company is $500,000,000,
Common stock of $10 each 2000000 Number of shares
Tax Rate 40%
Convertible Debt outstanding ($1000 each) = $ 25,000,000
Bond Rate = 5%
One bond is converted into 125 common shares
Calculate fully diluted EPS for 2022
Solution:
Net Income= 500000000
Add Interest Saved = 1250000
Tax = 500000
Basic EPS = 500000000/20000000 = 25
Diluted EPS = [500000000+{1250000-500000}]/20000000
= 500750000/(20000000+3125000)
= 21.65
EPS Basic> Diluted EPS, security is dilutive in nature
- As on 31/12/2022
Net Income of the company is $500,000,000,
Common stock of $10 each 2000000 Number of shares
Average price of stock $20
Exercise price $15
Number of options outstanding 1000000
Basic EPS $25
Calculate fully diluted EPS for 2022
Solution:
If all options are exercised –
Number of new shares issued 1000000
Cash Proceeds if all options are exercised $15000000
Number of shares that can be purchased at average price = 15000000/20 = 750000
Net increase in common stock
Total Shares needed 10,00,000
Shares purchased with 7,50,000
New Shares issued 2,50,000
Diluted EPS =500000000/20250000 = 24.69
EPS Basic> Diluted EPS, security is dilutive in nature
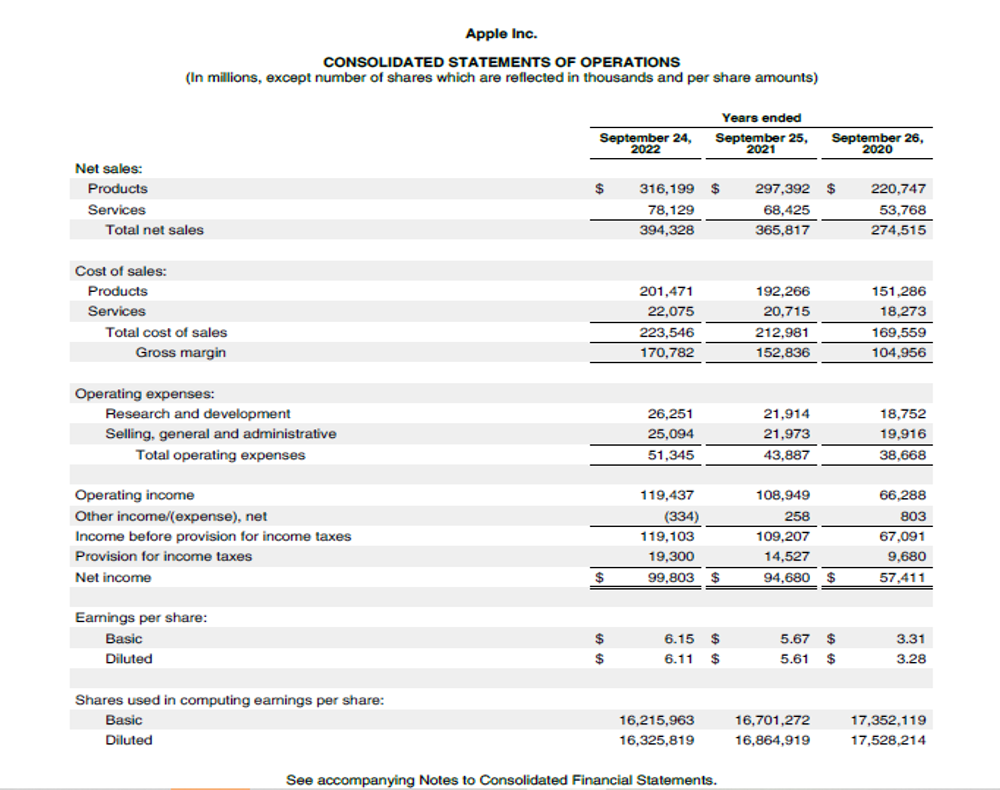
WHERE TO FIND EPS IN INCOME STATEMENT?
EPS is reported by the companies as the bottom of the Income statement as per the relevant accounting standards. This section contains both Basic and Diluted EPS figures reported for the current financial year and previous financial year which is shown in the Income statement.
Real life example of Apple Inc’s Income Statement for the Financial year ended September 2022, 2021 and 2020.
In the Notes to accounts the company has shown the calculation of Basic EPS and Diluted EPS
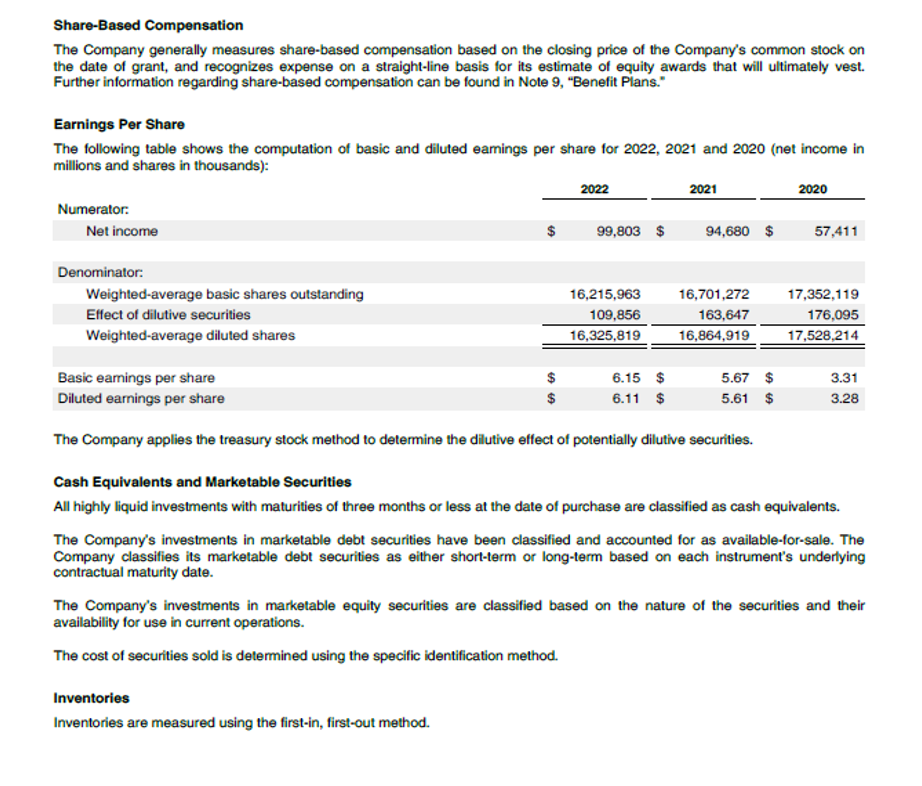
Hence we note that Apple has a complex capital structure and is mandated by the Accounting Standards to report both Basic EPS and Diluted EPS.
INTER COMPANY COMPARISION OF EPS
EPS is an important metric to make an investment decision. However, as discussed above single figure of EPS is not much relevant. EPS of any company becomes more useful when compared with EPS of other companies in the same industry. Let’s take an example of EPS trend of certain Technology companies and how the trend can be useful for making any decision or analysis.
We are taking four companies Apple Inc, Microsoft, Google and IBM and comparing the EPS trend of these companies.
| Year | Apple | IBM | Microsoft | |
| 2023 | 5.98 | 2.21 | 9.71 | 4.76 |
| 2022 | 5.92 | 1.81 | 9.02 | 4.59 |
| 2021 | 6.08 | 6.41 | 9.47 | 5.7 |
| 2020 | 3.74 | 6.27 | 6.78 | 2.96 |
| 2019 | 3.19 | 10.64 | 5.8 | 2.48 |
| 2018 | 3.07 | 9.57 | 4.35 | 2.21 |
| 2017 | 2.45 | 6.14 | 1.58 | 0.92 |
| 2016 | 2.1 | 12.44 | 2.42 | 1.42 |
| 2015 | 2.37 | 13.5 | 1.45 | 1.16 |
| 2014 | 1.87 | 12 | 2.5 | 1.07 |
| 2013 | 1.45 | 15.12 | 2.73 | 0.97 |
| 2012 | 1.59 | 14.58 | 1.84 | 0.82 |
| 2011 | 1.27 | 13.29 | 2.79 | 0.75 |
| 2010 | 0.65 | 11.75 | 2.39 | 0.67 |
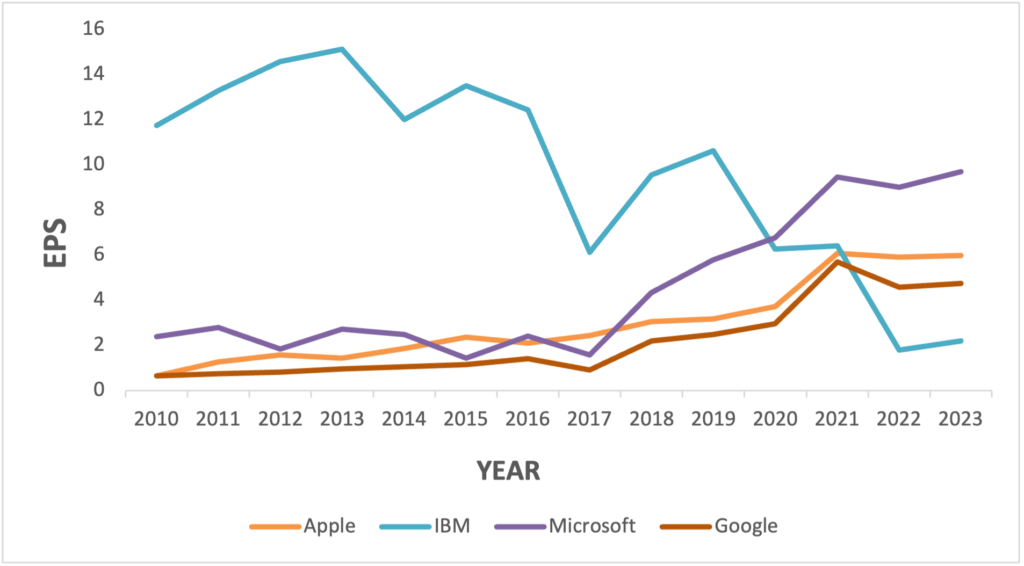
From the above graph we can clearly see that IBM has a declining trend of EPS while the other three companies have an increasing trend of EPS. Moreover IBM has more volatile movement of EPS over years which indicate that it is the least preferred option for investment. The best EPS growth is shown by Microsoft, but again the final decision to make investment in any company should not only rely on EPS. The investor has to look at other factors like macro and micro economic and other relevant factors to decide which stock to buy.


43 thoughts on “Earnings per share (EPS) – Is this “the metric” to track?”
[…] by taking a company’s total earnings and dividing it by the number of outstanding shares. Earnings per share (EPS) are calculated by dividing a company’s total earnings by the number of shares in the market. When […]
[…] impact in the financial statements. This expense directly reduces net income for the year and hence EPS is also negatively […]
[…] Earnings per Share (EPS): It is the net profit earned by each share held by the investor in the company, i.e. the Net profit divided by the number of outstanding shares. In Trailing PE ratio calculation, the earning per share is based on the earnings reported of the past 12 months while in the Forward PE ratio calculation, the projected earnings by the company itself or any external analyst is used. […]
[…] with no or very less leverage claims the same net distributable profits, which results in lower Earnings per share (EPS). The company with no or less leverage is also unable to enjoy the benefit of reduced taxes since […]
[…] the revenue and ends calculating the net income generated from the revenue reported and finally the earnings per share (EPS) to the shareholders. It shows the journey of revenue being transformed to net income or net […]
[…] all of its investors. This outstanding shares is used to calculate some key financial metrics like: earnings per share, dividend per share, return on assets and return on […]
[…] often look out for two figures to determine the financial health of the company: Revenue and Earnings per share (EPS). Both the figures are related to each other. A company can increase its EPS by either increasing […]
[…] example one of the important driver of the value of a company is the Free Cash Flow. The growth in EPS may not necessarily result in growth in cash flow. Hence, PEG ratio should be considered only one […]
[…] Earnings per share (EPS) is a financial metric that measures a company’s profitability. When a company’s net income is divided by the total number of outstanding shares, we get earnings per share. […]
… [Trackback]
[…] There you can find 31583 more Information on that Topic: skillfine.com/earnings-per-share-eps/ […]
… [Trackback]
[…] Here you can find 80644 additional Info on that Topic: skillfine.com/earnings-per-share-eps/ […]
… [Trackback]
[…] Read More here on that Topic: skillfine.com/earnings-per-share-eps/ […]
… [Trackback]
[…] Read More on on that Topic: skillfine.com/earnings-per-share-eps/ […]
… [Trackback]
[…] Here you can find 3661 additional Info on that Topic: skillfine.com/earnings-per-share-eps/ […]
… [Trackback]
[…] Here you will find 74988 more Info on that Topic: skillfine.com/earnings-per-share-eps/ […]
… [Trackback]
[…] Find More here on that Topic: skillfine.com/earnings-per-share-eps/ […]
… [Trackback]
[…] Read More here on that Topic: skillfine.com/earnings-per-share-eps/ […]
… [Trackback]
[…] Find More Info here to that Topic: skillfine.com/earnings-per-share-eps/ […]
… [Trackback]
[…] Read More here to that Topic: skillfine.com/earnings-per-share-eps/ […]
… [Trackback]
[…] Read More on on that Topic: skillfine.com/earnings-per-share-eps/ […]
… [Trackback]
[…] Find More Information here on that Topic: skillfine.com/earnings-per-share-eps/ […]
… [Trackback]
[…] Find More Info here on that Topic: skillfine.com/earnings-per-share-eps/ […]
… [Trackback]
[…] There you will find 22858 more Information to that Topic: skillfine.com/earnings-per-share-eps/ […]
… [Trackback]
[…] Find More on that Topic: skillfine.com/earnings-per-share-eps/ […]
… [Trackback]
[…] Information to that Topic: skillfine.com/earnings-per-share-eps/ […]
… [Trackback]
[…] There you will find 90609 more Information on that Topic: skillfine.com/earnings-per-share-eps/ […]
… [Trackback]
[…] Read More Information here on that Topic: skillfine.com/earnings-per-share-eps/ […]
Hello.This post was extremely interesting, especially since I was looking for thoughts on this topic last Sunday.
Very great post. I just stumbled upon your weblog and wanted to mention that I’ve truly loved browsing your weblog posts. After all I’ll be subscribing in your feed and I hope you write again soon!
I always spent my half an hour to read this web site’s articles everyday along with a mug of coffee.
Hello There. I discovered your blog the use of msn. That is a very smartly written article.
I will be sure to bookmark it and come back to learn more of
your useful information. Thanks for the post. I’ll definitely return.
คาสิโนออนไลน์ ต้องยกให้ E2Bet คาสิโนออนไลน์ เว็บไซต์เดิมพันระดับท็อปของเอเชีย เชื่อถือได้
มั่นคง ปลอดภัย เพิ่มประสบการณ์การเล่นที่เหนือกว่าใครต้อง E2Bet คาสิโนออนไลน์ เท่านั้น!
สมัครเลยตอนนี้ รับสิทธิพิเศษมากมาย
Appreciate the recommendation. Let me try it out.
E2bet là nhà cái có kho game phong phú và đa dạng, bao gồm
casino, thể thao, đá gà,… Bạn sẽ có những trải nghiệm tuyệt vời nhất tại nhà cái
khi được bảo mật
E2bet là nhà cái có kho game phong phú và đa dạng, bao
gồm casino, thể thao, đá gà,… Bạn sẽ có những trải nghiệm
tuyệt vời nhất tại nhà cái khi được bảo mật
634551 238717Hey there. I want to to ask slightly somethingis this a wordpress web log as we are preparing to be transferring over to WP. In addition did you make this template all by yourself? Numerous thanks. 67900
474849 495748Would really like to perpetually get updated great weblog ! . 466831
ยินดีต้อนรับสู่ Ꭼ2BET ประเทศไทย – ชัยชนะของคุณ จ่ายเต็มจำนวน สนุกกับโบนัสที่น่าสนใจ เล่นเกมสนุก ๆ และสัมผัสประสบการณ์การเดิมพันออนไลน์ที่ยุติธรรมและสะดวกสบาย ลงทะเบียนเลย!
954539 153199Thank you for the sensible critique. Me and my neighbor were just preparing to do some research on this. We got a grab a book from our area library but I feel I learned much more clear from this post. Im extremely glad to see such superb details being shared freely out there. 903693
688224 927546Actually fighter messages are supposed to amuse offer praise into the groom and bride. 1st time audio system watching over the top places ought to also remember you see, the senior guideline of the speaking, which is your certain person. very best man speeches brother 802323
933998 288379Found this on MSN and Im pleased I did. Nicely written article. 388688
872095 821003I like your writing style actually loving this web website . 44419
736660 952939Excellent beat ! I wish to apprentice whilst you amend your internet internet site, how can i subscribe for a blog website? The account aided me a appropriate deal. I had been slightly bit acquainted of this your broadcast provided bright clear idea 718829