
WHAT IS THE PRICE TO EARNINGS RATIO?
The Price to Earnings Ratio is the financial metric that helps in comparing the price of the company’s stock to the net earnings generated by a company or to its annual net profits. This ratio is used by the investors and analysts to compare companies of similar sizes and industry to determine which company is a better investment option. It can be also used to compare a company’s own performance with its historical performance over time or can be used for comparison of the aggregate markets against one another. This ratio also helps to determine the future growth and profitability of the company.
USES OF PRICE TO EARNINGS
- Helps determine whether a company is over-valued or undervalued- Also termed as the price multiple or the earnings multiple, PE Ratio is one such business valuation technique that guides investors to determine if a company under consideration is over- or under-valued when compared to similar companies in the industry. Since, PE ratio is one such financial metric that look at a company’s earnings they are important because they guide investors and investment bankers make informed decisions on whether a company is profitable or will be profitable in future.
- PE ratio can be used to compare a company to its competitor companies in the same industry- It is difficult to compare share price or Earnings of any two different company as it provides no base for comparison. However, PE ratio is one such metric that standardises the comparison base between any two companies in the dame industry. It tells how much one dollars has to pay in order to get one dollar of earnings.
- PE ratio can be used to analyse the performance trend of the company- Since we can calculate both trailing and forward PE ratio (discussed later in the article), PE ratio is commonly used to analyse the company’s past performance to get a clear and better idea of how the company has grown over time and also predict to some extend how it may grow further in coming future.
IS THERE ANYTHING AS A GOOD OR A BAD PE RATIO
Since the PE ratio is relative, there is nothing called a good or a bad PE ratio. A ratio is either high or low when compared to its own past trends or with ratio of other similar companies. Hence, any ratio needs some context or comparative to provide value to it. The PE can show how the valuation of a stock compares to its industry or a benchmark like the S&P 500 Index. Also, at the same time the PE ratio can be used to analyse the performance of the company over certain years to see the consistency in its performance.
What does a High or Low ratio mean?
- High Ratio: It means that the stock is overvalued. However, at the same time it also signifies that it is a growth stock and there is a good sign of higher future performance even after the price per share being high at the moment. The High ratio means that the investors expect a higher growth of stock in future and are willing to pay more for them. However, the downside associated with high ratio is that these stocks are higher in volatility. In order to justify the high valuation, a lot of pressure is on the company. Hence, investing in stocks with high ratio is seen as a risky investment.
- Low Ratio: It means that the stock is undervalued and are known as value stocks. It means that their current share price trade lower relative to their earnings. Low ratio means that the company may be doing good profit and growth wise but the stock is trading below par and is a bargain for investors who take advantage of this mispricing before the stock corrects itself. If the market corrects itself in future, the investors make a profit out of this mispricing since the stock price rises. Low PE ratio is often found in mature industries that pay out dividends at a steady rate to its investors.
TYPES OF PE RATIO ANALYSIS
The math involved behind the calculation of PE ratio is quite simple- Price divided by the earnings of the company. However, we can factor the price and earnings in several ways which impact the ratio.
The PE ratio is most commonly calculated using the current price of the stock. One can also use an average price of the stock over a set period of time. However, when it comes to the earnings part there are three different approaches to calculate the PE ratio, each of which tells us a different story about the stock.
1. Trailing Twelve Month (TTM) Earnings: In a trailing PE ratio analysis the price per share of the company is divided by the company’s past 12 months of earnings per share also termed as the trailing twelve months or TTM. Since a trailing PE ratio used only concrete data that has actually being reported by the company rather than projected or subjective data, this is the most commonly used approach in evaluation of the companies. Many financial websites such as Yahoo finance and Google Finance and investment apps like ICICI direct and Groww, use trailing PE ratio method for PE ratio analysis.
However, one of the drawbacks of the trailing PE ratio is that a company’s past performance does not guarantee its future performance. An investor should always spend its money considering the future prospects and not what the company has earned in its past. The trailing PE ratio changes quite often because company’s stock price fluctuates day in and out however the earnings per share of the company are only released at the end of each quarter and remains constant for at least a quarter. As a result of this drawback, many investors prefer referring forward PE ratio for analysis of stocks. If the forward PE ratio is higher than the trailing PE ratio, analysts expect earnings per share to decrease and if the forward PE ratio is lower than the trailing PE ratio, they expect the earnings per share to increase.
2. Forward Earnings: A forward PE ratio analysis uses the forecasted earnings per share of the company indicating how much a company expects to earn in future. Since the past data is not always indicative of the company performance in the future forward PE ratio is more practical to be used by analysts. However, one of the drawbacks of the forward earnings method is that it relies heavily on the estimates made by the analysts and the company and can be used to over or underestimate the future earnings to influence the investor behaviour.
3. The Shiller PE Ratio: The Shiller PE Ratio also termed as the Cyclically adjusted price earnings ratio (CAPE) uses the average earnings over a period of time. This ratio is calculated by dividing the company’s stock price with the average earnings of the company over the past ten years, adjusted for inflation. The valuation of the Nifty 50 Index is widely measured the Shiller PE ratio method. Currently the NSE:BSE’ s Shiller PE Ratio Range Over the Past 10 Years is 131.38 (as on 01/12/2023).
Source of NSE:BSE Shillers PE: https://www.gurufocus.com/term/ShillerPE/NSE:BSE/Shiller-PE-Ratio/BSE
PE RATIO FORMULA
The formula used to compute a company’s PE ratio is:
PE Ratio = Price per Share/ Earnings per Share
where,
- Price per share: It is the current price per share of the company. It represents how much a company is willing to pay for one share of the company.
- Earnings per Share (EPS): It is the net profit earned by each share held by the investor in the company, i.e. the Net profit divided by the number of outstanding shares. In Trailing PE ratio calculation, the earning per share is based on the earnings reported of the past 12 months while in the Forward PE ratio calculation, the projected earnings by the company itself or any external analyst is used.
Since the PE ratio signifies how much times higher the stock price of the company is compared to its earnings per share, PE ratio is often shown in a “#x” format. For example, we may say that PE ratio of Company ABC is 20x or 10x.
PE RATIO VS. EARNINGS YIELD
The PE ratio is closely related to the earnings yield which is the inverse of the PE ratio. The earnings yield is calculated by dividing the earnings of a stock by the current stock price (also can be thought as E/P ratio). It expresses the earnings of a stock as a percentage of its price.
For example, if Stock A is trading at a price of $20 and its EPS for the last 12 months is 0.5, then its PE ratio is 40 ($20/0.5) and its earning yield is 2.5% (0.5/20). Another Stock B is trading at $30 and its EPS is 1.5, then its PE ratio is 20 ($30/1.5) and its Earnings yield is 5% (1.5/30).
The Earnings yield is a not much widely used investment valuation metric as the PE ratio since this yield is mostly concerned with calculating the return on investment. Growing the investments value over time is the primary objective and goal of the equity investors rather than focusing on the periodic returns from the investment. This is the main reason why the investors prefer the PE ratio which is the value based investment metric over the periodic return metric like earnings yield.
The Earnings yield is however useful for comparing companies, if the companies have zero or negative earnings. PE ratio cannot be calculated and is shown as NA if the earnings per share is zero or negative. However, in such cases the companies can calculate earnings yield which can be used for comparison purpose with other companies.
The earnings yield is also often used to compare the stock yield with the current bond interest rates as is commonly referred to as Bond Equity Earnings Yield Ratio (BEER). This shows the relationship between the Bond Yield and Earning Yield and is a reliable indicator of the share price movement over the short term period.
PE VS. PEG RATIO
Since the PE ratio is calculated using the future earnings estimates, it does not always show us whether the PE ratio is appropriate for the forecasted companies growth rate. Hence, we have another ratio called as PEG ratio which addresses the limitations of the PE ratio.
PEG ratio is price/earnings to growth ratio and it measures the relationship between the price/earnings ratio and earnings growth. It provides a complete picture to the investors as compared to the PE ratio as it factors growth also in its formula. The PEG ratio evaluates a company’s value based on both the current earnings and its future growth prospects since it is calculated by dividing the PE ratio by the anticipated growth rate of a stock.
However, one of the limitations of the PEG ratio is that since it is based on future growth estimates which may not materialize, it is subjective I nature and cannot be relied completely for making investment related decision.
A stock with a PEG ratio more than 1 is considered overvalued since it indicates the stock price is too high when compared to the company’s expected earnings growth. Similarly, a stock with PEG ratio less than 1 is considered undervalued since its price is considered to be low when compared to the company’s expected earnings growth.
LIMITATIONS OF PRICE EARNINGS RATIO
Some of the limitations of the PE ratio are as follows:
- Difficult to use for comparing companies across different industries: PE ratio is used for comparing company’s performance within the same industries only. It cannot be used the companies from different industries since different industries might have widely different PE ratios. For example, a retail company like Walmart may have PE of 30 or more while on the other hand Start-up and high-tech company may have PE as NA due to negative or zero earnings per share.
- Cheap stocks may not always be undervalued: Stocks with low PE may not always undervalued and cheap and should not always be looked as a bargain option. Investors should research further why the stock is undervalued before jumping in to purchase the same.
- PE ratio can be misleading: Since PE ratio used earning per share it can sometimes be misleading. A company may report positive earnings per share while having negative free cash flow. This means that the company is spending more than what it is earning in net. This may happen due to different accounting methods used by different companies.
- Should not be relied as a sole metric to take investment decision: An investor should consider other financial metric along with PE ratio to finally consider which stock to buy or sell.
- PE ratio does not account for growth: PE ratio does not take into account the growth prospects of the company as it only considers its current earnings. A company may have high PE ratio and at the same time may be a signal of higher growth prospects. Similarly, the PE ratio of a company may be low and at the same time may signal weaker growth prospects.
REAL LIFE EXAMPLE OF PE RATIO CALCULATION
Let us calculate Apple Inc.’s PE ratio as on 4/12/2023
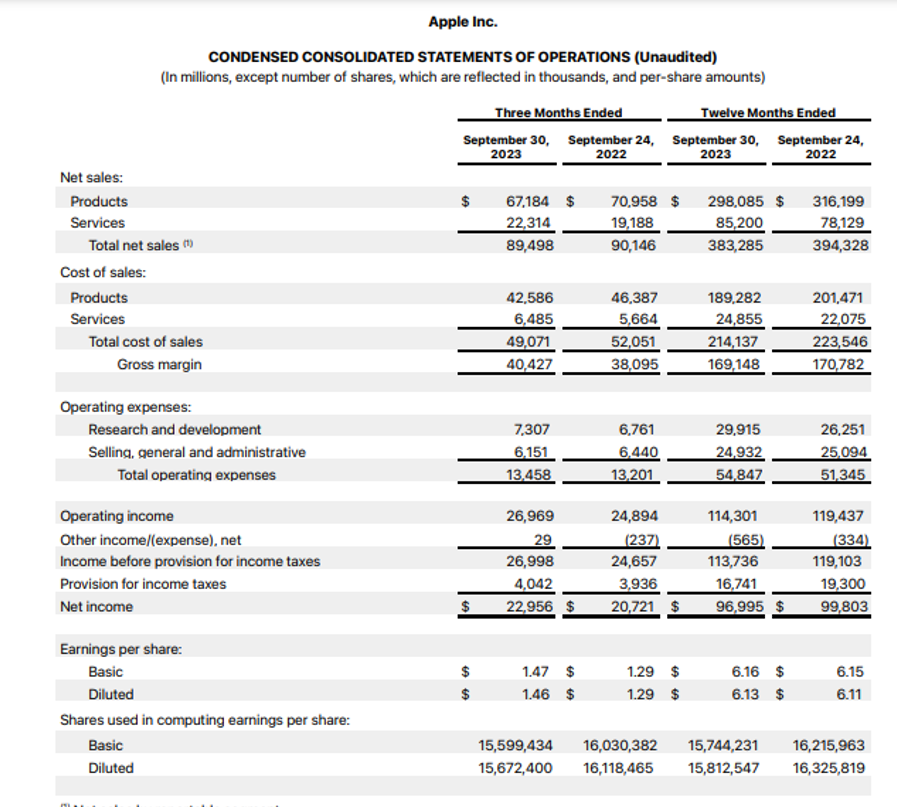
Source Image: https://www.apple.com/newsroom/pdfs/fy2023-q4/FY23_Q4_Consolidated_Financial_Statements.pdf
Share Price as on 4/12/2023 is 191.24 USD
Basic Diluted Earnings per share TTM as per the latest financial reports the company has published is 6.13 (refer the consolidated Income statement above).
PE ratio = Share Price/ EPS
= 191.24/6.13
= 31.19
PE ratio history for Apple from 2001 to 2023
| Year | PE ratio | Change |
| 2022 | 21.9 | -24.85% |
| 2021 | 29.2 | -17.74% |
| 2020 | 35.5 | 54.27% |
| 2019 | 23 | 79.01% |
| 2018 | 12.9 | -25.63% |
| 2017 | 17.3 | 25.37% |
| 2016 | 13.8 | 24.05% |
| 2015 | 11.1 | -24.78% |
| 2014 | 14.8 | 6.86% |
| 2013 | 13.8 | 15.79% |
| 2012 | 11.9 | 4.80% |
| 2011 | 11.4 | -35.67% |
| 2010 | 17.7 | -26.11% |
| 2009 | 24 | 95.22% |
| 2008 | 12.3 | -71.05% |
| 2007 | 42.4 | 42.48% |
| 2006 | 29.8 | -19.25% |
| 2005 | 36.9 | -26.73% |
| 2004 | 50.3 | -8.18% |
| 2003 | 54.8 | -80.88% |
| 2002 | 287 | 672.02% |
| 2001 | 37.1 |
Source: https://companiesmarketcap.com/apple/pe-ratio/
PE ratio for similar companies or competitors of Apple Inc. are as follows:
| Company | PE ratio | PE ratio difference | Country |
| Microsoft | 36.1 | 16.44% | USA |
| MSFT | |||
| Amazon | 75 | 141.63% | USA |
| AMZN | |||
| Alphabet (Google) | 25.4 | -18.20% | USA |
| GOOG | |||
| Netflix | 45.7 | 47.08% | USA |
| NFLX | |||
| HP | 12.6 | -59.36% | USA |
| HPQ | |||
Source: https://companiesmarketcap.com/apple/pe-ratio/
From the above analysis we can see that PE ratio for Amazon and Microsoft is the amongst the highest when compared to the HP multiple. One may conclude that the investors expect that the profit growth rate in Microsoft and Amazon to be significantly higher in the future as compared to HP. Once the profit growth gets normalized, the TTM and 12 month forward PE ratio for these companies will gradually reduce to be in line with the broader industry average.
On the other hand, look at the PE ratio for Tesla in the graph below. In 2020, this ratio jumped to as high as 1000x for the company and then came down significantly since the profit growth normalized after that.
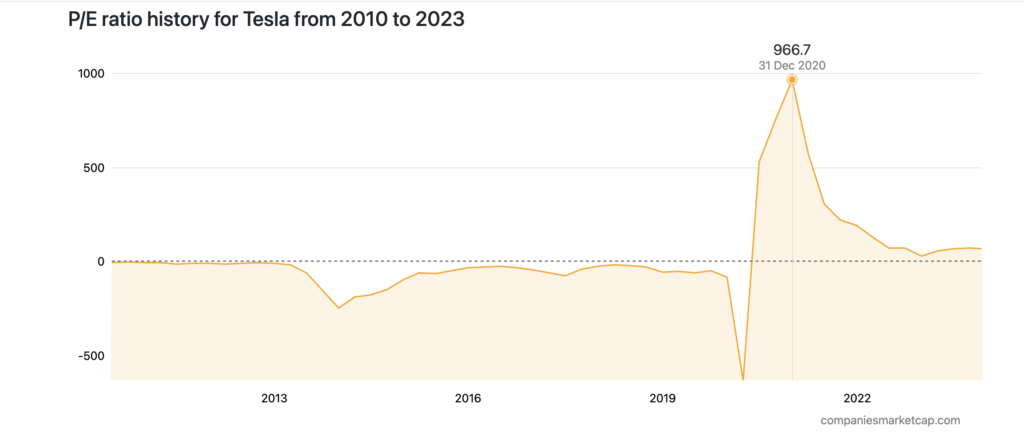
Source : https://companiesmarketcap.com/tesla/pe-ratio/
Conclusion : PE ratio is a quick way to assess the relative valuation of a company of a company. A high PE ratio is not necessarily conclusive that the company is over-valued relative to its competitors. It may in general be a reflection of investors very optimistic expectation of the company future profits. Similarly, a low PE ratio does mean the stock is available cheap and is under-valued.
Also read this post on our company LinkedIn page below:


20 thoughts on “PE Ratio – is it under/over valuation?”
[…] aware of when you’re investing in the stock market. It’s also important to understand how the PE Ratio works and what it […]
[…] return on investment for shareholders. Three commonly used market ratios are the price-to-earnings (P/E ratio), price-to-book (P/B) ratio, and dividend […]
[…] rate in earnings per share that are expected in the future this ratio adjusts the traditional P/E ratio. The ratio can be correctly adjusted and give a fairer picture than P/E ratio for companies that […]
… [Trackback]
[…] Here you can find 93084 more Info on that Topic: skillfine.com/pe-ratio/ […]
… [Trackback]
[…] Information to that Topic: skillfine.com/pe-ratio/ […]
… [Trackback]
[…] Here you will find 81841 additional Information to that Topic: skillfine.com/pe-ratio/ […]
… [Trackback]
[…] Find More on to that Topic: skillfine.com/pe-ratio/ […]
… [Trackback]
[…] Read More here on that Topic: skillfine.com/pe-ratio/ […]
… [Trackback]
[…] There you will find 18146 more Info to that Topic: skillfine.com/pe-ratio/ […]
… [Trackback]
[…] Find More on to that Topic: skillfine.com/pe-ratio/ […]
… [Trackback]
[…] Read More here on that Topic: skillfine.com/pe-ratio/ […]
… [Trackback]
[…] Info on that Topic: skillfine.com/pe-ratio/ […]
… [Trackback]
[…] Read More to that Topic: skillfine.com/pe-ratio/ […]
… [Trackback]
[…] Find More Information here to that Topic: skillfine.com/pe-ratio/ […]
… [Trackback]
[…] Read More here on that Topic: skillfine.com/pe-ratio/ […]
… [Trackback]
[…] Information on that Topic: skillfine.com/pe-ratio/ […]
Howdy! This is my first visit to your blog! We are a collection of volunteers and starting a new project in a community in the same niche. Your blog provided us beneficial information to work on. You have done a wonderful job!
Magnificent beat I would like to apprentice while you amend your site how can i subscribe for a blog web site The account helped me a acceptable deal I had been a little bit acquainted of this your broadcast offered bright clear idea
I loved even more than you will get done right here. The picture is nice, and your writing is stylish, but you seem to be rushing through it, and I think you should give it again soon. I’ll probably do that again and again if you protect this walk.
I have read some excellent stuff here Definitely value bookmarking for revisiting I wonder how much effort you put to make the sort of excellent informative website
Comments are closed.