
WHAT IS THE PRICE/EARNINGS-TO-GROWTH – PEG RATIO?
The price/earnings-to-growth ratio, or the PEG ratio, is a stock valuation metric that helps investors and analysts value a stock by taking into account a market price of a company, its earnings (past or future estimated price) and its future growth prospects. The ratio helps investors and analysts to get a broader picture of the company’s financial performance and evaluate the investment risk.
The PEG ratio is simply a stock’s price-to-earnings (P/E) ratio divided by the earnings growth rate for a specified time period. By taking into account the growth rate in earnings per share that are expected in the future this ratio adjusts the traditional P/E ratio. The ratio can be correctly adjusted and give a fairer picture than P/E ratio for companies that may have a high P/E ratio and high growth rate by adding the expected growth of the company into the ratio.
Typically, growth rate is taken for 1-5 years. The ratio can also be calculated using an estimated annual growth rate for a longer period of time than 5 years. However, as the time period is extended the growth projections tend to become less accurate given the future uncertainties related to earnings and growth of the company.
REAL LIFE CALCULATION OF PEG RATIO OF COMPANIES
Let us calculate the PEG ratio of Apple Inc. as on 1st Feb 2024.
Close Price of the Apple stock as on 1st Feb 2024 is $184.40
Diluted TTM EPS as per the latest Quarterly published financial statements Is $6.13
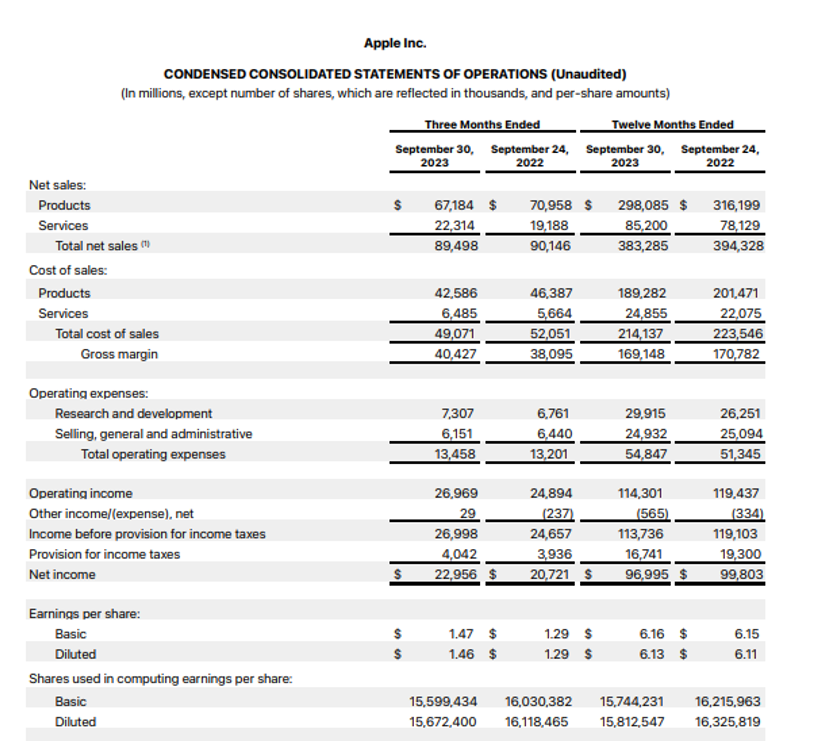
Source: https://www.apple.com/newsroom/pdfs/fy2023-q4/FY23_Q4_Consolidated_Financial_Statements.pdf
Hence P/E Ratio =Close Price /Diluted TTM EPS
=$184.40/$6.13
=30.08
EPS Growth = (EPS TTM- EPS Prior TTM)/ Absolute EPS Prior TTM*100
= (6.13-6.10)/6.10*100
= 0.49%
Hence PEG ratio as on 1st Feb 2024= P/E ratio/EPS Growth
= 30.08/0.49%
= 61.17
12-month average PEG ratio= 27.23
3- year average PEG ratio= 17.23
5-year average PEG ratio= 12.40
PEG ratio of Apple Inc. and its competitors as on 1st Feb 2024
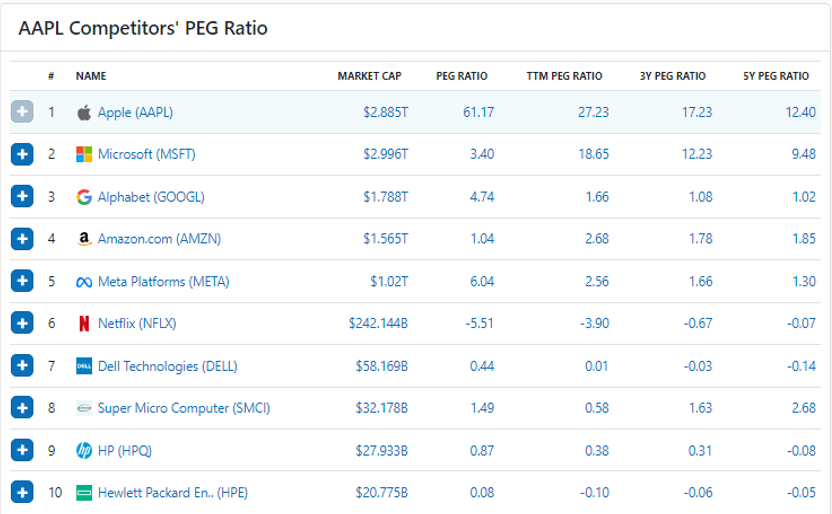
Source data: https://www.financecharts.com/stocks/AAPL/value/peg-ratio
HOW TO CALCULATE THE PEG RATIO?
PEG ratio as explained above is simply a company’s P/E ratio divided by its expected rate of growth.
Three main inputs are required for the PEG ratio calculation. They are as following:
- Stock Price
- Earnings per share(EPS)
- Expected rate of growth (EPS Growth typically taken for past 1-5 years)
Formula
PEG Ratio= Price/ EPS
EPS Growth
Where,
- Price: The stock price is its current market price available on stock trading websites and do not require any estimate.
- Earnings Per Share(EPS): There are two types of earnings that can be used in the PEG ratio calculation. The first option is to use earnings of a company from the past year also referred to as Trailing 12-month or TTM. The advantage of this option is that the past earnings of a company can be found from its financial statements and does not require an estimate. However, one of the disadvantage of this option is that the past earnings does not account for the company’s future prospects.
Given this limitation some investors and analysts prefer to use estimated earnings of a company’s over the next financial period. past earnings may not reflect the company’s future prospects. This approach better reflects the company’s current position however it requires an estimate to be made which can add more uncertainty to the results.
Apart from using past or future earnings, one may also consider to make certain adjustments to the reported earnings of the company.
- EPS Growth Rate: Growth rate taken into account is generally based on future estimates. However, one can take a growth estimate based on past growth rates. Using past growth rates may be correct in some cases however past growth rates are often not indicative of the company’s future prospects as future growth rates may slow down or quicken.
Given that different investors and analysts use different assumptions of earnings and growth rates, PEG ratio calculated by each one of them may vary. These different calculations can lead to very different results.
WHAT IS A GOOD PEG RATIO?
A PEG ratio value of 1 – A ratio equal to 1 shows that a stock is fairly priced and reflects a perfect correlation between the market value of the company and its projected earnings per share growth rate.
A PEG ratio higher than 1- A ratio higher than 1 suggests that the stock is overvalued and may not be a positive signal for stock purchase by the investors.
A PEG ratio less than 1- A ratio less than 1 suggests that the stock is undervalued. Investors are more attracted towards the stocks with ratio less than 1, as it presents the opportunity to but the stock at less price and sell it off at a higher price when the market corrects itself.
Any investor or analyst should however not rely exclusively on the PEG ratio or any other single financial metric. Even if the PEG ratio of the company is equal to or less than 1 an investor should invest in any stock only after considering other financial metrics.
WHAT DOES A NEGATIVE PEG RATIO MEAN?
A negative P/E ratio or negative earnings growth estimates can lead to negative PEG ratio. A negative PEG in either case shows that a company is may be in a trouble, losing its money, have high investment risk involved or have expected negative growth and is viewed with skepticism by almost all the investors.
PEG RATIO VS. P/E RATIO
The price-to-earnings (P/E) ratio gives investors and analysts an indication of what investors are paying for a stock currently in relation to the earnings of the company. However, one of the weakness of the P/E ratio is that it does not take into account the expected future growth rate of a company. The PEG ratio by taking into account the growth factor in the P/E ratio represents a more accurate and complete valuation of the company’s stock than the standard P/E ratio. Accounting in future estimated growth adds a very essential factor to stock valuation since investors investing in equity investments have a financial interest in a company’s future earnings and are very much concerned about its future growth prospects. The ratio can be correctly adjusted and give a fairer picture than P/E ratio for companies that may have a high P/E ratio and high growth rate by adding the expected growth of the company into the ratio.
Let’s understand this with the help of an example:
We have data for two hypothetical companies. We need to calculate P/E ratio and PEG ratio for both the companies.
| Particulars | Company A | Company B |
| Price per share | $50 | $85 |
| EPS this year | $2.10 | $2.65 |
| EPS last year | $1.90 | $1.97 |
P/E ratio for Company A= $50/$2.10 = 23.81
P/E ratio for Company B= $85/$2.65 = 32.07
Earnings growth rate for Company A= ($2.10 / $1.90) – 1 = 10.53%
Earnings growth rate for Company B= ($2.65 / $1.74) – 1 = 34.52%
PEG ratio for Company A= 23.81/10.53= 2.26
PEG ratio for Company B= 32.07/34.52= 0.93
When looking at P/E ratio many investors find Company A more attractive since it has a lower P/E ratio among the two companies. However, Company B as compared to Company A have a high growth rate. When we factor in growth rate in the P/E ratio we find that the Company B is trading at a discount to its growth rate and investors are paying less per unit of earnings growth for investment in Company B’s stock. Hence, Company B’s stock will be a better buy option due to its lower PEG ratio.
WHAT ARE SOME LIMITATIONS OF THE PEG RATIO?
Some of the limitations of PEG ratio are as following:
- Less appropriate ratio for measuring companies without high growth– PEG ratio may not be very useful metric to be calculated for large and well-established companies since such companies may offer its investors with dependable dividend income with little opportunity for future growth.
- Based on estimates- Since a company’s growth rate is just an estimate it is subject to the limitation of what is going to happen in future and can vary significantly from one investor or analyst to another. There are many factors due to which the future growth of a company can change like the market conditions, economic and political changes, expansion setbacks, and sentiments of the investors. Also the PEG ratio being equal to 1 is somewhat arbitrary and turns out to be true only in theory.
- The simplicity of calculating PEG leaves behind several important variables- The growth rate of the company used in the PEG ratio does not account for the overall economy growth rate. Hence to get any accurate sense of how competitive a stock is for investment an investor must compare a company’s stock PEG to average PEG across its industry and the entire economy.
- The PEG ratio does not account for factors that help determine the value of company- For example one of the important driver of the value of a company is the Free Cash Flow. The growth in EPS may not necessarily result in growth in cash flow. Hence, PEG ratio should be considered only one of various factors when valuing a company.
Conclusion: The PEG ratio is a good normalization of the PE ratio to incorporate the effect of high growth that may be forecasted for a business. While the PE ratio for some companies may look higher or lower than the market average, the PEG ratio helps us to understand in a better way how much of the PE ratio is explained by the growth expectations of the company.

