
WHAT IS AN INCOME STATEMENT?
A company’s financial performance over any specific accounting period is reported using three most important financial statements: The Balance Sheet, the Income Statement and the Cash Flow Statement. The Income statement focuses on the Revenue generated or expense incurred by the business, gains or losses reported for any given period.
The Income Statement is known by other names such as the Profit and loss statement, the statement of profit and loss, statement of financial performance, revenue statement, earnings statement, statement of earnings, statement of operations or the Operating statement. No matter what name it is called by its focus is to provide the stakeholders with valuable insights into the operational performance of the company for any given period of time, highlight the underperforming sectors or business segments, the efficiency of the management and its performance relative to the competitors in the industry. The Income Statement being the integral part of the performance reporting of any company is submitted to the U.S. Securities and Exchange Commission (SEC).
While an Income statement represents a period of time like cash flow statements, the Balance Sheet represents a single moment of time. The Income Statement reports income and expenses through a specific period either being monthly, quarterly or annual and its heading indicates the duration of reporting for example as “For the fiscal year/ quarter/month ended Sept 20,2021”.
The Income Statement do not differentiate between cash and non-cash receipts or revenue (i.e. both cash and credit sales are included in the total revenue figure in the income statement) and similarly between the cash and non-cash expenses (for example both cash and credit purchases are included). It starts with the details of the revenue and ends calculating the net income generated from the revenue reported and finally the earnings per share (EPS) to the shareholders. It shows the journey of revenue being transformed to net income or net loss.
TWO METHODS OF THE PREPARATION OF THE INCOME STATEMENT
- Single Step Method: In this method the Total revenue is recognized and total expenses are straight away subtracted from it to give us the bottom line figure i.e. the Net Income.
- Multiple Step Method: In this method several steps are followed to find the bottom line: starting with recognition of revenue, gross profit, calculation of operating expenses, interest and taxes and finally the net income. This method is often followed by the listed companies and is a more detailed way reporting the income statement of the company. In this method profitability is reported at four different levels: Gross profit, operating profit, pre- tax and after-tax. This method helps in better and more transparent reporting. For example, a company may have high level of gross profit but very low operating profit which might reflect the operating expenses are high and reflect the operating inefficiency of the company.
HOW TO PREPARE AN INCOME STATEMENT?
We can follow the below steps to create an Income Statement.
- First we have to choose our reporting period
The Income statement covers a specific time frame called as the reporting period. The reporting period can be monthly, quarterly or annual depending upon the reporting goal of the organization. If we want to analyze the month on moth business activities and performance, we would opt to report monthly Income Statement as it covers a shorter period making month on month comparison easier. However, if we want to analyze from a higher level and want to analyze trends over the long term period, then we should opt for a quarterly or annual reporting. Hence, to this this reason choosing the correct reporting period is critical to meet the goals of the organization.
2. Generate a Trial Balance Report
We will need a copy of the Trial Balance report for the reporting period selected above to create an Income Statement. Trial Balance are nothing but internal reports that contains the ending balance of each account in the general ledger for the selected reporting period.
3. Calculation of the Total Revenue
After selection of our reporting period and getting a Trial Balance copy, next we have to calculate the total revenue generated by the business during that period. Income statement can be prepared for the entire Organization as a whole including all the business segment reporting together, or can be prepared standalone for each business segment or both. Total revenue of the entire organization is to be considered when preparing the Income Statement is prepared for all the segments together, and similarly if it is being prepared segment wise, then Revenue generated by that particular segment or business line should be considered.
4. Calculation of Cost of Goods Sold (COGS)
Once the revenue is determined, calculate the cost of goods sold for any product or service that generated revenue and is considered in the Income statement in Step 3 during the reporting period. This COGS includes all the direct and indirect cost associated with producing and selling the products and services. Some of these cost include:
- Direct Labor cost
- Cost of parts and components
- Material Cost
- Cost of Distribution
- Expenses directly linked to the production of the product or rendering of services
5. Calculation of Gross Profit
After the revenue and cost of goods sold are recognized for the given reporting period, we simply need to subtract the COGS from the Revenue to get the Gross profit generated.
6. Calculation of Operating Expenses
Apart from the cost incurred directly or indirectly associated with the production of goods and services, any business incurs other various cost that are crucial for running the business. These cost are different from the COGS as they are not directly or indirectly linked to the products or services rendered. Once, we derive the Gross Profit we shall determine the Operating Expenses incurred for running of the business. Some of the examples of these expenses of OPEX category are as follows:
- Office rent
- Utilities
- Office supplies
- Overheads
- Accounting and Legal Fees
- Wages and Salaries
- Research and Development fees
7. Calculation of Earnings before Interest, Taxes, Depreciation and Amortization (EBITDA)
We get Total Income by subtracting Operating Expenses from the Gross Profit. This Total Income is before deducting the depreciation expenses and pre-tax income generated by the business during the reporting period and is also termed as Earnings before Interest, Taxes, Depreciation and Amortization (EBITDA).
8. Calculation of Depreciation
A business may follow different depreciation methods to calculate depreciation of assets over the reporting period. Some of the common methods are straight line method, declining balance method, units of production method etc. Determine the depreciation amount for your business for the reporting period. Intangible assets are amortized instead of being depreciated.
9. Calculation of the Earnings before Interest and Taxes
We get the Earnings before Interest and Taxes (EBIT), by subtracting the Depreciation and Amortization from the EBITDA.
10. Calculation of Interest
Interest refers to the charges paid by the company on the debt owed by it. The debt scheduled is used to determine the Interest Charges to be considered for the reporting period. In general Interest expense is calculated by two components: how much money is owed by the company and the interest rate being charged. Often the debt schedule is calculated by the accounting software used by the company.
11. Calculation of Earnings before Taxes
To calculate the pre-tax Income generated by the business also termed as Earnings before Taxes (EBT or PBT), subtract Interest from Earnings before Interest and Taxes.
12. Calculation of Taxes
The taxes charged on the pre-tax income are referred to as Income Taxes. These Income Taxes can be both current taxes and future taxes. Different tax rates and different tax laws apply to different countries and to different category of companies.
13. Calculation of Net Income or Earning after Taxes
This is the final step to get the net income generated by the business during any reporting period selected after deducting all the possible income and considering all the possible income. We get Earnings after taxes (also termed as profit after Taxes) by subtracting the Taxes from the Earning before Taxes.
USES OF THE INCOME STATEMENT
Some of the Uses of the Income Statement are as follows:
- Helps in the overall analysis of the company: Any investor before putting its money into the company first analyze its Income Statement in details to understand its performance in the current as well as the past reporting periods. This analysis helps it to determine whether the company is performing consistently or has reported excess or low profits only during any single reporting period. Banks and Financial institutions also use Income Statement along with other financial reports to decide whether the company is loan worthy and analyze different financial ratios to reach to the conclusion whether the company will be able to repay off its debt timely and without default. Companies may use the financial statements of its pear competitors to do its own SWOT analysis.
- Essential report for compliance: Every company have to pay some or the other taxes on the income generated by it during the reporting period and which may vary on the country in which it is operating and the tax laws applicable to the company. The Income statement and other financial statements help the companies to compute their tax liability by providing the essential inputs for calculation. Also, listed companies are required to submit their Financial statements including the Income Statement to the regulatory body of the respective country in which they are registered and operating.
- Helps in better decision making: It enables the business owners with a valuable insight into the operation of their business and makes them aware of the expenses and sources of income. With the detailed reporting of the Income statement, the business owners can make informed decisions like expanding their business to new geographical locations, expanding the production capacities, acquiring new business or curtailing certain expenses, shutting down any department or product line.
- Frequent reporting: Most business analyze monthly income statements to track the performance of the company on a continuous basis and to take corrective measures instantly instead of waiting for the financial year to end.
WHO USES AN INCOME STATEMENT?
An Income Statement is used by mainly two group of people:
- Internal Users
Company Management and Board of Directors: Income statement is used by the company management and board of directors to track necessary changes during any reporting period, makes budgets and forecast and analyze the performance of the company to take informed business decisions. In may make decisions either related to increasing the current source of revenue or expanding the business line or market place to increase the top line or may decide to curtail the expenses to increase the cash flows.
Employees: Employees of the company are directly affected by the performance of the company and the Income statement gives them an insight whether the company for which they are working is making profits or just incurring useless expenses which in turn narrow down the bottom line figures. Some companies also provide stock options to the employees, which make employees all the more interested in its financial performance.
2. External Users
- Investors: Investors use the Income statement to analyze its current, past and future performance and take informed decision whether to invest its money in the company or not. It uses the income statement to compare the performance of the company with its competitors in the industry to decide on its investment decision.
- Creditors, Banks and Financial Institutions: Income statement is used by creditors, banks and financial institutions to decide whether to extend any new loan to the company and whether the company will be able to pay off its debt and interest charges in a timely and default free manner.
- Competitors: It is used by the competitors to conduct their SWOT analysis by comparing its own financial statements with that of the other companies in the industry. It helps the competitor company analyze where it is going wrong, where its needs improvement and which areas it needs to focus and is its main source of revenue generation compared to its competitors.
LIMITATIONS OF THE INCOME STATEMENT
Some of the limitations of the Income Statement are as follows:
- Items that cannot be reliably measured are not reported: Some items that cannot be reliably measured like brand recognition and loyalty are not reported in the Income statement.
- Disparity in the Accounting Methods: Sometimes comparison of two companies based on their Income Statement may require some prior adjustments to be done since different companies using different accounting methods and assumptions. For example: To measure the inventory level (LIFO vs FIFO), some companies may use LIFO basis of accounting while some others may use FIFO or weighted average method of accounting.
- Dependence on Judgements and Estimates: Companies use different accounting Judgements and estimates in certain calculations that impact the Income statement. For example: different companies may use different accounting methods. Even though the accounting method used might be same, the amount of depreciation depends on factors like estimated useful life and salvage value which may differ depending on the discretion of the accountant and management.
COMMON DRIVERS FOR EACH OF THE INCOME STATEMENT ITEM FOR FINANCIAL MODELLING
| Particulars | Assumption or Driver |
| Revenue | Selected year on year growth percentage, pegged growth percentage, Index rates (such as GDP), Price and Volume |
| Cost of Goods Sold (COGS) | Fixed dollar value, Percentage of Sales |
| SG&A | Fixed amount, trend over past period, percentage of sales, fixed dollar value |
| Depreciation and Amortization | Depreciation schedule, Estimate of useful life and salvage value, Depreciation method applied |
| Interest Expense | Debt Schedule, Interest rate, Outstanding Debt Amount, compounding method |
| Income Tax | Federal tax Laws, Percentage of pre-tax income (i.e. effective tax rate) |
The assumptions stated above are just general guidelines as these are commonly followed by most companies. However, apart from these a company may use other drivers according to its assumption and intuition that is best suited for the company and nature of its business. For example, a company may have Nil profits in the past, and hence cannot use the percentage of sales method to determine the COGS and have to resort to other assumption best suited for its business to determine the COGS for the future to forecast the future profitability of the company. Selection of the most suited driver is necessary to forecast the future profits correctly.
FORMAT OF INCOME STATEMENT
Below is the general example of the format of the Income Statement
| XYZ Company | ||||||
| Statement of Income | ||||||
| (in millions, except share amounts) | ||||||
| Fiscal Year Ended | ||||||
| Particulars | 31st March 2022 | 31st March 2021 | 31st March 2020 | |||
| Revenue | 30,000 | 20,000 | 15,000 | |||
| Less: Cost of Goods Sold | 4,545 | 7,678 | 700 | |||
| Gross Profit | 25,455 | 12,322 | 14,300 | |||
| Less: Operating Expenses | 5,433 | 2,456 | 8,765 | |||
| EBITDA | 20,022 | 9,866 | 5,535 | |||
| Less: Depreciation and Amortization | 688 | 454 | 245 | |||
| EBIT (Pre-tax operating income) | 19,334 | 9,412 | 5,290 | |||
| Less: Non-Operating Expenses | 899 | 654 | 45 | |||
| EBT | 18,435 | 8,758 | 5,245 | |||
| Less: Tax | 5,715 | 2,715 | 1,626 | |||
| PAT | 12,720 | 6,043 | 3,619 | |||
INCOME STATEMENT IS USED FOR RATIO ANALYSIS
The Income statement is used by analysts and investors to do various ratio analysis. The standalone figures of revenue, expenses or profit in the Income statement do not tell much and we cannot interpret any result out of those figures unless compared to a base figure. Hence, with the help of ratios comparison becomes easier either it be comparison of performance over a period of time or inter-company comparison. With the help of the real life Income statement of Apple Inc. let’s understand how to calculate some of the ratios to understand and analyze the performance of the company.
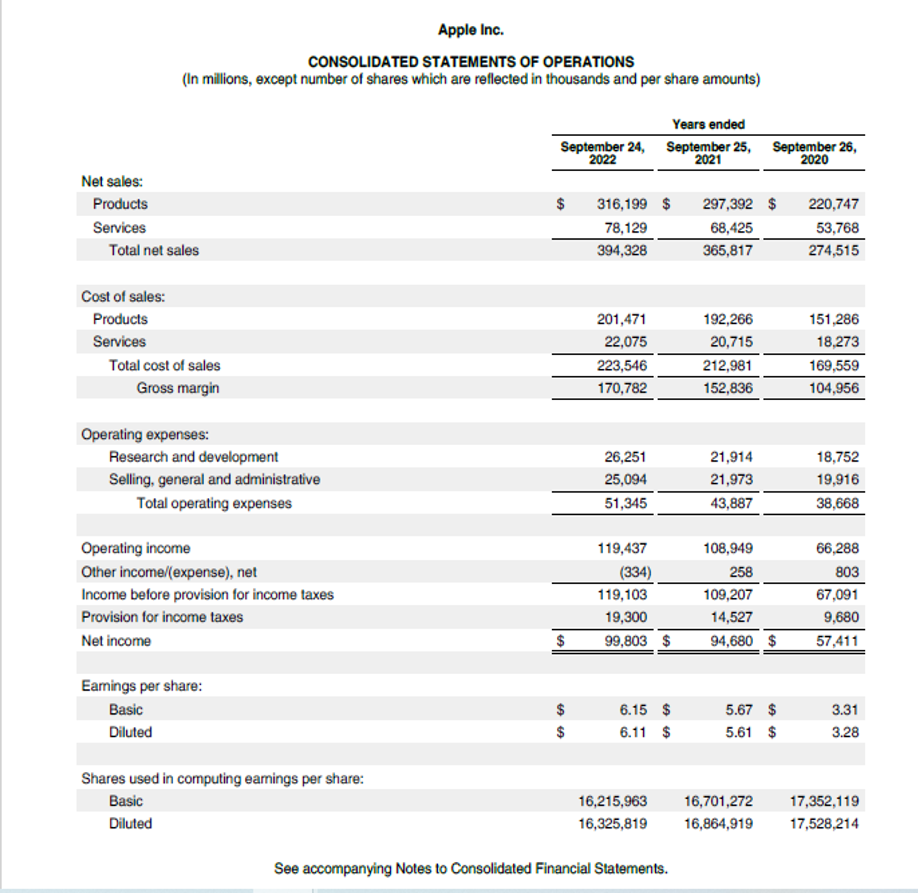
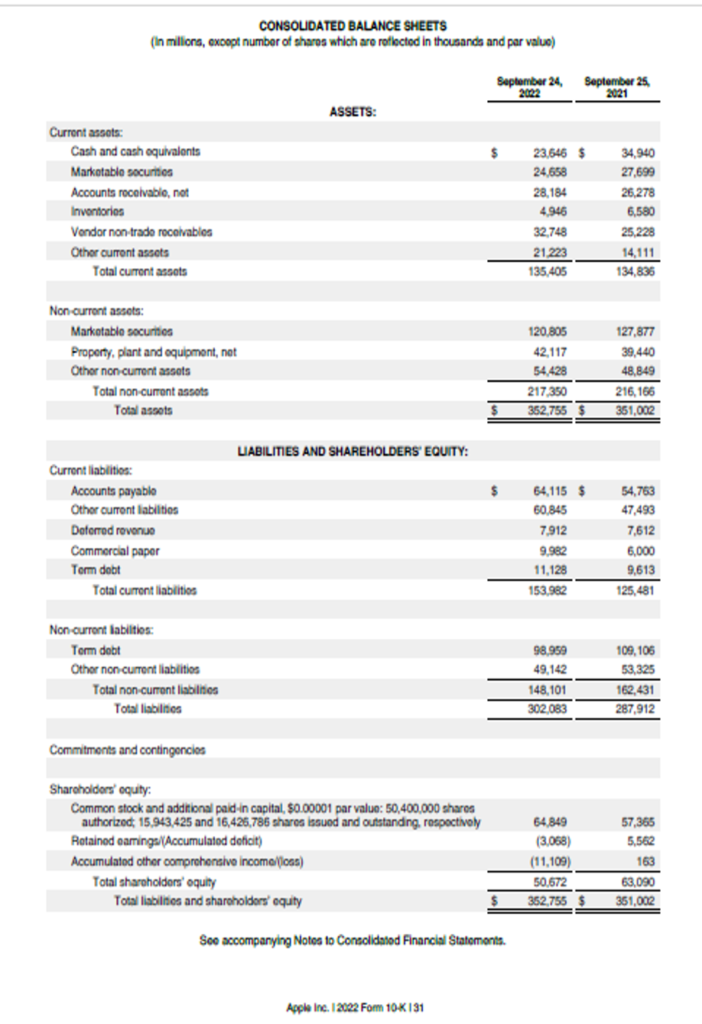
From the given Income statement and Balance Sheet of Apple Inc., we can calculate the following Profitability Ratios:
Return on Sales
| Profitability Ratio | Formula | Year 2022 | Year 2021 | Year 2020 |
| Gross Profit Margin | Gross Profit/Revenue | =170782/394328*100 | =152836/365817*100 | =104956/274515*100 |
| 43.31 | 41.78 | 38.23 | ||
| Operating Profit Margin | Operating Profit/Revenue | =119437/394328*100 | =108949/365817*100 | =66288/274515*100 |
| 30.29 | 29.78 | 24.15 | ||
| Pre-tax Margin | EBT(Earnings before tax but after Interest)/Revenue | =119103/394328*100 | =109207/365817*100 | =67091/274515*100 |
| 30.20 | 29.85 | 24.44 | ||
| Net Profit Margin | Net Income/ Revenue | =99803/394328*100 | =94680/365817*100 | =57411/274515*100 |
| 25.31 | 25.88 | 20.91 | ||
Return on Investment
| Profitability Ratio | Formula | Year 2022 | Year 2021 |
| Operating ROA | Operating Income/Average Total Assets | =119437/352755*100 | =108949/351002*100 |
| 33.86 | 31.04 | ||
| Return on Assets (ROA) | Net Income/ Average Total Assets | =99803/352755*100 | =94680/351002*100 |
| 28.29 | 26.97 | ||
| Return on Equity (ROE) | Net Income/Average Total Equity | =99803/50672*100 | =94680/63090*100 |
| 196.96 | 150.07 | ||
SNAPSHOT OF YEAR ON YEAR COMPARISION OF APPLE INC.’S PROFITABILITY RATIO AND ITS GRAPHICAL REPRESENTATION
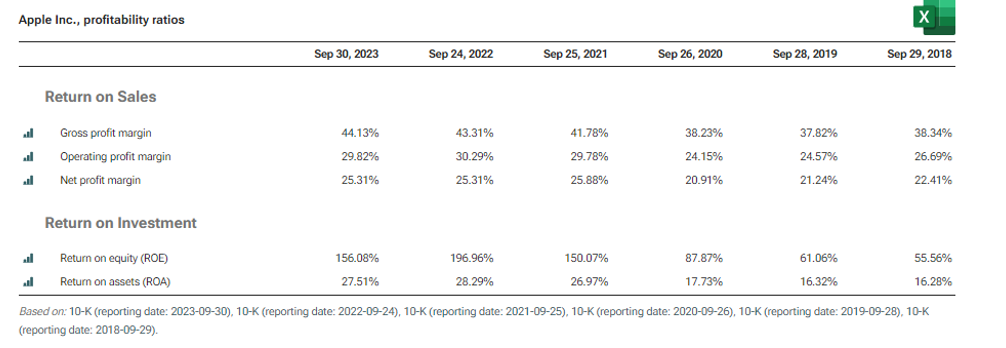
Source: https://www.stock-analysis-on.net/NASDAQ/Company/Apple-Inc/Ratios/Profitability
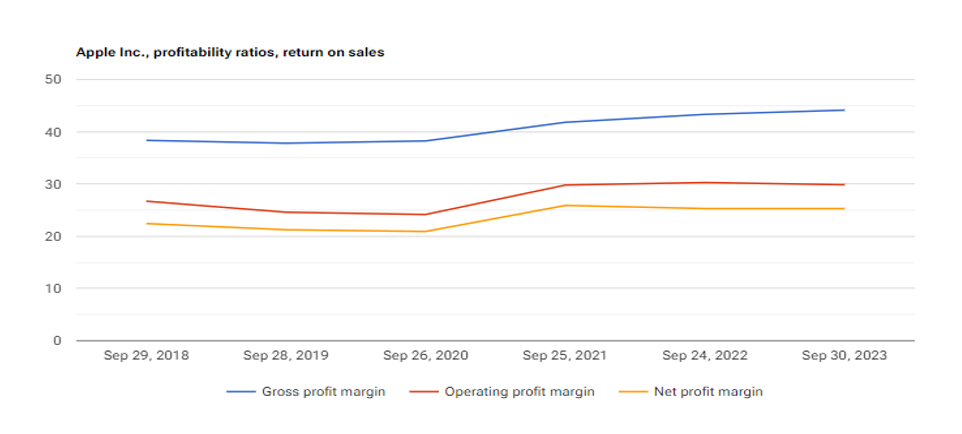
Source: https://www.stock-analysis-on.net/NASDAQ/Company/Apple-Inc/Ratios/Profitability
COMPARISON OF PROFITABILITY MARGIN OF APPLE INC. WIT ITS COMPETITORS
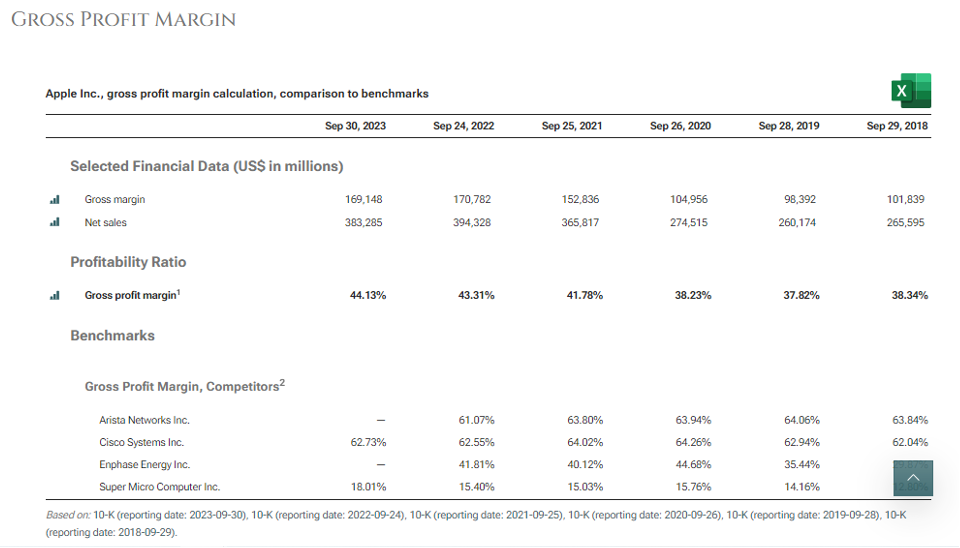
Source: https://www.stock-analysis-on.net/NASDAQ/Company/Apple-Inc/Ratios/Profitability
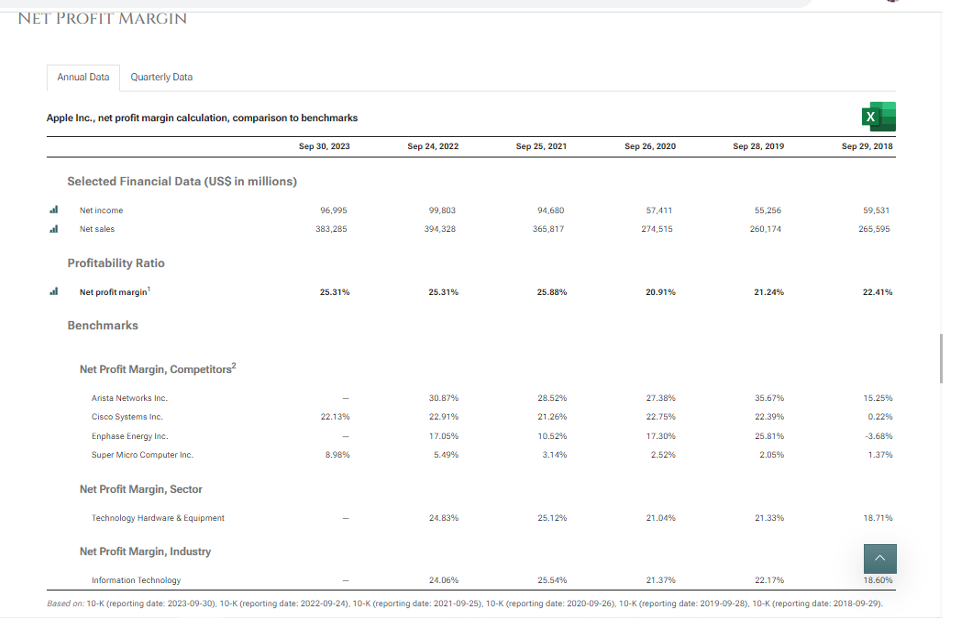
Source: https://www.stock-analysis-on.net/NASDAQ/Company/Apple-Inc/Ratios/Profitability
Note: Other such comparison of profitability ratios can be found on https://www.stock-analysis-on.net/NASDAQ/Company/Apple-Inc/Ratios/Profitability for your reference.
Conclusion: The Income Statement is a pretty straight forward breakdown of the overall profits/losses a company makes in a financial year. The best part of the Income Statement is it allows to see the flow of numbers starting from the revenues a company earns and deducts all operating expense to arrive at the operating profit (EBIT) of a company. This is a very important measure of a the core profitability of a company and can be used for comparisons over time as well as with other competitors. Income Statement does not stop at the operating profit, it does also account for financing related income/expenses to provide Earnings before taxes (EBT). Finally, the income statement deducts direct taxes to government to compute the Net Profit of a company.


43 thoughts on “Income Statement – Did you turn green this time?”
[…] company’s balance sheet shows what assets the company has and its income statement shows how much it has earned. Financial analysts use these two documents, along with other […]
[…] are instead treated as a reduction of retained earnings. Dividends are not reported on the income statement. They are reported in the statement of retained earnings or statement of stockholders’ equity […]
[…] the top most position in the Income Statement it is referred to as the “top line” item of the Income Statement. This is in contrast with the Net Income (gross revenue less total expenses) which is referred to […]
[…] In this step the acquirer prepares the projected financial statements which includes projected income statement, balance sheet and free cash from […]
… [Trackback]
[…] Read More on that Topic: skillfine.com/income-statement/ […]
… [Trackback]
[…] Find More Information here to that Topic: skillfine.com/income-statement/ […]
… [Trackback]
[…] There you can find 89790 additional Information on that Topic: skillfine.com/income-statement/ […]
… [Trackback]
[…] Find More Information here on that Topic: skillfine.com/income-statement/ […]
… [Trackback]
[…] Find More on on that Topic: skillfine.com/income-statement/ […]
… [Trackback]
[…] Read More Information here on that Topic: skillfine.com/income-statement/ […]
… [Trackback]
[…] Find More to that Topic: skillfine.com/income-statement/ […]
… [Trackback]
[…] Find More on to that Topic: skillfine.com/income-statement/ […]
… [Trackback]
[…] Find More to that Topic: skillfine.com/income-statement/ […]
… [Trackback]
[…] Find More on that Topic: skillfine.com/income-statement/ […]
… [Trackback]
[…] Info to that Topic: skillfine.com/income-statement/ […]
… [Trackback]
[…] Info on that Topic: skillfine.com/income-statement/ […]
… [Trackback]
[…] Read More Info here on that Topic: skillfine.com/income-statement/ […]
… [Trackback]
[…] Find More Info here on that Topic: skillfine.com/income-statement/ […]
… [Trackback]
[…] There you can find 71703 additional Information to that Topic: skillfine.com/income-statement/ […]
… [Trackback]
[…] Read More on to that Topic: skillfine.com/income-statement/ […]
… [Trackback]
[…] Find More here on that Topic: skillfine.com/income-statement/ […]
… [Trackback]
[…] Info on that Topic: skillfine.com/income-statement/ […]
… [Trackback]
[…] There you will find 82722 additional Information on that Topic: skillfine.com/income-statement/ […]
… [Trackback]
[…] Read More on that Topic: skillfine.com/income-statement/ […]
… [Trackback]
[…] Here you will find 78552 additional Info on that Topic: skillfine.com/income-statement/ […]
… [Trackback]
[…] Read More on on that Topic: skillfine.com/income-statement/ […]
… [Trackback]
[…] Find More to that Topic: skillfine.com/income-statement/ […]
เว็บขายรหัสฟีฟาย
ต้องการ เว็บขายรหัสฟีฟาย ร้านนี้ปลอดภัย 100% ตอบโจทย์แน่นอน
BRC123 เว็บตรง
BRC123 เว็บตรง เว็บตรงมั่นคงอันดับ 1 ฝากถอนไว ไม่มีขั้นต่ำ
ซื้อหวยออนไลน์
แนะนำเลย ซื้อหวยออนไลน์ เว็บนี้จ่ายหนัก จ่ายเต็ม ไม่มีเลขอั้น ฝากถอนออโต้ 100%
Good post! We will be linking to this particularly great post on our site. Keep up the great writing
I like the efforts you have put in this, regards for all the great content.
I’ve recently started a site, the info you provide on this site has helped me tremendously. Thank you for all of your time & work.
Thank you for the auspicious writeup. It in fact was a amusement account it. Look advanced to more added agreeable from you! By the way, how could we communicate?
hi!,I like your writing so much! share we be in contact more approximately your article on AOL? I need a specialist in this area to resolve my problem. Maybe that is you! Looking ahead to see you.
Looking forward to reading more. Great blog article.Much thanks again. Cool.
520244 546712Superb post but I was wanting to know should you could write a litte a lot more on this subject? Id be really thankful should you could elaborate slightly bit more. Thanks! 529787
534224 952041Some actually valuable details in there. Why not hold some sort of contest for your readers? 592611
49745 406570This really is such a fantastic resource that youre offering and you supply out at no cost. I appreciate seeing sites that realize the worth of offering a perfect valuable resource totally totally free. I genuinely loved reading your submit. 982097
188581 508549I like your writing style really loving this web internet site . 511372
602968 265978Completely pent topic matter, regards for entropy. 837980
901722 520928I think so. I feel your write-up will give those men and women a very good reminding. And they will express thanks to you later 583312
646729 584615Sweet website, super pattern , real clean and utilize genial . 112526