
WHAT IS LEVERAGE RATIO?
A company’s inherent financial risk can be measured by one of the financial instruments called the Leverage Ratio which quantifies the reliance of the company on debt to fund its operations and purchase its assets. The debt incurred by the company is compared to several other accounts in its balance sheet, cash flow statement and the income statement. It is compared to other metrics like cash flow, assets. Total capitalization and operating income, which helps the investors and creditors to better understand the company’s credit risk.
WHY DO WE NEED TO CALCULATE LEVERAGE RATIOS?
Every company required capital to produce goods or render services and to carry out its operations. The equity contribution by the founders or the equity raised from external shareholders and the retained earnings of the company may not always be sufficient for the company to carry out its operation and expand in the long run and the company might need some other sources of fud to expand and grow. The companies aiming for increasing their market share, moving out to new geographical location or attempting to acquire new company may have to resort to debt financing.
The Capital composition of any company consists of the following components:
- Common shares: These are the equity shareholders of the company with basic voting rights and have the lowest claim over the profits of the company. The company may or may not pay out dividends to these class of fund providers.
- Preferred shares: These are considered a blend of both common stock and debt instruments. Preferred shareholders do not have voting rights like the common shareholders, and they enjoy propriety claim over common shareholders. They receive fixed dividend payments similar to the debt providers who receive fixed interest payments.
- Debt: Debt is the amount that is borrowed by the company from the external debt providers like the bank, NBFC, other financial corporations, corporate loans etc. These debt providers enjoy fixed payment of interest and payout of the principal debt amount according to the debt schedule agreed upon. They hold the highest priority amongst the common shareholders and preferred shareholders.
The benefit of using debt capital is that the interest expense is tax deductible which ultimately lowers the taxable income and the tax payable by the company. The cost of debt is lower than the cost of equity. However, debt has its own disadvantages and associated risk. Too much leverage can result in the increased volatility in earnings and also result in default on debt obligations. Hence we cannot say that the use of leverage is good or bad for the company. The issue is always the excess debt which can hold possible solvency risk for the company.
Due to the inherent risk of the debt component in capital structure of the company, investors and creditors often calculate various leverage ratios which help them take decision whether the company will be solvent in the long run and whether to extend any funds to the company.
The leverage ratios can be classified into two broad categories depending from where the figures are taken to calculate the ratio-
- Balance sheet Leverage Ratio
- Cash flow Leverage Ratio
BALANCE SHEET LEVERAGE RATIO
The Balance Sheet Leverage Ratios can be used to determine the amount of dependence a company has on its creditors and long term debt providers to fund its operations. The proportion of debt as opposed to equity in the capital structure of the company is called as the Financial Leverage. The company uses debt to amplify the returns from the operations, any investment or project.
It is important for the companies who are dependent on external financing either to purchase its inventory or fund capital expenditures to know the proportion of debt and equity in the capital structure and whether the Debt to Equity ratio or Debt to Asset ratio is sustainable.
If a company has high leverage it means it is significantly dependent on external debt financing whereas a company with low leverage have its operations and capital expenditure financing mostly done with the internally generated retained earnings.
A high leverage often means more financial risk as the company incurs higher fixed interest expense and regular principal payments as per the debt schedule. However, certain degree of leverage is also important. The shareholders of a company with no or very less leverage claims the same net distributable profits, which results in lower Earnings per share (EPS). The company with no or less leverage is also unable to enjoy the benefit of reduced taxes since interest expense is tax deductible. Also, the cost of debt is less than the cost of equity up to a certain point.
Given the advantages and disadvantages of financial leverage lets discuss some of the most commonly used balance sheet leverage ratios.
- Debt-to-Equity Ratio: The Debt to Equity ratio measures the amount of debt compared to the shareholder’s equity in the company. A high ratio indicates that the company’s operations have been majorly financed using external debt financing. A high debt to equity ratio also indicates that the company has adopted an aggressive approach in financing its growth and operations with debt. This may result in the volatile earnings as a result of increased interest expense and higher risk for the company. The chances of the company’s default to pay back the creditors and loan providers and bankruptcy increases as a result of increased interest expense. The optimal debt-to-equity ratio varies from industry to industry and also the nature of the operations of the company. In general, a Debt-to-equity ratio greater than 2 indicates a risky situation for the investors. However, large companies with regular cash flows or industries that require heavy investment in fixed assets like the mining companies or the manufacturing companies may have ratios higher than 2. A Debt-to-equity ratio of 2 means that the company gets two third of its financing from debt and one third from equity.
FORMULA:
Debt-to-Equity ratio (D/E) = Total Debt/ Total Equity
- Debt-to-Assets ratio: The Debt-to-Assets ratio compares a company’s total debt to its Assets. This ratio shows the degree to which debt has been used by a company to finance its assets. A higher ratio means that the company has purchased majority of its assets using debt financing and reflects higher degree of leverage and higher risk of investing in the company. With this ratio analyst can compare one company’s leverage with another in the same industry. A ratio greater than 1 reflects that the company has used debt more than equity to finance its assets and the company’s liability is greater than its assets. A ratio may be a warning signal for loan providers since the company may default on loan repayment due to high interest rates. A ratio less than 0.5 means a greater portion of assets of the company is financed using equity fund. This provides more flexibility to the company to increase, decrease or stop or delay the dividend payouts to the shareholders, whereas in the case of debt the company locks itself up with fixed interest payments.
FORMULA:
Debt-to-Assets ratio = Total Debt/ Total Assets
- Debt-to-Capitalization ratio: The debt-to-capitalization ratio compares the total debt of the company to the sum of all capital sources, and measures the percentage of debt in the total capital structure of the company. The Numerator i.e. the total debt includes both short term and long term debt of the company while the denominator i.e. the total capital includes short term and long term debt, equity capital, preference capital and Minority interest. A higher ratio indicates that majority of the capital in the company comes from debt and a lower ratio indicates that majority of the capital in the company comes from equity. A higher ratio indicates higher risk for the company as high debt means increased interest payment obligation and higher risk of default by the company. The ideal debt to capital ratio varies from industry to industry and depends on the nature of the business, but in general it should not exceed 0.5. A debt to capital ratio of 0.5 means that half of the capital in the company comes from debt and half from equity. Businesses with regular cash flow can afford a high debt to capital ratio but a company with unsteady cash flow or fluctuating income and expenses should avoid high debt since high debt is linked with high interest payouts.
FORMULA:
Debt-to-capitalization ratio = Total Debt/ (Total Debt+ Equity+ Minority Interest+ Preferred stock)
- Net Debt-to-Total Capitalization ratio: The main assumption behind this ratio is that the cash in the balance sheet can be used to pay existing debt upfront. Thus in this ratio Total Debt is adjusted to account for the available cash balance in the balance sheet.
FORMULA:
Net Debt-to-Capitalization ratio = (Total Debt-Cash)/ (Debt+ Equity+ Minority Interest+ Preferred stock- Cash)
EXAMPLE:
Let’s take a company with the following items in the Balance Sheet:
| Particulars | Amount |
| Total Assets | 90 million |
| Total Debt | 40 million |
| Total Equity | 50 million |
Calculate the common Balance sheet leverage ratios
- Debt-to-Equity ratio = $40/$50 = 0.8x
- Debt-to-Assets ratio = $40/$90 = 0.45x
- Debt-to-Total Capitalization = $40/ $(40+50) = 0.45x
Three of the ratios indicate that the company holds less debt relative to its equity and hence is not in a risky position.
CASH FLOW LEVERAGE RATIOS
Apart from the Balance Sheet approach there is an alternative approach to measure a company’s financial risk which measures if a company’s debt burden can be managed with its cash flow generated. The cash flow leverage ratios measure a company’s debt against the cash flow metric to check if the company’s free cash flow generated supports its debt payments like: interest payouts, debt amortization and repayment of principle amount on scheduled maturity dates. The company’s capacity to have higher debt in its capital structure increases when it has more predictable cash flows and consistent profitability history. The purpose to calculate these ratios is to assess if the cash flow generated by the company can adequately handle its existing debt related payouts.
Let’s discuss some of the common ratios used by analysts and lenders.
- Total Debt-to-EBITDA ratio: This ratio represents the total number of years that is required to pay off the entire debt balance at the current level of EBITDA. This ratio measures the amount of income generated and available with the company to pay off its debt before accounting for interest, taxes, depreciation and amortization expenses. Banks often require the borrowing company to maintain this ratio at certain level as a term to extend the loan. On default of the company to maintain the desired ratio the loan may become payable immediately. This ratio is also used by credit analyst to assess a company’s probability of defaulting on repayment of the issued debt. Companies with high debt to EBITDA may not be able to repay its debt appropriately within time leading to its lowered credit rating. The ideal ratio is not fixed as such and varies from industry to industry. However, a ratio more than 1 means the company has more debt compared to its earnings before interest, tax, depreciation and amortization. In general, a Debt-to-EBITDA ratio above 3 can be a warning signal for some industries.
FORMULA:
Total Debt-to-EBITDA ratio = Total Debt/ EBITDA
- Net Debt-to EBITDA ratio: This ratio represents the total number of years that is required to pay off the entire debt balance net of existing cash on the balance sheet at the current level of EBITDA. This ratio similar to the above discussed ratio, tells us how well a company can manage to pay off its debt with the current level of cash flow generated. If a company has more cash than debt, then the ratio shall be negative. A ratio of 1 to 2 is considered to be safe but companies with ratio greater than 3 may require more predictable cash flows to be sure that it does not default on debt payouts. However, the ideal ratio also depends on the type of industry and nature of operations of the company.
FORMULA:
Net Debt-to EBITDA = (Total Debt- Cash and Cash equivalents)/ EBITDA
- Total Debt-to-EBIT ratio: This ratio represents the total number of years that is required to pay off the entire debt balance at the current level of the operating income i.e. the EBIT. The higher the ratio the more is the risk involved as it reflects the company has more debt than its operating income available to pay off the interest and principle payments related to debt.
FORMULA:
Total Debt-to-EBIT = Total Debt/ EBIT
- Total Debt-to- EBITDA less Capex: This is a more conservative approach and this ratio represents the total number of years that is required to pay off the entire debt balance at the current level of EBITDA, once Capex is deducted from it. The higher the ratio the more is the risk involved as it reflects the company has more debt than its cash flows.
FORMULA:
Total Debt-to-EBITDA less Capex = Total Debt / (EBITDA – Capex)
EXAMPLE:
Let’s say there is a company with the following cash flow and balance sheet items:
| Particulars | Amount |
| Short term debt | $40 million |
| Long Term Debt | $30 million |
| Cash and Cash Equivalents | $5 million |
| EBITDA | $75 million |
| Depreciation and amortization expense | $3 million |
Calculate the common cash flow leverage ratios.
- Total debt to EBITDA = $(40+30)/$75 = 0.93x
- Net debt to EBITDA = $(40+30-5)/$75 = 0.87x
- Total Debt to EBIT = $(40+30)/$(75-3) = 0.97x
The leverage ratios calculated above shows that the company have sufficient cash flows to pay off its debt obligations.
DIFFERENCE BETWEEN LEVERAGE RATIOS AND COVERAGE RATIOS
While the leverage ratio shows us what should be the debt level of the company as compared to its equity, the coverage ratio measures a company’s ability to cover its debt related payments.
Often it is seen that a high leverage ratio is a sign of increased risk as the debt carried by the company is higher resulting in increased risk of default to pay the debt related payments, whereas on the other hand, a high coverage ratio often indicates that the company has sufficient cash flow to cover its fixed debt obligations. A lower leverage ratio is seen as a positive sign whereas a lower coverage ratio is seen as a warning signal, since the company may not timely have the necessary cash flow to pay off the fixed debt payments.
Some of the common Coverage ratios are discussed below.
- Interest Coverage Ratio: This coverage ratio is concerned with the interest payments by the company. In this ratio the operating income is divided by the interest expenses of the company, thereby reflecting the company’s ability to make interest payments. Although the ideal ratio varies from industry to industry, in general a ratio of 3 or higher is considered good. A ratio of 3 means the company has operating income 3 times of its interest liability.
FORMULA:
Interest Coverage Ratio = EBIT (Earnings before Interest and taxes) /Interest Expense
- Debt-Service Coverage ratio: In this ratio the net operating Income is divided by the total debt servicing for a company. This ratio shows whether the company can service its debt related payments i.e. the interest payment and debt amount due on time with the available operating income generated.
FORMULA:
Debt-Service Coverage ratio = EBIT (Earnings before Interest and taxes) / Total Debt Service (Interest+ Loan repayment)
REAL LIFE EXAMPLE ON CALCULATION OF LEVERAGE RATIO
Below are the various leverage ratios of Apple Inc. calculated based on the financial statements of the respective years and comparison of ratios with its competitors.
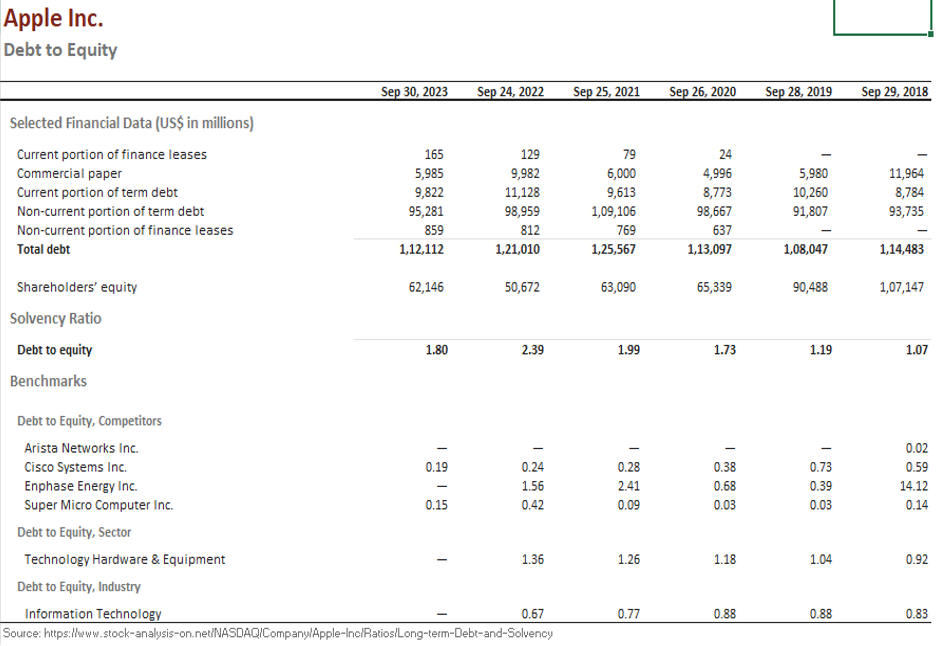
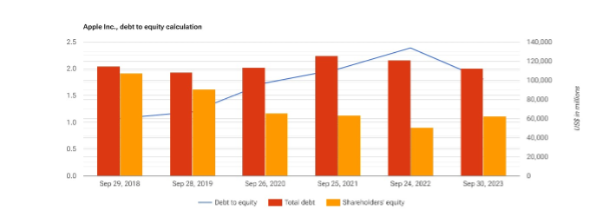
Analysis: From the above chart we can see that in the year 2023 the Debt-to-equity ratio has improved over the last financial year. However, the debt portion in the capital structure of the company remains higher in all the periods considered indicating that the major reliance of the company is on debt financing. Since it is a company with steady cash flows and is a much mature company the debt component in the capital structure is not something to worry about. Also we can see that when compared to its competitors the debt to equity ratio is higher.
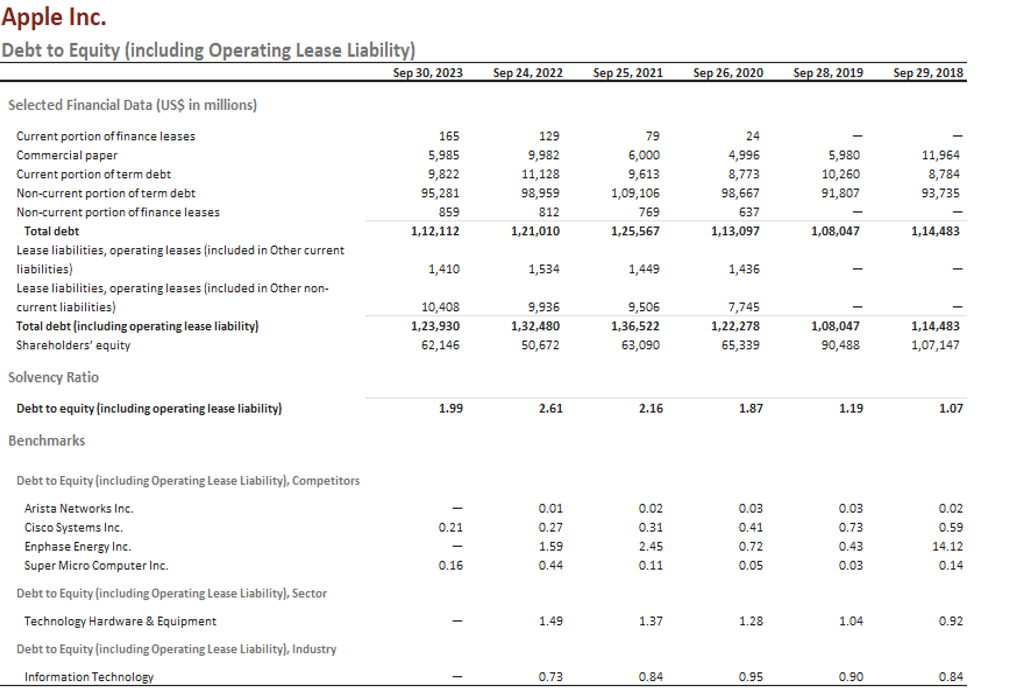
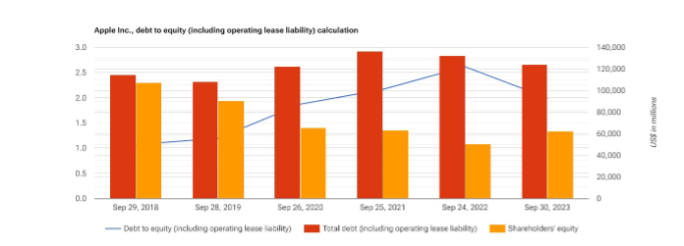
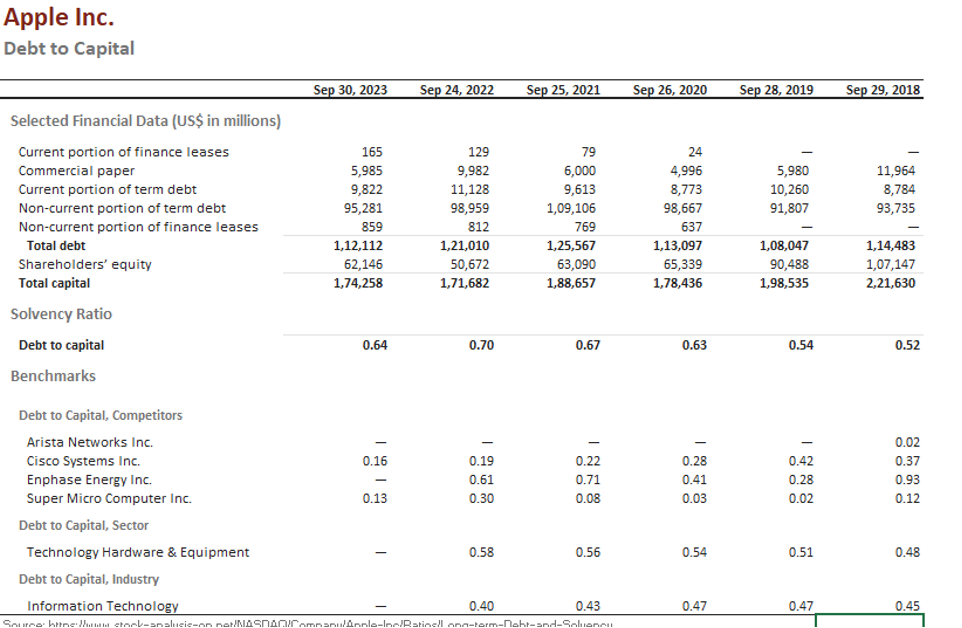
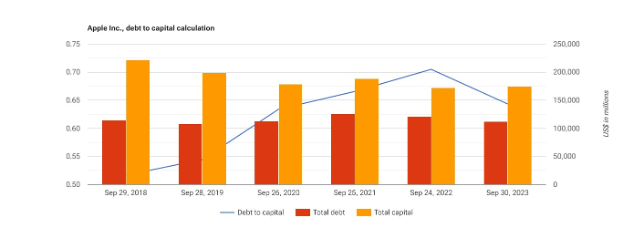
Analysis: From the above calculated debt to Capital ratio we can see that the ratio remains below 1, which means that the debt used in the capital structure is less than the equity and hence the company is not in a danger position.
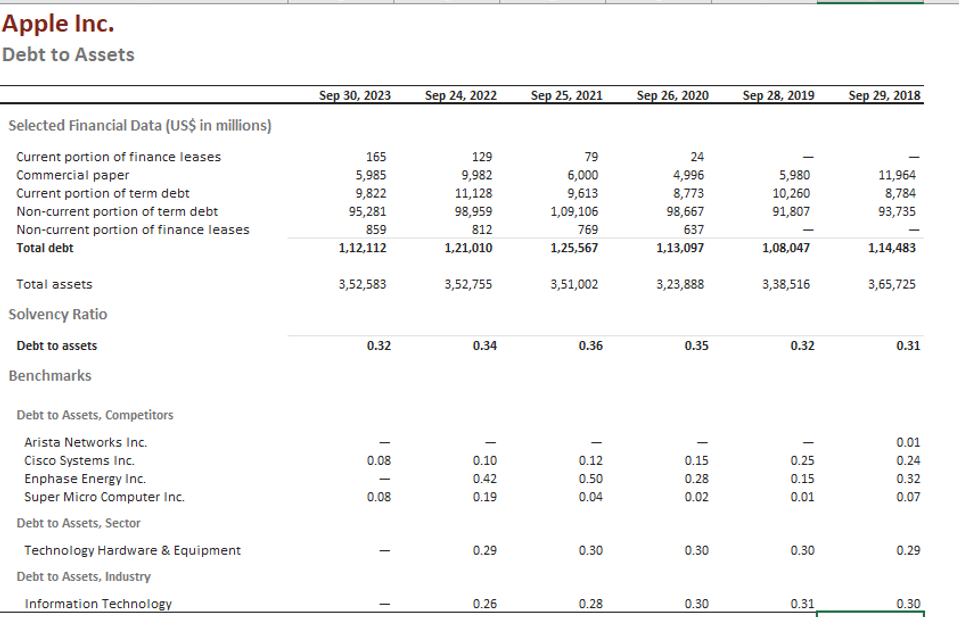
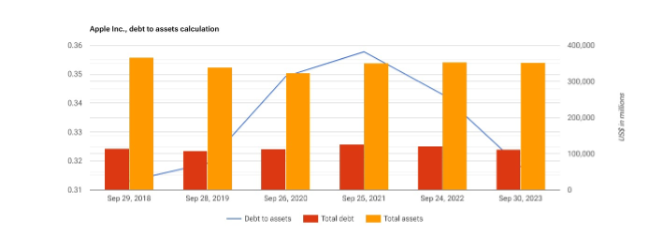
Analysis: From the above calculations we can see that the Debt to Asset ratio for the company remains below 1, which means the total liability of the company is less than its total assets or the assets is majorly financed using equity fund rather than debt fund, and is a positive signal for the investors.
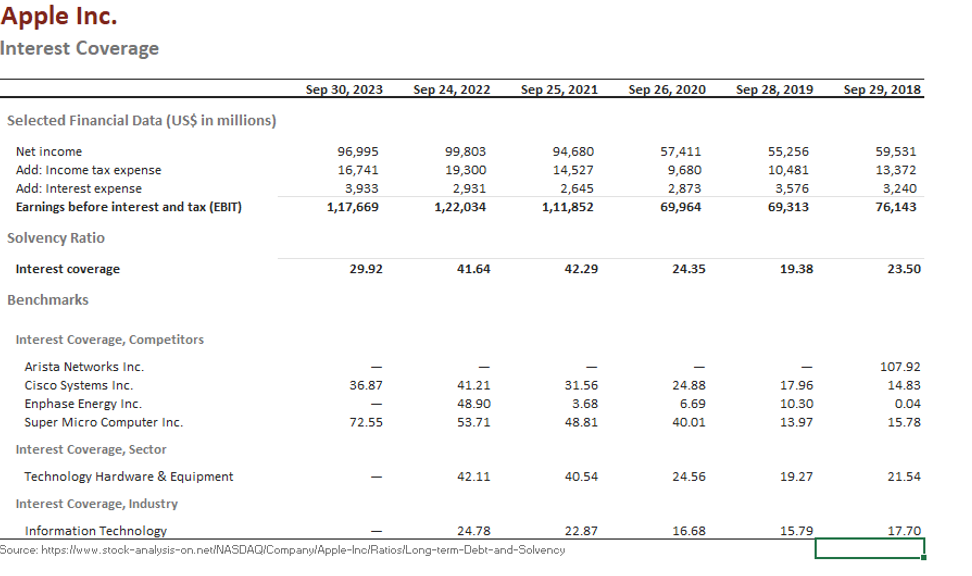
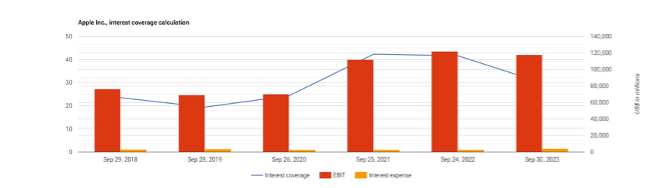
Analysis: From the above calculated data we can see that the company has exceptionally good interest coverage ratio, which means the company generates enough operating income required to pay off its fixed debt interest obligations.
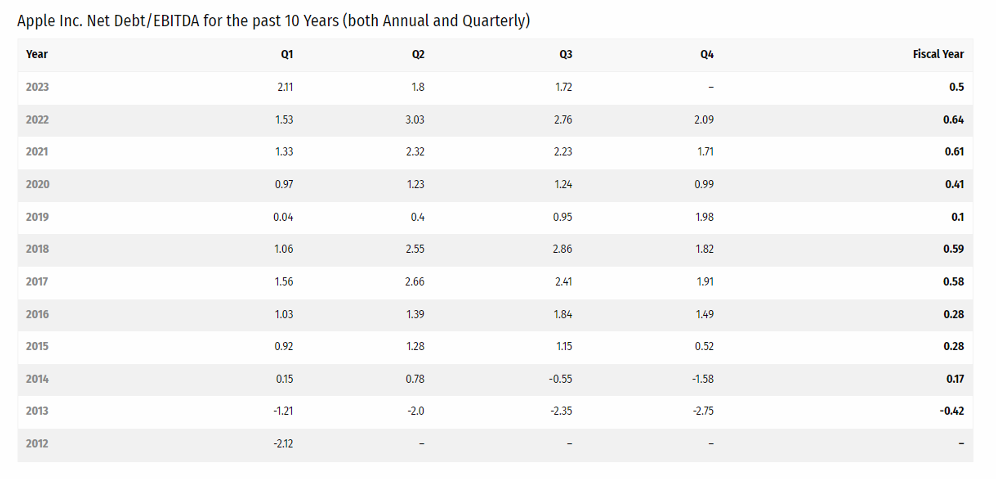
Source: https://stockrow.com/symbol/AAPL/netdebtebitda
Analysis: From the above calculated data we can conclude that the company has generated sufficient EBITDA to cover its debt. Since the ratio remains lower than 1 in all the periods covered it means that the Total debt is less than the EBITDA generated by the company.
Overall Analysis for Apple Inc.
After considering all the leverage ratios calculated above we can conclude that the company has a safe level of debt in its capital structure and the investors can invest in the shares of the company as the risk of default is lower. However, the investors before taking final decisions may look into other financial ratios relevant for making investment related decision.
CONCLUSION
It is important to have a look at the leverage ratios of the company if we are planning to invest our money into the company or extend any loan to the company. The leverage ratios tell us about the health of the company and how solvency status of the company. The leverage ratios tell us whether the company can meet its financial obligations timely and whether it will be a going concern in the coming future.
For a detailed read, check out this post on our LinkedIn page as well:


3 thoughts on “Leverage ratio – will you take debt over equity?”
[…] of a company is the same as its FCF except that rather than the common equity ratio, we use the leverage ratio as the second term in the […]
Сериал про космос – [url=https://sg-video.ru/]звездные врата[/url]
I don’t ordinarily comment but I gotta tell appreciate it for the post on this one : D.
Comments are closed.