The Top Data Analytics Tools to Know in 2021
Are you a budding data analyst? The data analytics tools listed here can make a heck of a difference to you at the workplace. Some of them are absolutely critical
Essential Skills for a Financial Analyst: How to excel in your role
Financial Statement analysis is a process of examining a company’s value or performance by analyzing company’s finance statements, i.e., balance sheet, income statement and cash flows. It is used to
Excel 101: How to Use the SUMIF Function for Powerful Data Analysis
In Excel, we often have multiple dimensional dataset wherein there are more than 1 attribute of the data and corresponding to it, we have certain numerical values. Lets see an
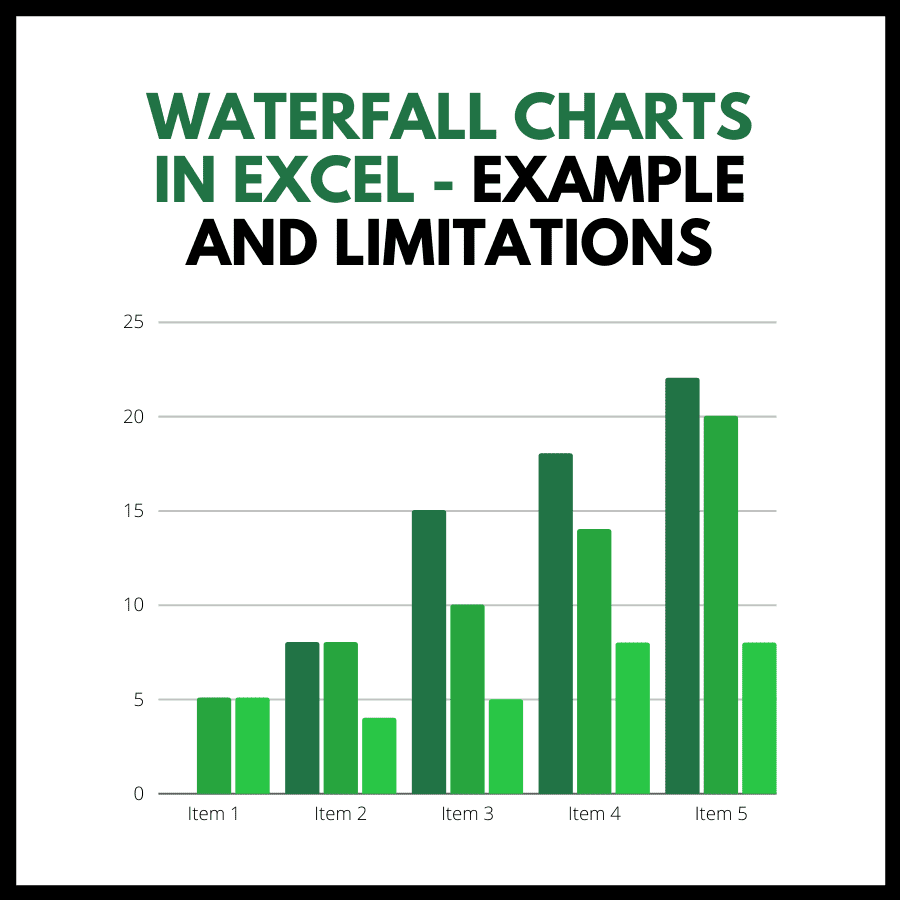
Waterfall Charts in Excel: How to Create and Use Them
What is a Waterfall chart? A waterfall chart is a great way to show variance analysis from one point to the other. These charts help easily visualize the drivers which
Excel Shortcuts for Working with Large Datasets: Tips and Tricks
Posted by Ashish Agarwal All of us use Microsoft Excel for one thing or the other. We spend so much time looking at rows and rows of data. However, browsing through
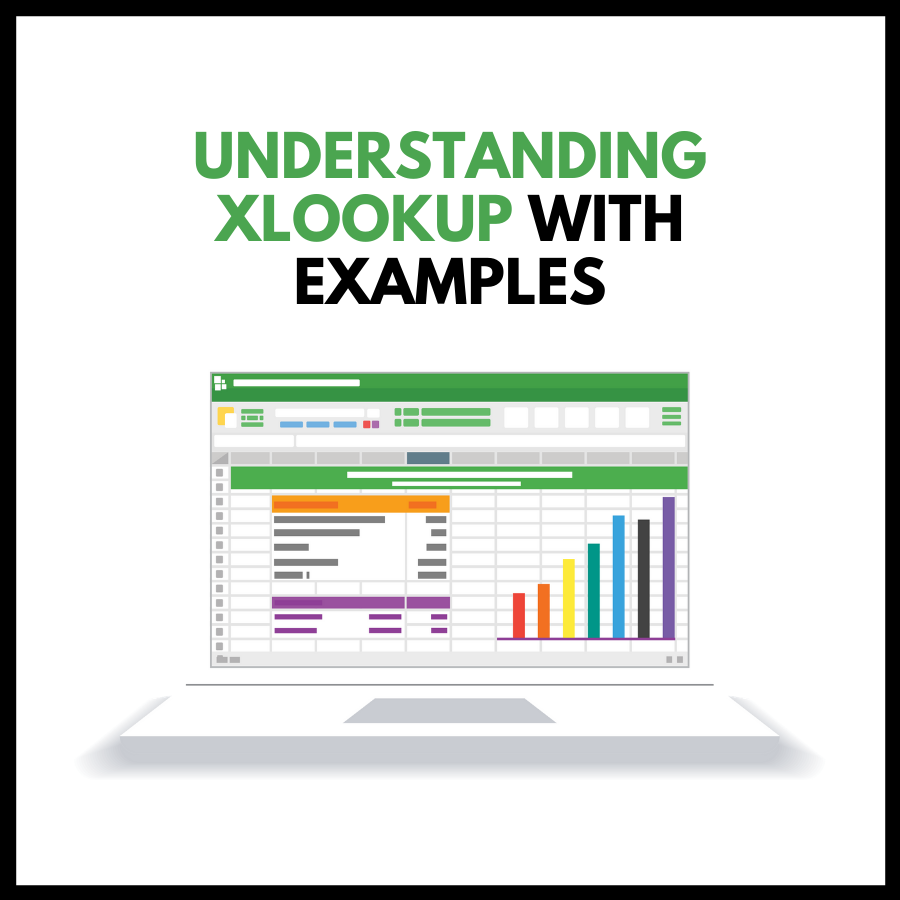
XLookup in Excel: A Comprehensive Guide with Examples from Skillfin Learning
XLOOKUP is a function which is newly introduced function in MS Office 365. It can be used in place of VLOOKUP as well as HLOOKUP, Index, Match and much more. Here
Data Automation Using Excel: A Step-by-Step Guide
Excel has been around for more than 30 years now, and it still remains the best tool for data automation. Entering data is a laborious process, which takes up a
Is Microsoft Excel Becoming Replaced by Other Tools?
MS Excel has been around for more than 30 years now. Microsoft CEO Satya Nadella calls it his company’s most important consumer product. Accountants and bookkeepers swear by it, as do
Data Visualization with Excel Charts: A Comprehensive Guide
What are Excel Charts? An Excel chart is a graphical representation of data. It helps provides an opportunity to tell a compelling story to the audience through data visualization.
Data Analysis and Reporting with Pivot Tables: Tips and Examples
Do you know about Pivot Tables? Pivot Tables is a great tool in excel. It helps prepare reports and get insights from huge data sets with just a few clicks.

