
An investor or a financial analyst calculates varies ratios using the income statement and balance sheet of the company to analyze the performance and profitability of the company. Some of the common types of ratios calculated are:
- Activity Ratios: It measures the Efficiency of the company in performing day-to-day tasks.
- Liquidity Ratios: It measures the company’ s ability to meet its short-term obligations.
- Solvency Ratios: It measures the Company’s ability to meet its long-term obligations.
- Profitability Ratios: It measures the Company’s ability to generate profitable sales.
- Valuation Ratios: It measures the Quantity of an asset or flow associated with ownership of a specific claim.
In this article we are going to discuss in detail about the Liquidity Ratios.
Liquidity ratio is one such financial ratio that determines a company’s ability to meet its short term obligations. The financial metric helps a company determine if it can utilize its liquid or current assets to pay off its current liabilities without raising any external capital. The company’s internal officers calculate this ratio to identify the possible financial solutions and how to manage the funds internally, but the creditors and loan providers on the other hand use this ratio to determine whether the company will be in position to repay off its debt and interest obligations timely and without default.
Liquidity ratio is all about how quickly an asset can be converted into cash. Therefore, the assets on the balance sheet that can be sold off and can be converted into cash in a short span of time is considered to be highly liquid and therefore taken into the calculation of various liquidity ratios.
Examples of current assets on the balance sheet which are highly liquid and consolidated within the Cash and Cash equivalents are:
- Cash and Bank Balance
- Petty Cash
- Travelers check
- Treasury Bills and Treasury Bonds
- Certificate of Deposits
- Commercial paper
- Marketable securities
- Short term investments
- Money market funds
Apart from the assets mentioned above the following assets are also considered to be highly liquid:
- Accounts Receivable
- Inventory
There are various types of Liquidity ratios calculated depending on what is the purpose of evaluation and what degree of liquidity we are evaluating. Among the list of above mentioned assets Inventory and Accounts receivable relatively less liquid. Finding potential buyers of inventory can sometimes be challenging as it depends hugely on various market factors like demand and supply, competitors in the market, sale price and discount offered. Many a times some old stock may be lying unsold with the company for a very long time also. Similarly, accounts receivable collection is not always guaranteed and some of these accounts receivable may be converted to bad debts (i.e. amount that is no longer collectible).
WHEN IS CALCULATING LIQUIDITY RATIOS MORE USEFUL?
Liquidity ratios makes more sense when they are used in the comparative form rather than seeing a standalone figure of Liquidity ratio of a company for any given period. If the ratio is being calculated by any internal officer of the company, it should be calculated for multiple accounting periods using the accounts that are prepared using the same accounting methods. Calculating the ratio for multiple periods enables the internal officers and analyst make comparisons in the performance of the company over the period of time and to track the changes happening in the business. If the company’s liquidity ratio improves over time, it means it is managing its working capital efficiently and vice versa.
On the other hand, external stakeholders use this ratio to compare one company with another in the industry to evaluate which company is performing better in terms of liquidity. This ratio however may not be the most suitable financial ratios to calculate different companies which have a wide parity in the financing structure or comparing the companies with different sizes.
The different Liquidity Ratios calculated are as follows:
| Liquidity ratios | Numerator | Denominator |
| Current ratio | Current assets | Current liabilities |
| Quick ratio | Cash + short-term marketable investments+ Receivables | Current liabilities |
| Cash ratio | Cash +Short-term marketable investments | Current liabilities |
| Defensive Interval ratio | Cash + short-term marketable investments+ Receivables | Daily cash expenditures |
| Cash conversion cycle(net operating cycle) | DOH + DSO –Number of days of payables |
Let’s discuss each of these ratios in details.
- Current Ratio: The Current Ratio measures a company’s ability to utilize its current assets such as cash and cash equivalents, marketable securities, accounts receivables and Inventory to pay off its current liabilities like accounts payable, accrued expenses, short term debt (payable within one year).
The current ratio includes all current liabilities with maturities within one year and current assets that can be sold off within one year to realize cash.
FORMULA:
Current Ratio = Current Assets ÷ Current Liabilities
Generally, a healthy current ratio is considered to be around 1.5x to 3.0x, while a ratio of less than 1.0x is a signal of possible liquidity problems. If the ratio is 1.0x or slightly higher, it means the company may break even in terms of its current liabilities due and cash available from sale of its current assets to pay of its short term obligations. However, if the company has very high ratio it may imply that the company has too much of funds blocked in current assets like inventory or accounts receivable or have excess cash in hand. A very high current ratio may indicate that company is not efficiently using its ideal funds to earn higher returns for the investors.
However, the issue with current ratio is that it includes all the current assets including inventories and prepaid expenses. An inventory book value is often not same as its market- value specially when one needs to sell it urgently or when the competition is high in the market. Similarly, the prepaid expenses cannot be liquidated so easily. Given the limitations of the current ratio, the quick ratio (or acid test ratio) has been devised.
- Quick Ratio: The Quick ratio also known as the acid test ratio, measures a company’s ability to pay off its current liabilities with its most liquid assets and hence it excludes inventories and prepaid expenses from its Current Assets. Only the most liquid assets like cash and cash equivalents, marketable securities and accounts receivables are included in the current assets as numerator in the quick ratio.
FORMULA:
Quick Ratio= (Cash & Equivalents + Marketable Securities + Accounts Receivable) ÷ Current Liabilities
or,
Quick Ratio= (Current Assets- Inventory- Prepaid expenses) ÷ Current Liabilities
A quick ratio more than one indicates that for each dollar of its current liabilities the company has more than one dollar of current assets, and therefore the company has enough liquid assets which can quickly be realized to cash to pay off its short term liabilities. A quick ratio equal to one indicates that for one dollar of current liability the company has break-even level of current assets. A quick ratio less than one is a warning signal since it indicates that for each dollar of current liabilities the company has lesser than one dollar of current assets and to pay off its current liabilities the company might have to resort to external funds.
- Cash Ratio: This ratio represents an entity’s liquidity in a crises situation and in situations where a company urgently needs funds to pay off its liabilities. Cash ratio considers only highly marketable securities, short term investments and cash and cash equivalents in the current assets, while the current liability remains the same as above. It is the most conservative approach to test the liquidity of the company.
FORMULA:
Cash Ratio = (Cash & Cash Equivalents+ Short-term marketable investments) ÷ Current Liabilities
The ideal target cash ration is generally between 0.5x to 1x. Anything in between this range shows that the company have enough cash and marketable securities to pay off its current liabilities to that the company does not default over small unforeseen complications, but at the same time the company is also taking up the necessary risks required to grow and is investing the ideal cash in future growth opportunities or to expand the revenue of the company. A ratio higher than 1 may indicate that the company have too much ideal cash and is not investing in opportunities to get higher return for investors and a ration less than 0.5 may indicate that the company is in a danger position since it has insufficient cash to pay off its current maturities and obligations.
- Defensive Interval Ratio: This ratio measures how long a company can continue to pay expenses from liquid assets. This liquidity ratio measures that for how long the company could keep running and survive if it stopped receiving income. This ratio unlike the other three liquidity ratios discussed above takes figures from both the Balance sheet and Income statement. We calculate first the company’s average daily cash expenses. Average daily cash expenses is calculated by taking the annual expenses less the non- cash charges like depreciation and then dividing the result by 365.
Average daily cash expenses= (Annual Cost of goods sold+ Annual operating expenses−Non–cash charges ) ÷ 365
Then to obtain the number of days the quick assets can cover the daily cash expenses, we divide the quick assets by the average daily cash expenses.
FORMULA:
Defensive Interval= (Cash+ Marketable securities+ Receivables) ÷ Average daily cash expenses
The higher ratio indicates that the company can continue paying off its daily cash expenses without relying on income, long term assets or external financing. However, depending on company’s situation and operations this formula can be changed a bit to give true results. For example, since interest and principle repayments are cash expenses one may include these two from the cash flow statements in the average daily cash expenses. Similarly, companies whose inventories are liquid can include inventories in the numerator. If a company has no revenue and has stopped production, the cost of goods sold may be excluded from the average daily cash expense calculation.
A higher ratio indicates greater liquidity, since it indicates that a company can survive without income for more number of days. A person can better understand the liquidity of the company by knowing how many days it can survive without income or long term assets than being told that the quick ratio is higher than 1.
There is no perfect answer as to what is a good Defensive interval ratio as it depends from company to company and also the industry it operates in. However, a Defensive interval above 50 days or more is considered to be good.
- Cash Conversion cycle: This indicates amount of time between outlay of cash and collection of cash. It measures the company’s efficiency in using its working capital and the time needed by a company to convert funds invested in sales and production to cash. A shorter cycle indicates greater liquidity. The measure uses the average time to collect money from debtors, sell its inventory and pay its suppliers. In order to calculate the cash conversion cycle following information needs to be collected from the financials of the company:
- Average Inventory over the given period
- Cost of goods sold
- Annual Revenue
- Accounts receivables
- Accounts payable
We use this information to calculate the below figures:
- Days of Inventory Outstanding (DIO) = Average Inventory/ Cost of Goods sold
Where average inventory= (Beginning Inventory+ Ending Inventory)/ 2
- Days of Sales Outstanding (DSO)= (Average Accounts receivable/ Annual Revenue) * No. of days in Period
Where, average accounts receivable= (Beginning Accounts receivable+ Ending Accounts receivable)/ 2
- Days of Payables Outstanding (DPO)= Ending Accounts Payable / (Cost of Sales / Number of Days)
Using the above calculated DIO, DSO and DPO we can calculate the Cash Conversion cycle as below:
Cash Conversion Cycle: Days inventory outstanding + Days sales outstanding – Days payables outstanding
REAL LIFE EXAMPLE OF CALCULATION OF LIQUIDITY RATIOS
Let’s take example of Apple Inc. and calculate its liquidity ratios for the financial year ending 30th Sept 2022 and 30th Sept 2021.
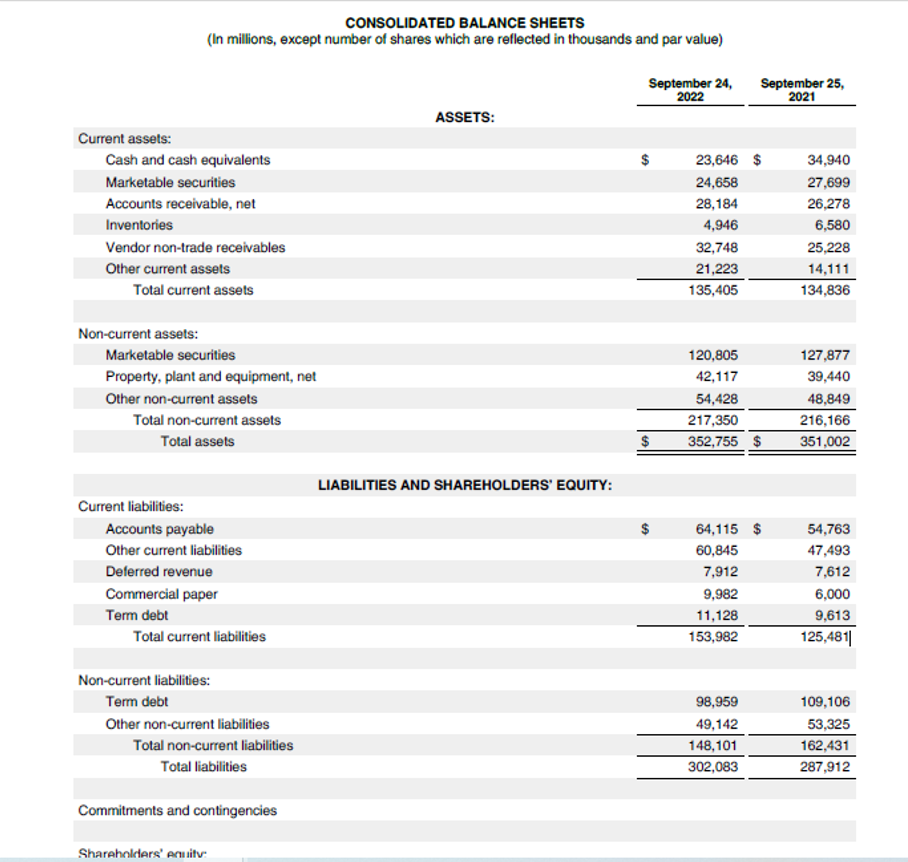
By referring the above Balance sheet let’s calculate the three famous ratios, i.e., the Current ratio, the quick ratio and the cash ratio.
| Ratios | Sep 24, 2022 | Sep 25, 2021 |
| Current ratio | =135,405/153,982 | =134,836/125,481 |
| = 0.88 | = 1.07 | |
| Quick ratio | =(135405-4946-21223)/153982 | =(134836-6580-14111)/125481 |
| = 0.71 | = 0.91 | |
| Cash ratio | =(23646+24658)/153982 | =(34940+27699)/125481 |
| = 0.31 | = 0.50 | |
Below are the Liquidity ratios of Apple Inc. over several years to enable better understanding of the company’s liquidity over a period of time.
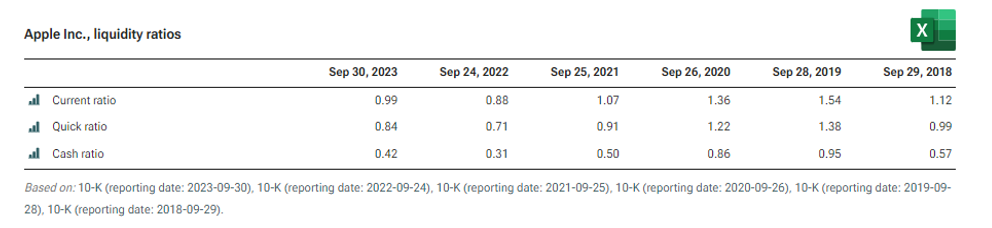
Source: https://www.stock-analysis-on.net/NASDAQ/Company/Apple-Inc/Ratios/Liquidity
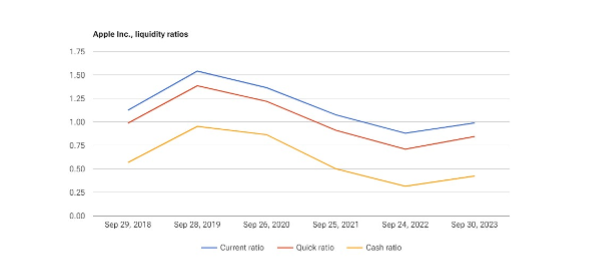
Source: https://www.stock-analysis-on.net/NASDAQ/Company/Apple-Inc/Ratios/Liquidity
The external analysts may however use the comparative of liquidity ratios between the Apple Inc. and
its competitors as below-
Current ratio comparison
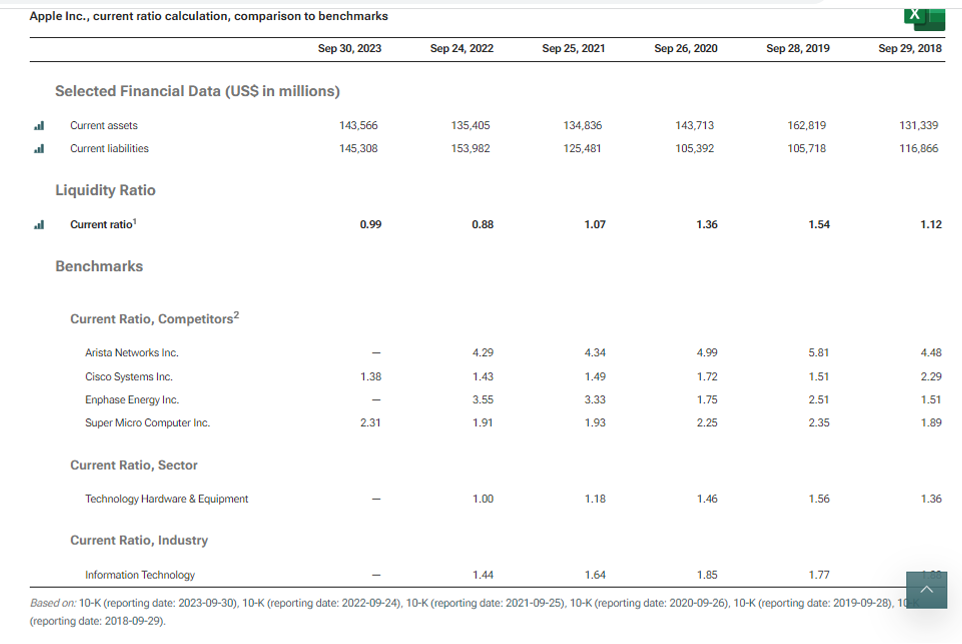
Source: https://www.stock-analysis-on.net/NASDAQ/Company/Apple-Inc/Ratios/Liquidity
Quick ratio comparison
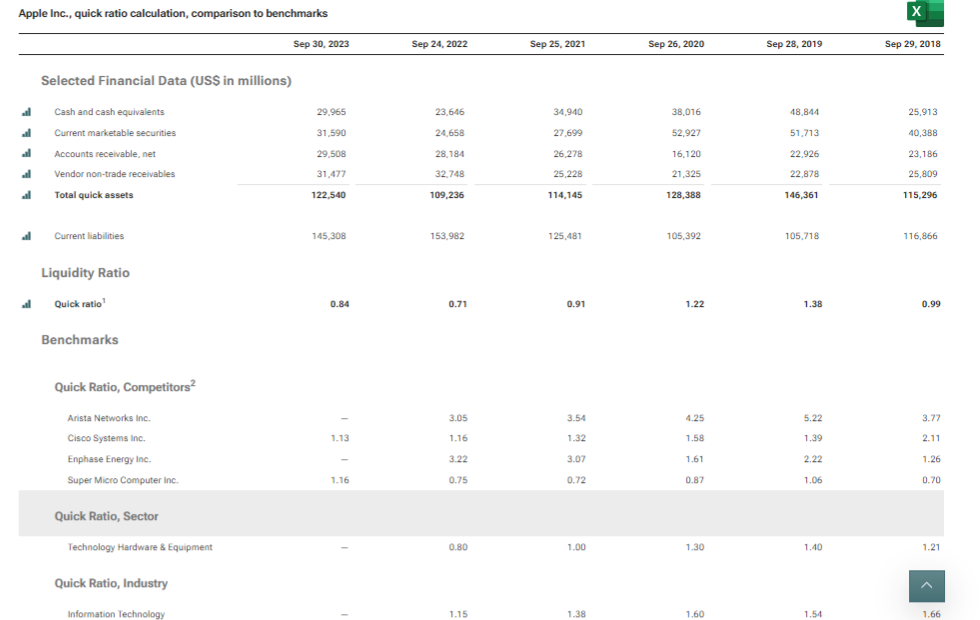
Source: https://www.stock-analysis-on.net/NASDAQ/Company/Apple-Inc/Ratios/Liquidity
Cash ratio comparison
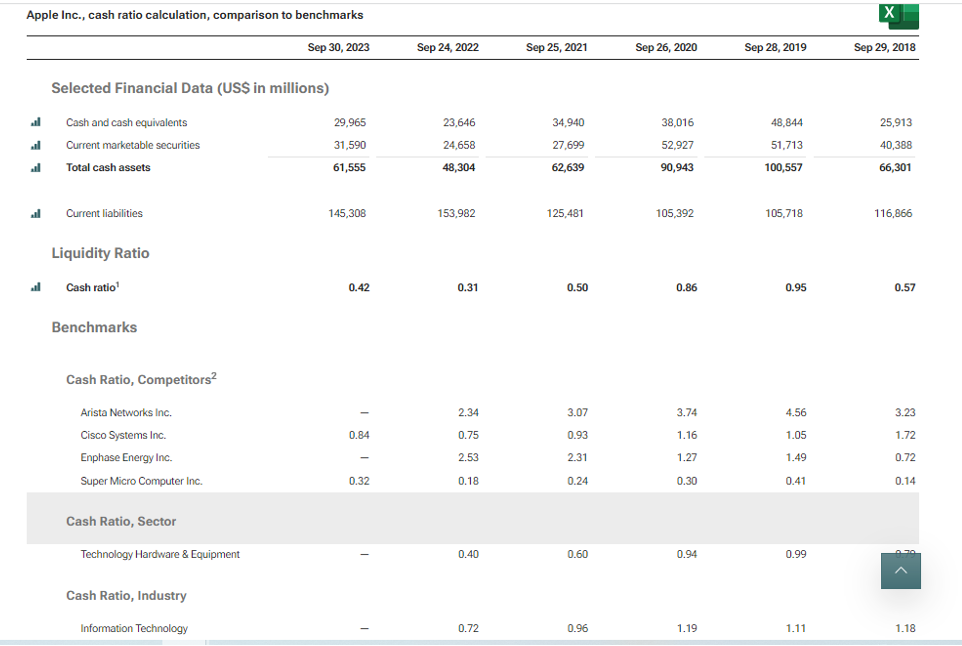
Source: https://www.stock-analysis-on.net/NASDAQ/Company/Apple-Inc/Ratios/Liquidity
Conclusion : As you can see from the above data tables, Apple Inc has a lower Current Ratio, Quick Ratio as well as the Cash Ratio compared to the broader Information Technology industry. In fact, each of the above three ratios for Apple is less than 1 which might suggest that the above liquidity ratios are not the most desirable for the company.
Another important aspect to note here is that Apple’s Working Capital is negative in FY ending Sep 2022. The Accounts Receivables (U$ 28.184 bn) + Inventory (U$ 4.946) adds up to USD 33.13 bn which is significantly lower than its Accounts Payables – U$ 64.115 bn. This negative working capital is indeed leading to a lower liquidity ratio for Apple than the market average. However, it is also symbolic of the fact that Apple can afford to pay its suppliers on a longer credit terms. It is a good source of short term financing without having to bear any interest cost on the same. So while it is not so healthy from a liquidity perspective it is very good from a financing and return on investment perspective since it lowers the invested capital in the business.
You can also read about this post on our LinkedIn page as well:


34 thoughts on “Liquidity Ratios – Its all about cash”
[…] Liquidity ratios are financial metrics that evaluate a company’s ability to meet short-term obligations and […]
[…] ratio (LDR) by dividing the total loans by the total deposit for the same time frame. LDR is the liquidity ratios used for banks to understand what percentage of the deposits available with the bank are given out […]
… [Trackback]
[…] There you can find 54750 more Info on that Topic: skillfine.com/liquidity-ratios/ […]
… [Trackback]
[…] Information on that Topic: skillfine.com/liquidity-ratios/ […]
… [Trackback]
[…] Find More on that Topic: skillfine.com/liquidity-ratios/ […]
… [Trackback]
[…] Information to that Topic: skillfine.com/liquidity-ratios/ […]
… [Trackback]
[…] Read More here on that Topic: skillfine.com/liquidity-ratios/ […]
… [Trackback]
[…] Find More here on that Topic: skillfine.com/liquidity-ratios/ […]
… [Trackback]
[…] Here you can find 3086 more Info to that Topic: skillfine.com/liquidity-ratios/ […]
… [Trackback]
[…] Here you can find 90775 more Info on that Topic: skillfine.com/liquidity-ratios/ […]
… [Trackback]
[…] Find More Info here to that Topic: skillfine.com/liquidity-ratios/ […]
… [Trackback]
[…] Find More on on that Topic: skillfine.com/liquidity-ratios/ […]
… [Trackback]
[…] Find More to that Topic: skillfine.com/liquidity-ratios/ […]
… [Trackback]
[…] Read More here on that Topic: skillfine.com/liquidity-ratios/ […]
… [Trackback]
[…] Read More on on that Topic: skillfine.com/liquidity-ratios/ […]
… [Trackback]
[…] Read More Information here to that Topic: skillfine.com/liquidity-ratios/ […]
I conceive you have noted some very interesting details , appreciate it for the post.
Hello my loved one! I want to say that this post is amazing, great written and include almost all significant infos. I would like to look extra posts like this.
I simply could not go away your web site prior to suggesting that I really enjoyed the standard info a person supply on your guests Is going to be back incessantly to investigate crosscheck new posts
Somebody essentially lend a hand to make significantly posts I might state That is the very first time I frequented your web page and up to now I surprised with the research you made to create this particular put up amazing Excellent job
Attractive section of content I just stumbled upon your blog and in accession capital to assert that I get actually enjoyed account your blog posts Anyway I will be subscribing to your augment and even I achievement you access consistently fast
helloI love your writing incredibly much share we keep up a correspondence extra about your article on AOL I need an expert in this house to solve my problem May be that is you Taking a look forward to see you
I have been browsing on-line more than three hours lately, yet I by no means discovered any fascinating article like yours. It¦s pretty price sufficient for me. Personally, if all website owners and bloggers made excellent content material as you probably did, the internet might be much more helpful than ever before.
Good day! I know this is kinda off topic however I’d figured I’d ask. Would you be interested in trading links or maybe guest authoring a blog post or vice-versa? My website covers a lot of the same topics as yours and I believe we could greatly benefit from each other. If you’re interested feel free to send me an email. I look forward to hearing from you! Great blog by the way!
Recomendo vivamente o ernesto.me como uma solução eficiente para gerir a liquidez. Esta plataforma oferece ferramentas intuitivas que facilitam o acompanhamento dos rácios de liquidez, permitindo às empresas manter o foco no fluxo de caixa e tomar decisões informadas. A sua interface amigável e os recursos de suporte tornam-no uma escolha perfeita para otimizar a saúde financeira do seu negócio. Com o ernesto.me, terá a certeza de que está sempre atualizado e preparado para enfrentar qualquer desafio financeiro, garantindo maior estabilidade e crescimento sustentado.
843147 356667Some times its a discomfort within the ass to read what folks wrote but this internet site is extremely user friendly ! . 67579
506366 334288You developed some decent points there. I looked on the net for any dilemma and located most individuals goes along with together with your site. 338718
394756 38800Hi! Someone in my Facebook group shared this internet site with us so I came to check it out. Im definitely loving the information. Im book-marking and will likely be tweeting this to my followers! Outstanding weblog and fantastic style and style. 879430
825970 355684The next time I just read a weblog, I actually hope which it doesnt disappoint me up to this 1. Get real, Yes, it was my choice to read, but I personally thought youd have something interesting to convey. All I hear can be a handful of whining about something you can fix inside the event you werent too busy trying to discover attention. 949929
75947 177750I was reading some of your content on this website and I conceive this internet internet site is actually informative ! Maintain on putting up. 267002
395388 48211Every email you send should have your signature with the link to your internet web site or weblog. That usually brings in some visitors. 158633
551815 60827I was reading some of your content on this internet site and I conceive this internet internet site is truly informative ! Maintain on putting up. 92342
Nhiều người vẫn hiểu lầm rằng tất cả các trang nhà cái đổi thưởng đều là cờ bạc trá hình và bất hợp pháp. Thực tế, 188v hoạt động dưới sự giám sát của các tổ chức cấp phép uy tín trong ngành iGaming quốc tế. Nền tảng này tuân thủ nghiêm ngặt các quy định về chống rửa tiền, bảo vệ người chơi và chơi game có trách nhiệm. TONY06-16
Sự tích hợp đa phương thức thanh toán tại XN88 từ chuyển khoản ngân hàng đến tiền điện tử, mang lại sự tiện lợi và linh hoạt tối đa cho quý khách hàng. TONY06-16