
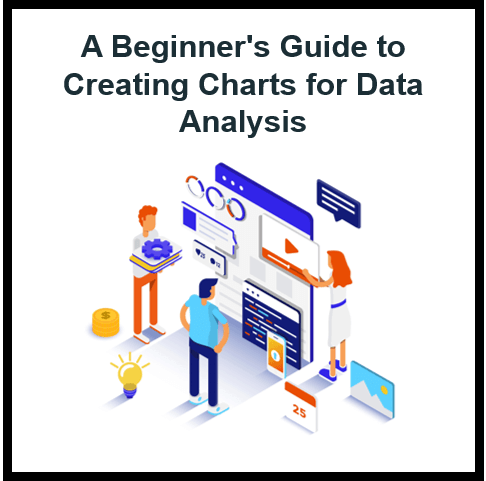
Creating Excel Charts for Data Analysis: A Beginner’s Guide
Data visualization has become an important tool for businesses who want to make sense of their information and make decisions based on that information. Increasingly, organizations have started using Excel

Create Data Automation Reports on Your Own
It is not uncommon for businesses that want professional reporting to invest in data automation software. But what about the worker who needs a quick report, or the person who
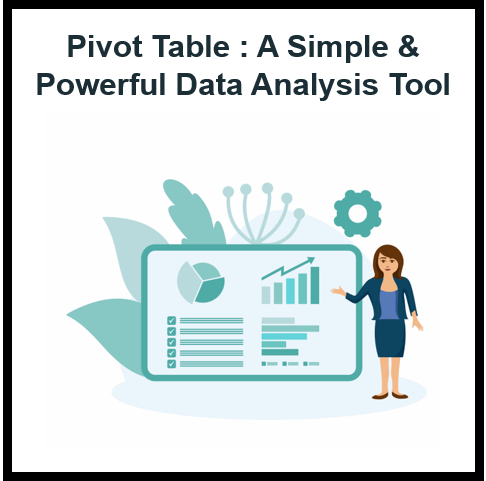
Pivot Table Analysis: A Simple and Powerful Tool for Data Analysis
Pivot tables are a basic tool that you should know. They provide an easy, effective way to organize data and make it easier to spot patterns, trends, and anomalies in

Excel Tips: How to Get the Most Out of Excel
If you are a business analyst, some Excel skills will come in handy when you need to quickly summarize data. Some skills are necessity for salespeople. It can help them

Excel Skills for Business: 18 Essential Skills You Need to Know
Excel is a powerful tool for business. It’s important to know your way around the program so you can create and analyze complex data sets. The more you understand Excel,
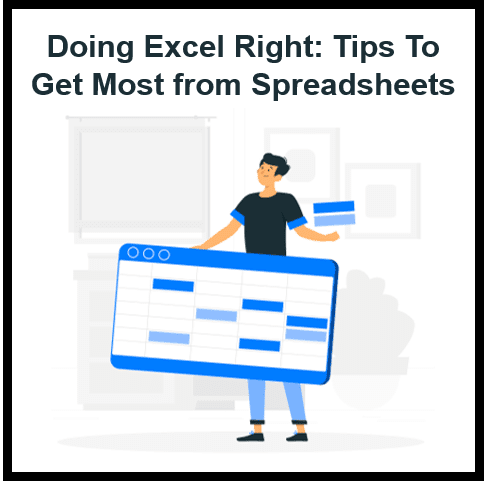
Excel Tips: Doing Excel Right and Getting the Most Out of Your Spreadsheets
There are a few ways that you can master Excel. First, you can use the software to its full potential by using it for what it was made for –

Excel in Finance: How to Master the Software
Excel is one of the most popular software programs around. It’s used by both beginners, market research analyst and experts to track and organize a variety of tasks. However, not
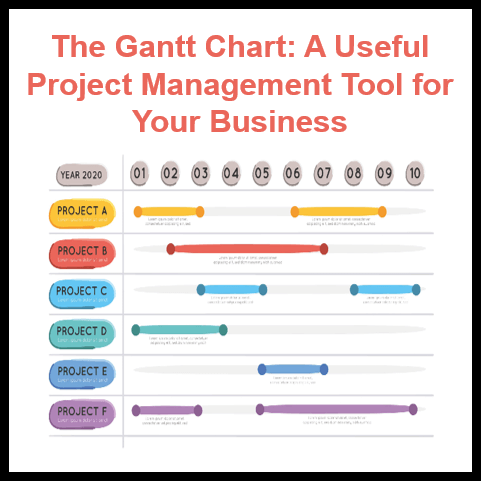
The Gantt Chart: A Powerful Project Management Tool for Your Business
A Gantt chart’s primary function is to help teams break down the different tasks of a project into a cohesive plan. Each task can be assigned a different color, and
How to Use Microsoft Excel for Data Analysis and Design: Tips and Tricks
We have learned that Excel has a very flexible charting toolkit and that it is capable of performing some very interesting operations with data. In this blog we will explore
10 Excel Tips for Turning Business Intelligence into Real-World Outcomes with Skillfin Learning
Excel is one of the best and most versatile spreadsheets you can create. It is the most commonly used for spreadsheet data analysis and data entry. But it’s also a