The SORT Function for Data Analytics in Excel
In our last blog, we discussed the new Unique function in Excel. In this blog, we will discuss
PowerPoint Presentation Tips: How to Create Engaging and Effective Slides
I have a presentation tomorrow! I need to pitch my ideas to investors! Need to
Excel Hack: Understanding the Unique Function to Simplify Your Data Analysis
Microsoft Excel 365 has come with a series of new array functions. These functions are
Nanodegree Programs and Online Learning: What You Need to Know
NANODEGREE – A BREAKTHROUGH IN PROFESSIONAL EDUCATION A breakthrough in the sector of education that
Online Learning and Soft Skills Development: The Benefits and Challenges
ONLINE EDUCATION HELPS TO DEVELOP FEW LIFELONG SOFT SKILLS Why do you choose an online
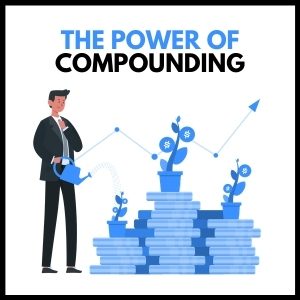
The Power of Compounding: How It Can Help You Build Wealth
What are the most powerful forces of the world? When someone asks us this question,
Hierarchy Charts in Excel: Tree Map and Sunburst
What is a Hierarchy? Hierarchy charts refers to different levels within a system. In an
Game Stopped: The Gamestop Traders Case Study
Over the last one month we have heard this name quite frequently – GameStop. What
Do Online Learning Courses Benefit Your Career
Every person’s professional journey tale currently has changed. Earlier people would complete their studies or
Understanding the Pareto Principle: A Complete Guide
The Pareto Principle is named after a famous Italian economist Vilfredo Pareto. The first time
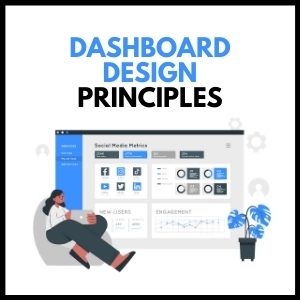
Dashboard Design Principles: Best Practices and Tips
A dashboard is a visual representation of data. Dashboards are prepared to communicate the insights
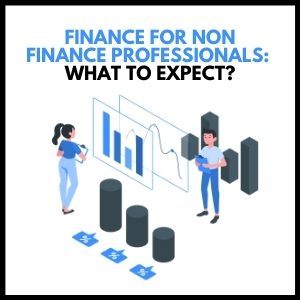
Finance for Non-Finance Professionals: What You Should Know
Why Non-Finance Professionals Should Know Finance? Let’s say you’re an IT professional or a mechanical
Financial Analyst Career Prospects: What to Expect
Noticed those smartly dressed men and women on CNBC, Bloomberg and Fox Business? They are
Continuous Learning: Why It’s Important for Millennials and Beyond
Why Millennials Require Continuous Learning? Millennials are the best educated generation ever. Most young people
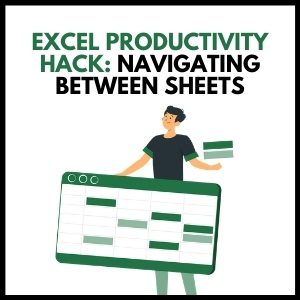
Excel Hack: Navigating Between Sheets to Boost Your Productivity
In one our earlier blogs, we discussed how to create an Index/TOC sheet in an
The Basics of Financial Statements: Understanding the Key Components
Have you ever seen a Financial Statement of a company and left wondering what is
Why Entrepreneurs Should Learn Business Finance
Financial literacy is absolutely essential for entrepreneurs and business founders. Most entrepreneurs are aware of
Premoney vs Postmoney Valuation: Understanding the Differences
Pre-money vs post-money valuation As an Entrepreneur, you often have to negotiate on your company
Excel Hack: Using Visualization Charts to Improve Your Data Analysis
Visualization charts in Excel Microsoft Excel can be a great tool for visualization purposes. There
WACC – Weighted Average Cost of Capital Definition and Calculation
Weighted Average Cost of Capital of a company (WACC) When we want to do valuation


