
Introduction
Investors and analysts are interested in understanding the financial health and profitability of a company. They use a financial metric called Return On Equity (ROE) to measure how effectively a company utilizes its equity investment. In this article, we will explore what ROE is and what drives it. We will also examine some corporate examples to gain a better understanding of ROE and distinguish it from other metrics such as ROIC and ROA. Let’s dive in!
What is Return on Equity?
Return on Equity (ROE) is a percentage expression of what return a company is making on its net assets acquired through equity. Return on equity is computed by dividing net income by shareholders’ equity. In short, ROE is a measure used by investors to determine how effectively the management uses equity capital to generate profits.
| Return On Equity | = (Net Income/ Shareholders Equity) * 100 |
- Net income is the profit earned by a company during a period. Net income is calculated by subtracting costs, interest, and taxes from the revenue generated through sales.
- Shareholders’ equity is the shareholder’s claim on the company’s assets after the debt repayment. Shareholders’ equity, also known as Share Capital, has two components. The first is the amount raised through equity or preference shares, and the second is retained earnings. When calculating return on equity, the average shareholders’ equity is determined by dividing the sum of opening and closing values of shareholders’ equity by 2.
| Shareholders’ Equity | = Total Assets – Total Liabilities |
| Average Shareholders’ Equity | = (Opening Shareholders’ Equity + Closing Shareholders’ Equity)/ 2 |
Why Average Shareholders’ Equity?
The difference between a Balance Sheet and an Income Statement is that a balance sheet is prepared for a point in time. An income statement records transactions for a period, generally for a year.
For the calculation of ROE, shareholder’s equity is the value at a point in time, and net income represents the revenue earned in a period.
Hence, to bridge the mismatch between these two values, we convert the amount of shareholders’ equity to average shareholders’ equity.
Real Life Example for Return on Equity Calculation
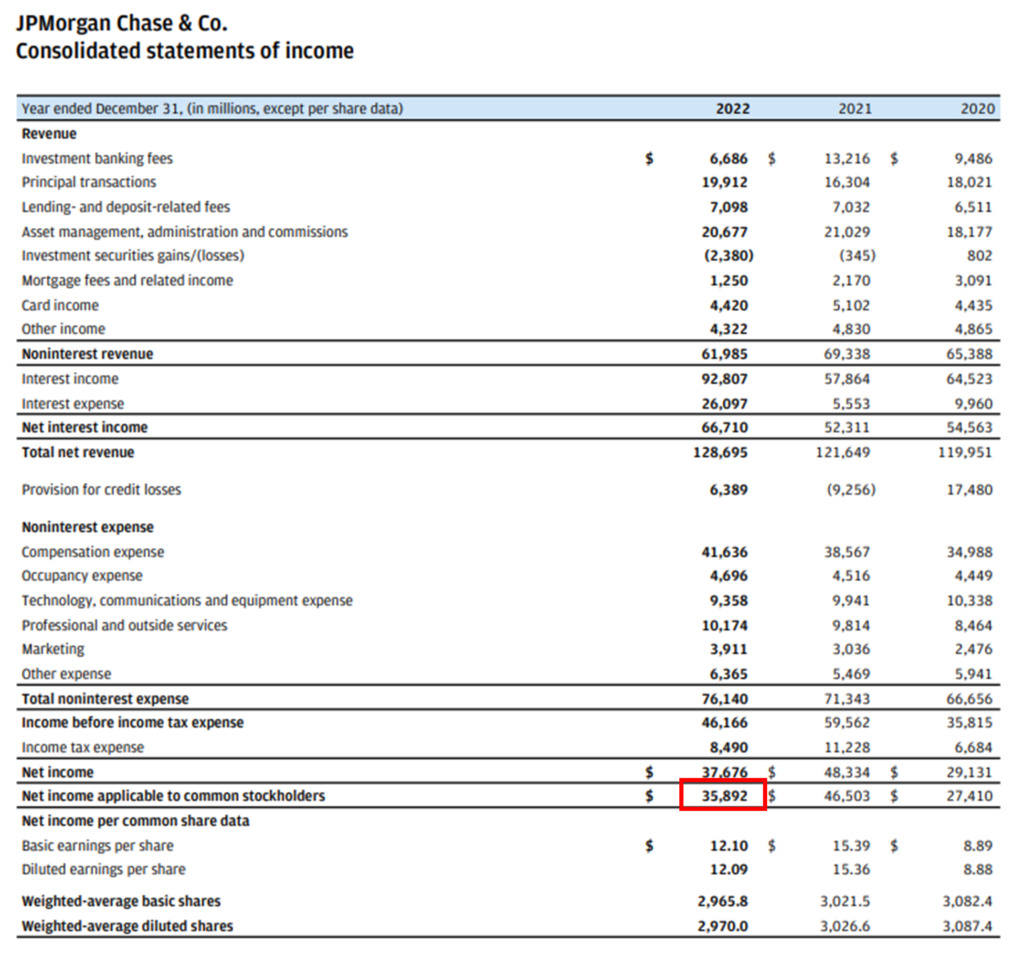
Let’s calculate the Return on Equity for JP Morgan for the year ending 2022:
JP Morgan is an American multinational institution engaged in providing financial services. It works in four lines of business: investment banking, commercial banking, financial transaction processing and asset management.
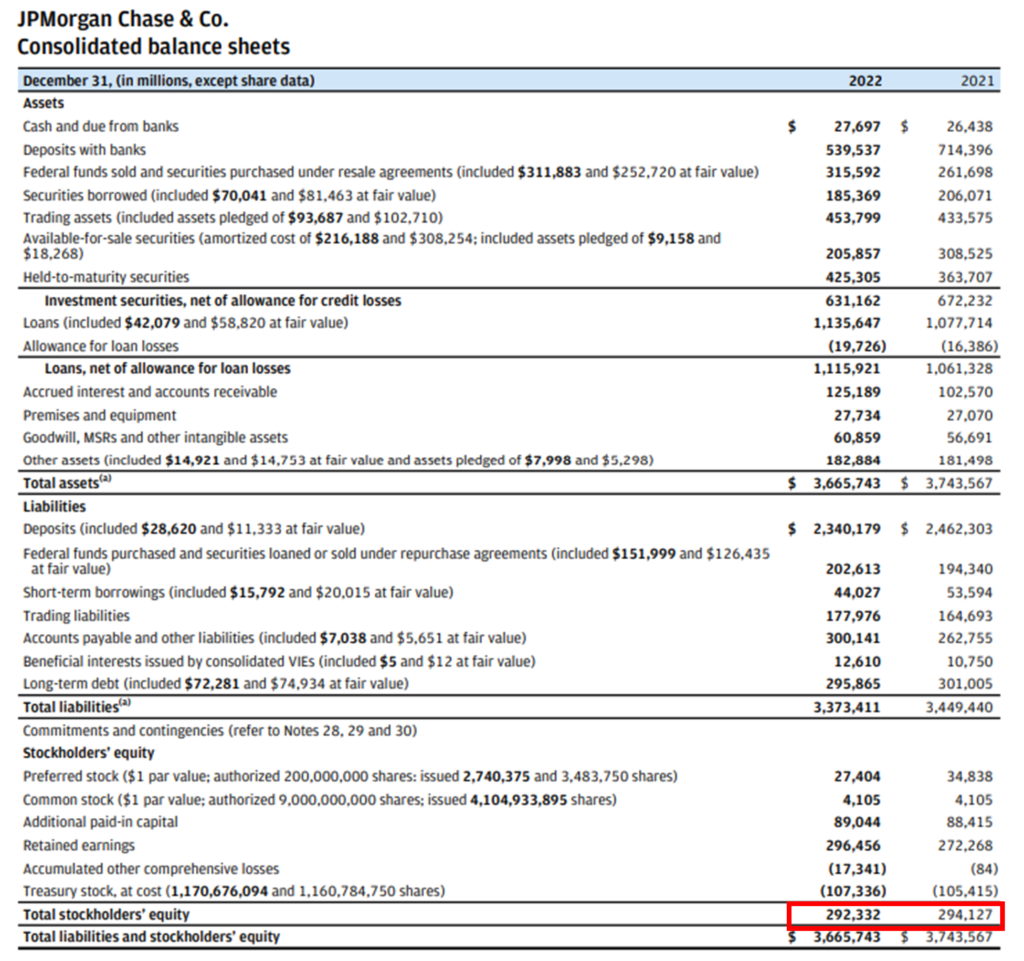
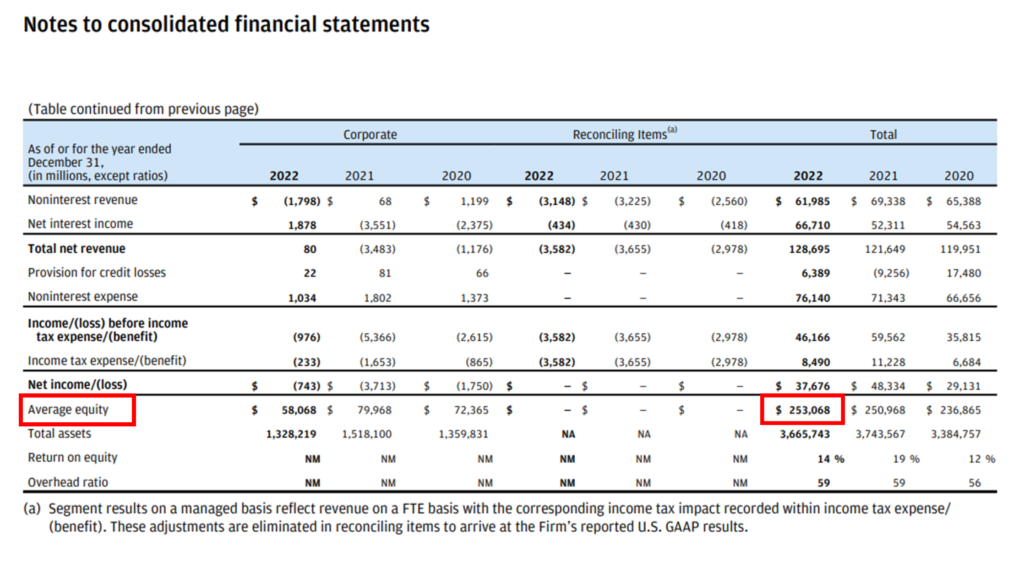
Note: For Average Shareholders’ Equity, we refer to notes to the consolidated financial statements of JP Morgan on page 290.
| Net Income | = 35,892 |
Note: For the calculation of ROE Net Income applicable to common stockholders is considered. Net income is arrived at taking the net interest margin income and subtracting all the operational expenses in running the bank including tax to be paid to the government.
| Average Shareholders’ Equity | = 253,068 |
| Return On Equity | = (Net Income/ Shareholders’ Equity) * 100 |
| = (35,892/ 253,068) * 100 | |
| Return On Equity | = 14.1% |
The Return on Equity of JP Morgan for 2022 is 14.1%.
Calculation of Return on Equity for Wells Fargo & Co. for the year ending 2022:
Wells Fargo is also an American multinational financial service global giant. Wells Fargo performs in four business segments: commercial banking, Wealth & Investment Management, Consumer Banking & Lending, and Corporate & Investment Banking.
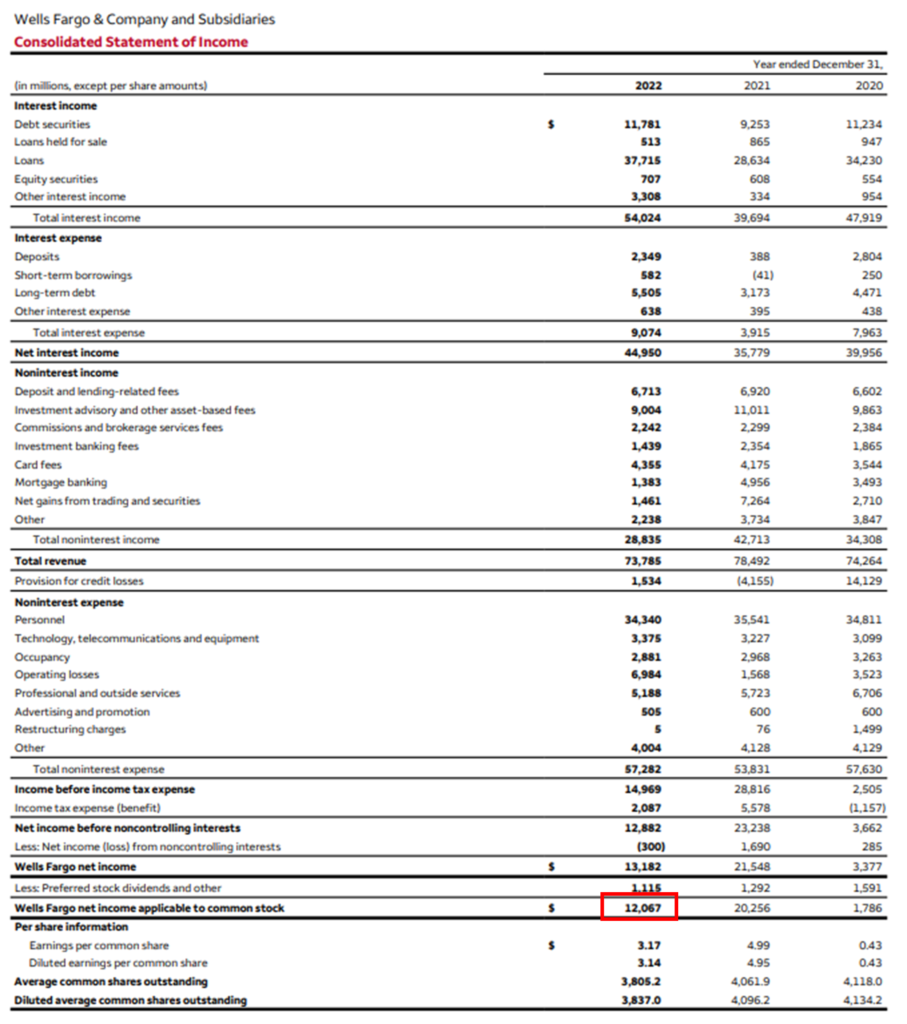
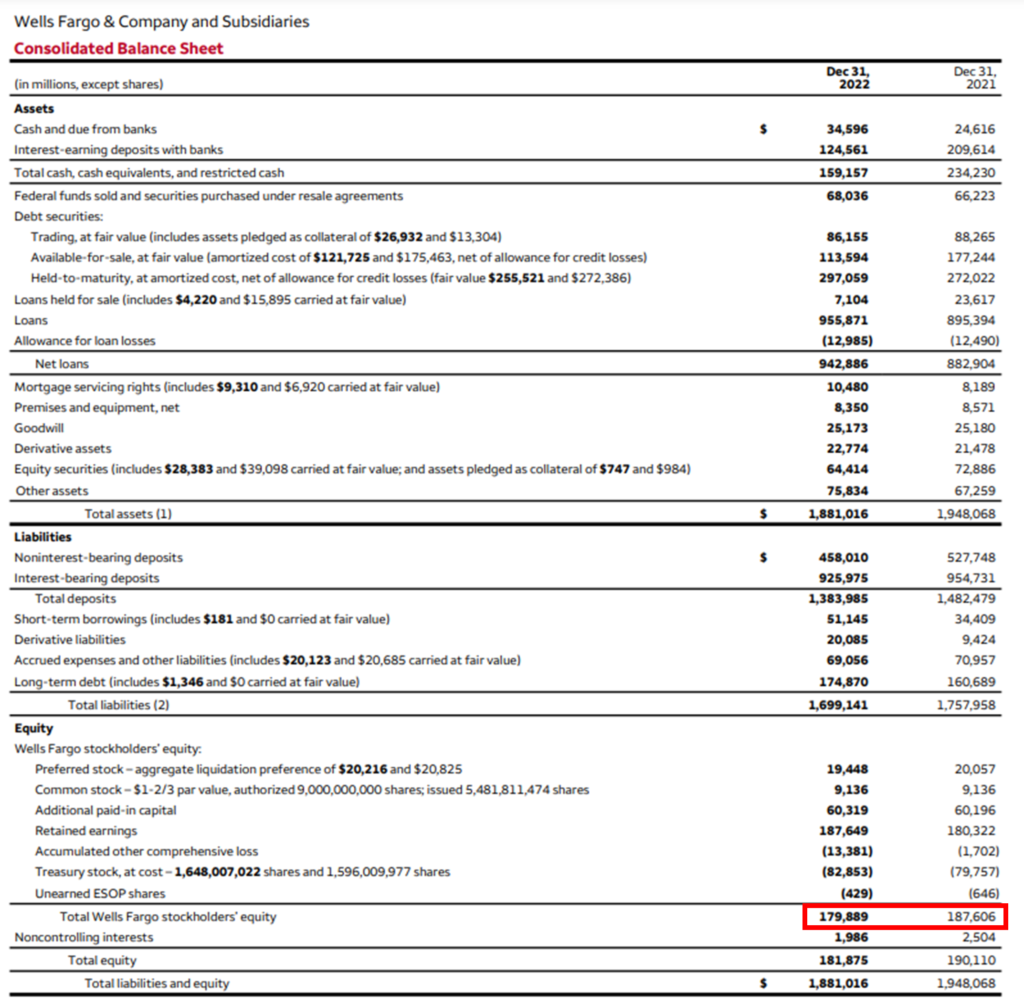
| Net Income | = 12,067 |
Note: For the calculation of ROE Net Income applicable to common stockholders is considered.
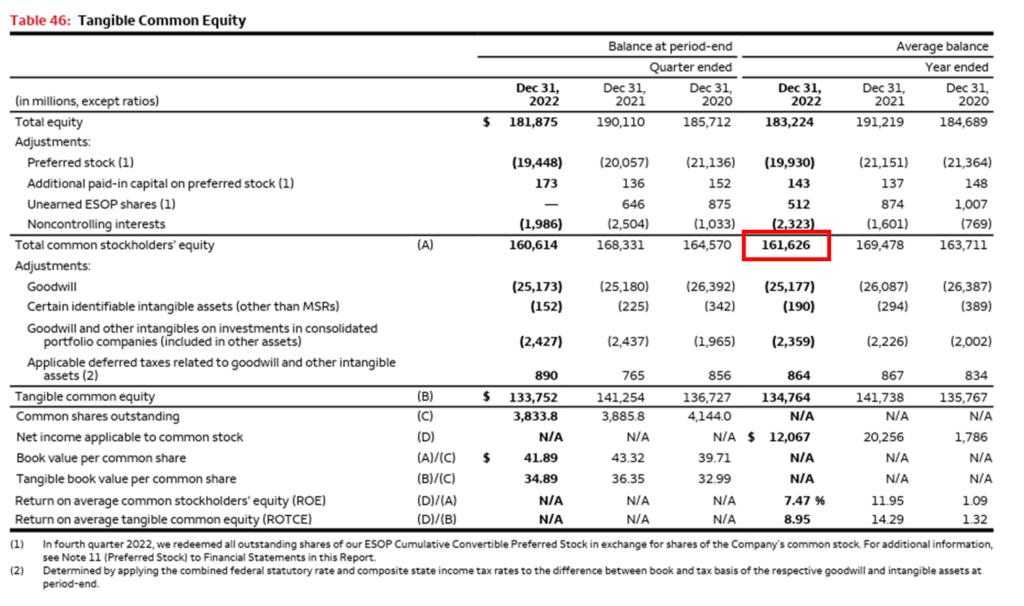
| Average Shareholders’ Equity | = 161,626 |
| Return On Equity | = (Net Income/ Shareholders’ Equity) * 100 |
| = (12,067/ 161,626) * 100 | |
| Return On Equity | = 7.47% |
The Return on Equity of Wells Fargo & Company for 2022 is 7.47%.
By just looking at the figures of Return on Equity, we can say that JP Morgan has a higher ROE of 14.1% compared to Wells Fargo’s 7.47%. By reading the Income Statement of JP Morgan it is clear that JP Morgan is generating more profits than Wells Fargo.
What are the drivers of Return On Equity?
Return on equity fluctuates from industry to industry and from company to company. These fluctuations are the result of some underlying factors. Among different factors, there are three financial metrics which drive the value of ROE. These three elements are:
- Return on Sales also known as profit margins signifies what percentage of sales is earned as profit by the company.
- The second driver is Asset Turnover which measures how effectively the company’s assets generate revenue.
- And the third driver is Financial Leverage. It records how debt financing amplifies the company’s returns. These three elements form the famous DuPont Analysis.
DuPont Analysis on Return on Equity
DuPont Corporation created the DuPont Analysis in the 1920s. It is a framework which breaks ROE into different components. There are two interpretations of DuPont’s analysis. One is a 3-step analysis, and the other is a 5-step analysis.
The 3-step DuPont analysis highlights three distinct elements of Return on Equity.
| Return On Equity | = Return On Sales * Asset Turnover * Equity Multiplier |
- The first element of the 3-step Dupont formula is Return on Sales (ROS) also known as profit margin. It is a ratio calculated by dividing net income by sales. It indicates the relative profitability and operational efficiency of a business. The ratio underlines how much profit is generated for a dollar of sales.
- The second element of DuPont analysis is the Asset Turnover Ratio. Sales divided by assets gives us the asset turnover ratio. It measures the efficiency of the assets of a company. It helps the managers to answer one question, How we can maximise sales with the assets the business holds?
- The final element of DuPont’s 3-step analysis is the leverage or equity multiplier. Assets divided by equity give us the equity multiplier. It shows the degree of financial leverage of a company.
The 5-step version of the Dupont analysis is an extended version of the 3-step analysis.
It breaks ROE into five distinct elements. Return on Sales breaks into three parts tax burden, interest burden, and EBIT%.
| Return On Equity | = Tax Burden * Interest Burden * EBIT% * Asset Turnover * Equity Multiplier |
- The amount of tax burden, which we get when Net Income is divided by Earnings Before Tax (EBT).
- The second part is called the Interest Burden. We get the interest burden when Earnings Before Tax is divided by Earnings Before Interest & Tax.
- The third element of the 5-step DuPont analysis is EBIT%, which we get when Earnings Before Interest & Tax are divided by Sales.
- Asset Turnover Ratio is the fourth element of the 5-step DuPont analysis.
- The fifth aspect of the 5-step variation is the Equity Multiplier or Financial Leverage.
Difference between ROE and ROIC
Return on Equity calculates how much equity is required to generate a certain level of Net Income for a company. Return on Invested Capital measures how much profit the company is making with every dollar of capital invested. This invested capital includes equity as well as debt capital. Hence, the fundamental difference between ROE and ROIC is that ROE looks at the profit earned using only equity capital. While ROIC talks about the whole capital invested in the company, i.e. equity along with debt.
Difference between ROE and ROA
Return On Equity (ROE) is the ratio that analyses the profitability of a business. Return On Asset (ROA) measures how efficiently a company uses its assets. The prime difference between ROE and ROA is the financial leverage or debt.
| Return On Assets | = (Net Income/ Total Assets) * 100 |
Return on Equity has no involvement of debt. Whereas, assets can be financed through both debt and equity. When assets are leveraged, we then see the role of debt in the calculation of ROA. ROA without debt is equal to ROE. Hence, ROA involves financial leverage while ROE calculation does not include debt.
Is a higher ROE good for the company?
A high return on equity (ROE) can be a cause of concern for a company with limited equity capital. Such companies may generate huge net profits, but this mismatch between net profits and shareholders’ equity indicates a certain level of risk.
Companies with high leverage can generate high net profits with a small equity base. These companies opt an aggressive borrowing strategies, which can inflate their net income. However, such strategies do not necessarily impact the actual growth rate of the company.
Another problem with high ROE is fluctuating profits. These inconsistencies in profit generation can lead to deceitful results.
Negative Net Income or negative shareholders’ equity can also produce misleading and inflated ROE. Therefore, in case of negative net income or shareholders’ equity analysts and investors should not rely on ROE to take business or investment decisions.
Conclusion
Return on Equity (ROE) serves as a vital metric for investors and analysts, offering valuable insights into a company’s profitability and management efficiency. By assessing how effectively a company utilises shareholders’ equity to generate profits, ROE helps investors gauge the financial health and growth potential of a business.
The DuPont Analysis further enhances our understanding of ROE by breaking it down into key components such as Return on Sales, Asset Turnover, and Financial Leverage. While a higher ROE generally signifies better performance, it’s essential to consider industry norms and potential limitations when interpreting this metric. Despite its significance, ROE should be used in conjunction with other financial indicators for a comprehensive assessment of a company’s performance and investment potential.
Overall, ROE remains a crucial tool in the investor’s toolkit, providing valuable insights for informed decision-making in today’s dynamic financial landscape.

