
What is the Net Interest Margin?
In the banking and financial services industry, investors use different financial ratios to assess the profitability and growth of the companies. One of these ratios, which measures profitability, is Net Interest Margin (NIM).
Net Interest Margin is the ratio between the net interest income and the average earning assets. NIM measures the success of the firm’s investments in comparison to the expenses borne on the same investments. Net Interest Margin measures the difference between Interest Income and Interest Expense divided by the Average Earnings Assets.
Formula for Net Interest Margin (NIM):
| Net Interest Margin | = (Net Interest / Average Earning Assets) * 100 |
Understanding the term Net Interest Margin:
The term net interest margin holds two aspects. First is the concept of net interest, and the second is the relation between net interest and earning assets.
Net Interest:
It is understood in finance and accounting that to calculate a net value, we subtract something from the actual amount. In this case, we are subtracting Interest Expense from Interest Income.
Formula:
| Net interest | = Interest Income – Interest Expense |
Interest Income of a bank refers to the interest amount the bank earned for lending money to the public and institutions. It constitutes the credit lines and loans extended by banks. It is necessary to highlight that these loans are investments made by the banks.
Interest Expense: For banks, the savings account deposits made by the customers are loans payable on demand. Banks use a considerable portion of these funds to further grant loans to the public or institutions.
So, the value of interest payable to the customers for depositing their funds in the savings account and certificate of deposit is the interest expense. Therefore, interest expense refers to the cost the banks bear for borrowing money.
Relation between Net Interest and Earning Assets
Net interest is the amount the bank earns on the investments after paying the interest expense.
Earning Assets are the investments made by banks, businesses and individuals that generate income. Hence, it is called the assets that earn. Earning assets include stocks, bonds, certificates of deposits, etc.
For the Net Interest Margin ratio, we take the value of average earning assets instead of earning assets. We get Average Earning Assets by adding the beginning and ending asset balance and dividing it by two.
Therefore, the ratio between Net Interest and Average Earning Assets shows whether the business has made profitable investments.
What does positive and negative Net Interest Margins mean?
The results of Net Interest Margin vary from one business to another. Some banks & financial institutions show a positive NIM, while some have a negative or low NIM.
Positive net interest margins indicate that the bank’s interest income from investments is more than paying interest on deposits. Therefore, the higher the ratio, the sounder the investments and steadier growth.
A low or negative net interest margin shows that the business is losing more money by paying for the deposits than from the investments. A bank with a negative net interest margin ratio shows the management’s investment inefficiency.
Real Life Example of Net Interest Margin:
We have learned that the Net Interest Margin is the bank’s profitability ratio. So, for better understanding, we will calculate the NIM of Wells Fargo and Bank of America for 2023:
Calculation of Net Interest Margin of Wells Fargo for 2023:
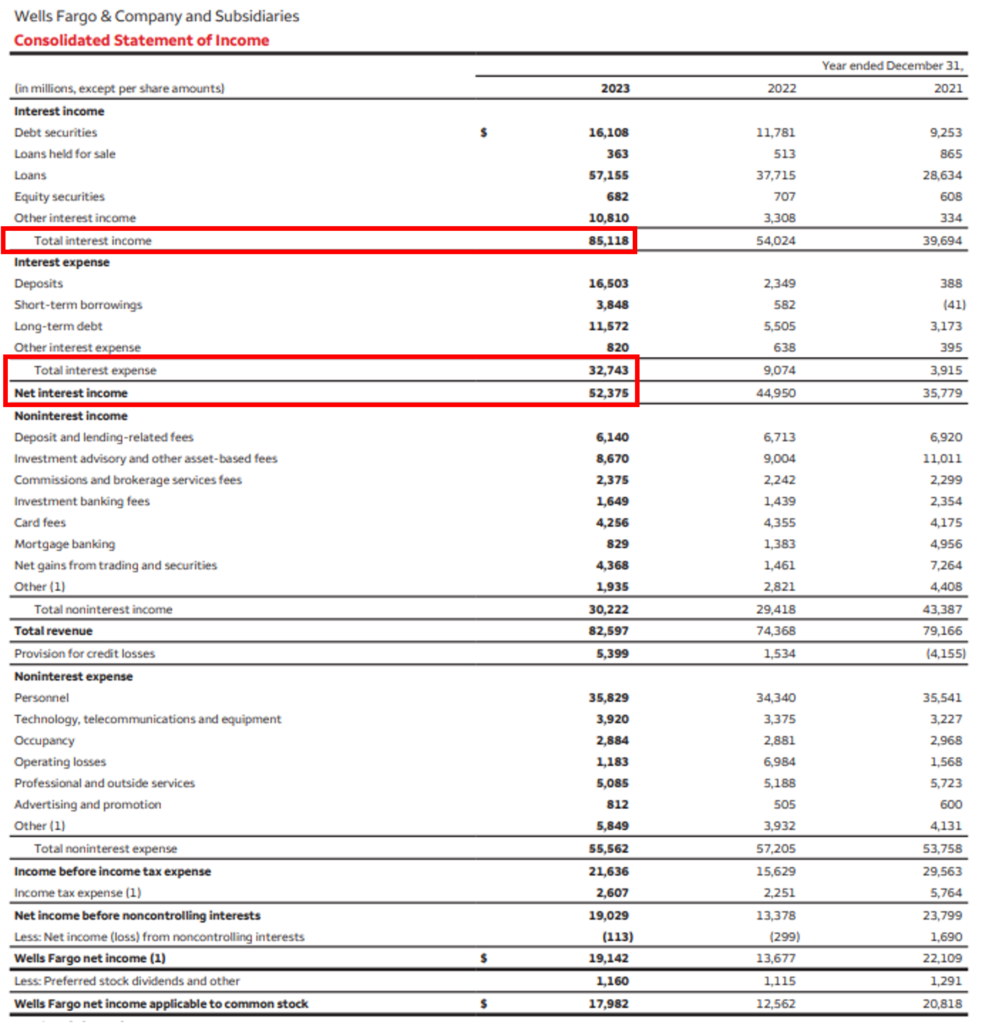
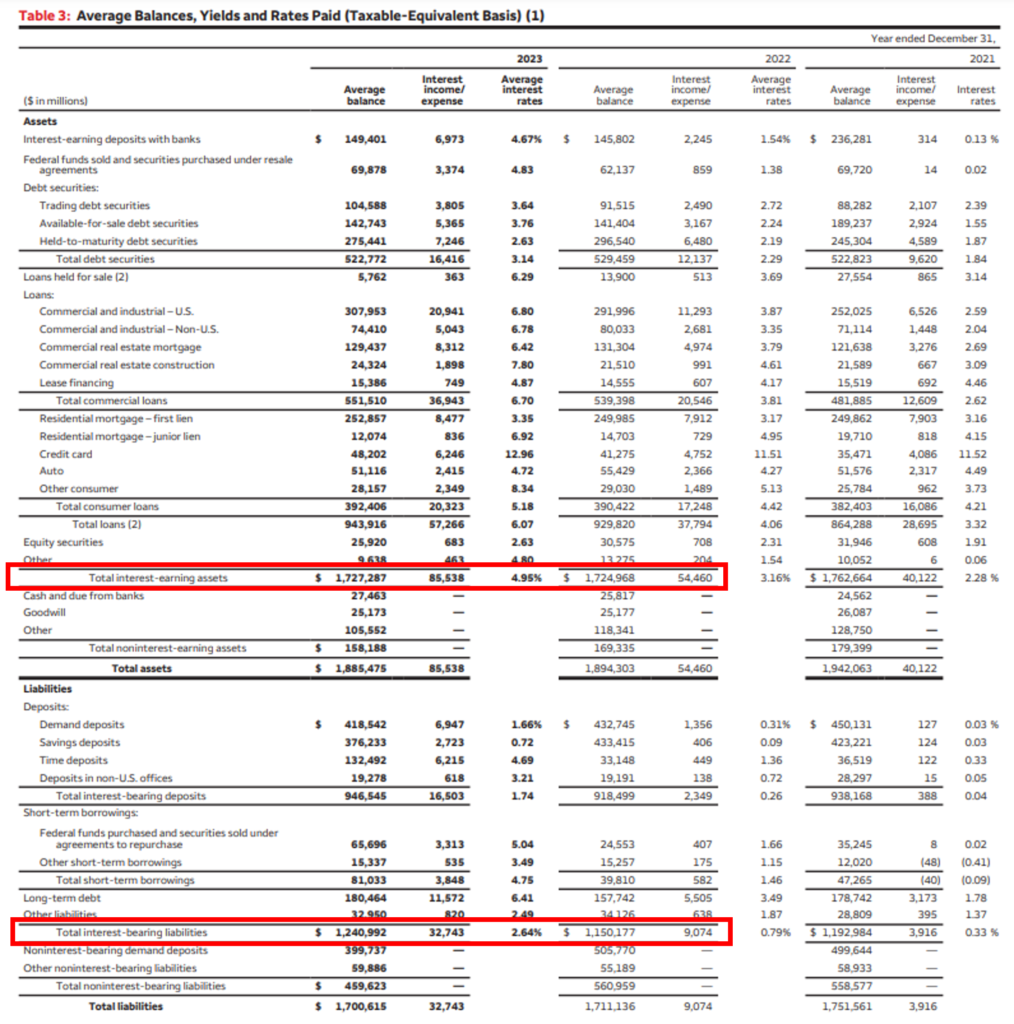
Note: For the calculation of the Net Interest Margin, the values are taken from the table showing the average balances and yields on page 8 of the annual report.
We have taken the values of total interest-earning assets and total interest-bearing liabilities of interest income/expense column for Net Interest calculation. And total interest-earning assets average balance for the average earning assets.
| Interest Income | = 85,538 |
| Interest Expense | = 32,743 |
| Net interest | = Interest Income – Interest Expense |
| = 85,538 – 32,743 | |
| Net interest | = 52,795 |
| Average Earning Assets | = 1,727,287 |
| Net Interest Margin | = (Net Interest / Average Earning Assets) * 100 |
| = (52,795/ 1,727,287) * 100 | |
| Net Interest Margin | = 3.06% |
The Net Interest Margin of Wells Fargo for 2023 was 3.06%.
Calculation of Net Interest Margin of Bank of America for 2023
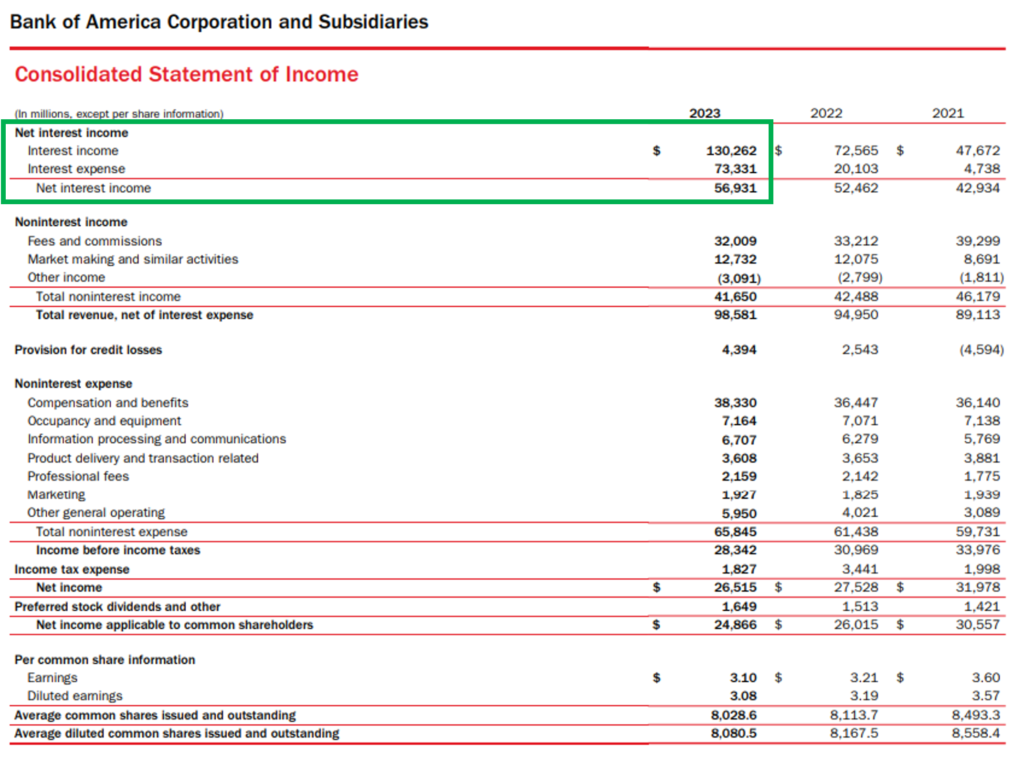
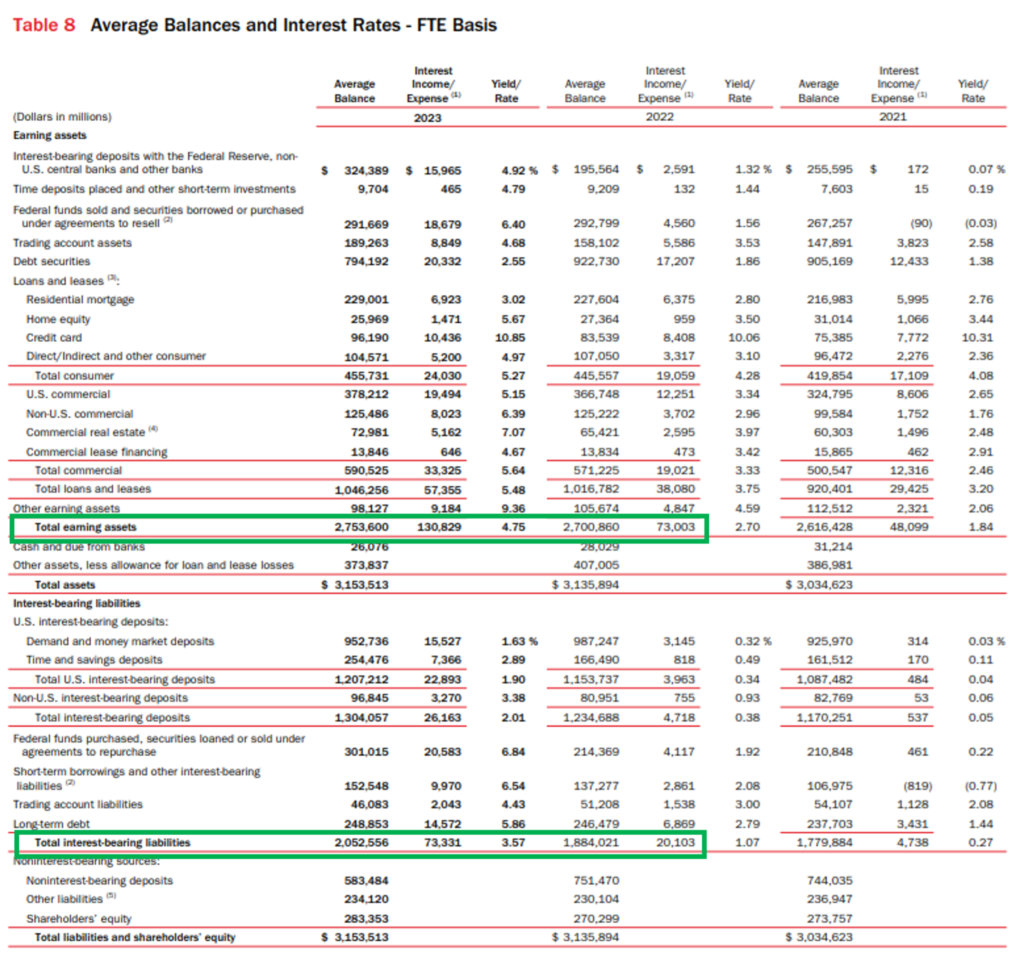
Note: The table showing the average balances & interest rates on page 86 of the 10K report contains the value inputs for the calculation of NIM.
From the Interest Income/Expense column, we have taken the values of Total earning assets and Total interest-bearing liabilities. For Average Earning Assets, we have taken the value of total earning assets under the average balance column.
| Interest Income | = 130,829 |
| Interest Expense | = 73,331 |
| Net interest | = Interest Income – Interest Expense |
| = 130,829 – 73,331 | |
| Net interest | = 57,498 |
| Average Earning Assets | = 2,753,600 |
| Net Interest Margin | = (Net Interest / Average Earning Assets) * 100 |
| = (57,498/ 2,753,600) * 100 | |
| Net Interest Margin | = 2.08% |
The Net Interest Margin of Bank of America for 2023 is 2.08%.
By comparing the Net Interest Margins of Wells Fargo and Bank of America, we can conclude that Wells Fargo has a higher and better NIM.
Year-on-Year Analysis of Net Interest Margin
We have understood the calculation of the NIM of Wells Fargo and Bank of America. Now, let’s perform a year-on-year analysis of net interest margin for both banks:
Calculation of Net Interest Margin of Wells Fargo for 2022:
| Interest Income | = 54,460 |
| Interest Expense | = 9,074 |
| Net interest | = Interest Income – Interest Expense |
| = 54,460 – 9,074 | |
| Net interest | = 45,386 |
| Average Earning Assets | = 1,724,968 |
| Net Interest Margin | = (Net Interest / Average Earning Assets) * 100 |
| = (45,386/ 1,724,968) * 100 | |
| Net Interest Margin | = 2.63% |
The NIM of 2023 and 2022 was calculated as 3.06% and 2.63% respectively. Thus, we see a hike of 0.43% in the net interest margin. We can also note that the interest income and expenses have increased by $31,078 million and $23,669 million respectively. The average earning assets have also grown from $1,724,968 million to $1,727,287 million in 2023.
Calculation of Net Interest Margin of Bank of America for 2022:
| Interest Income | = 73,003 |
| Interest Expense | = 20,103 |
| Net interest | = Interest Income – Interest Expense |
| = 73,003– 20,103 | |
| Net interest | = 52,900 |
| Average Earning Assets | = 2,700,860 |
| Net Interest Margin | = (Net Interest / Average Earning Assets) * 100 |
| = (52,900/ 2,700,860) * 100 | |
| Net Interest Margin | = 1.96% |
The Net Income Margin of Bank of America has gone up by 0.12% in 2023. The interest income and expenses have expanded by $57,826 million and $53,228 million respectively. The company’s Average Earning Assets went from $2,700,860 million in 2022 to $2,753,600 million in 2023.
By performing a year-on-year analysis we conclude that both companies have expanded their work in the credit as well as in the depositing domains.
Factors Affecting Net Interest Margin
The net interest margin is a financial ratio influenced by internal and external factors.
To maintain a healthy net interest margin ratio, banks and financial institutions work constantly to improve their investment efficiency. Internal factors, such as investment decisions, operational and cost efficiency, capital structure, etc, are manageable and controllable by the banks. But external factors like market forces, monetary policy, interest rates of Treasury Bills, etc, are outside the purview of the management control.
Demand and supply among customers between loans and savings accounts extensively impact the net interest margin ratio. If the demand for loans increases rapidly compared to that of savings accounts. The net interest ratio will shoot up. It happens because lending will increase, swelling the interest income compared to interest expenses as it remains stagnant.
Conversely, if the demand for savings accounts i.e. deposits boosts, the net interest margin will shrink. As a result, the banks will pay more interest to their customers. And interest income remains constant. If the interest income remains constant and the interest expense constantly increases, the numerator of net interest will decrease as the company is paying more than it is earning. This phenomenon leads to a fall in the net interest margin. In other words, the loan to deposit ratio is something that will have a bearing on the net interest margin of a bank.
The second external factor that causes fluctuations in the net interest margin of banks & financial institutions is the monetary policy. The government of a country use monetary policy to manipulate the credit interest rates for the optimal functioning of public finances and proper money circulation. However, these changes in interest rates play a vital role in the demand for loans and deposits and can positively or negatively impact the NIM of banks. If the interest rates decrease, the demand for credit increases and customers are less likely to save, which increases the net interest margin. Conversely, when interest rates are set higher, the borrowings of the customer shrink and saving becomes a better alternative. Thus, this lowers the net interest margins because the banks and financial institutions have to pay more interest.
Summing Up
Net Interest Margin (NIM) is a crucial metric for evaluating the profitability and efficiency of banks and financial institutions. It reflects the ratio between the net interest income generated from investments and interest expenses paid on deposits to the average earning assets. A positive NIM indicates sound profitability and growth, while a negative or low NIM suggests investment inefficiency and losses. External factors such as market dynamics and monetary policy also influence NIM fluctuations. Therefore, maintaining a healthy NIM requires proactive management of internal factors and adaptation to external changes in the financial landscape.

