
What is DuPont Analysis?
F. Donaldson Brown developed the DuPont Analysis framework in 1914, later popularised by DuPont Corporation in the 1920s. The DuPont analysis evaluates a company’s Return on Equity (ROE) by breaking it into numerous components. It aids in understanding the quality of earnings, asset efficiency and leverage of a company.
DuPont analysis uncovers the factors influencing a company’s profitability and facilitates comparisons of the firm’s performance. DuPont Analysis, also known as the DuPont Model or DuPont Equation, breaks down the Return on Equity into three principal components:
1. Profitability:
Profitability refers to the ability of a company to generate profits after cost consideration. It indicates a business’s financial health and viability. The DuPont Analysis measures profitability using Profit Margin.
| Profit Margin | = Net Income/ Total Revenue |
The profit margin percentage helps analysts assess the percentage contribution of revenue to the company’s bottom line.
| Profit Margin Percentage | = (Net Income/ Total Revenue) * 100 |
High-profit margins indicate the amount of profit a company makes for each dollar of revenue earned. It displays the operational efficiency of a business.
2. Asset Efficiency:
Efficiency corresponds to the ability of the business to utilise its resources for profit maximisation. Companies use the Total Asset Turnover Ratio to measure the efficiency of the assets to generate revenue.
| Total Asset Turnover Ratio | = Total Sales/ Average Assets |
The Total Asset Turnover Ratio helps assess how effectively a company uses its assets to generate sales. If asset efficiency is higher, that means a company will make more revenue with fewer asset allocations. Thus, boosting the company’s ROE.
3. Capital Structure:
Capital structure represents the financial composition of a company. It portrays the proportion of debt and equity involved in operations and asset allocation. Financial leverage helps managers unravel the composition of debt in the company’s capital structure. It helps decompose the capital structure using the average values of total assets and equity shareholders.
| Financial Leverage | = Average Assets/ Average Equity |
The financial leverage measure allows the company to map out its funding sources, manage the cost of debt and equity, and assess the risk profiles related to debt and equity. (A Decomposition of Hospital Profitability: An Application of DuPont Analysis to the US Market, 2015)
Interpretations of DuPont Analysis:
DuPont Analysis has two interpretations: the 3-step DuPont Analysis and the 5-step DuPont Analysis.
3-Step DuPont Analysis:
The 3-step Dupont Analysis breaks the return on equity into three parts:
- Net Profit Margin = Net Income/ Total Revenue
- Asset Turnover = Total Revenue/ Average Total Assets
- Financial Leverage = Average Total Asset/ Average Shareholders Equity
The 3-step Dupont Analysis formulates an equation that multiplies net profit margin, asset turnover ratio and financial leverage to calculate a company’s return on equity.
| 3-Step Dupont Analysis | = Net Income Margin * Asset Turnover * Financial Leverage |
5-Step DuPont Analysis:
As we have learnt, the 3-step DuPont Analysis breaks ROE into three components, and the 5-step DuPont Analysis decomposes ROE into 5 components:
- Tax Burden = Net Income/ Pre-Tax Income
- Interest Burden = Pre-Tax Income/ Operating Income
- Operating Margin = Operating Income/ Total Revenue
- Asset Turnover = Total Revenue/ Average Total Assets
- Financial Leverage = Average Total Asset/ Average Shareholders Equity
| 5-Step Dupont Analysis | = Tax Burden * Interest Burden * Operating Margin * Asset Turnover * Financial Leverage |
When compared with the 3-step DuPont Analysis, the 5-step DuPont Analysis further breaks Net Income Margin into three components that is:
- Operating Margin (EBIT Margin)
- Tax Burden
- Interest Burden
Real-Life Examples of DuPont Analysis
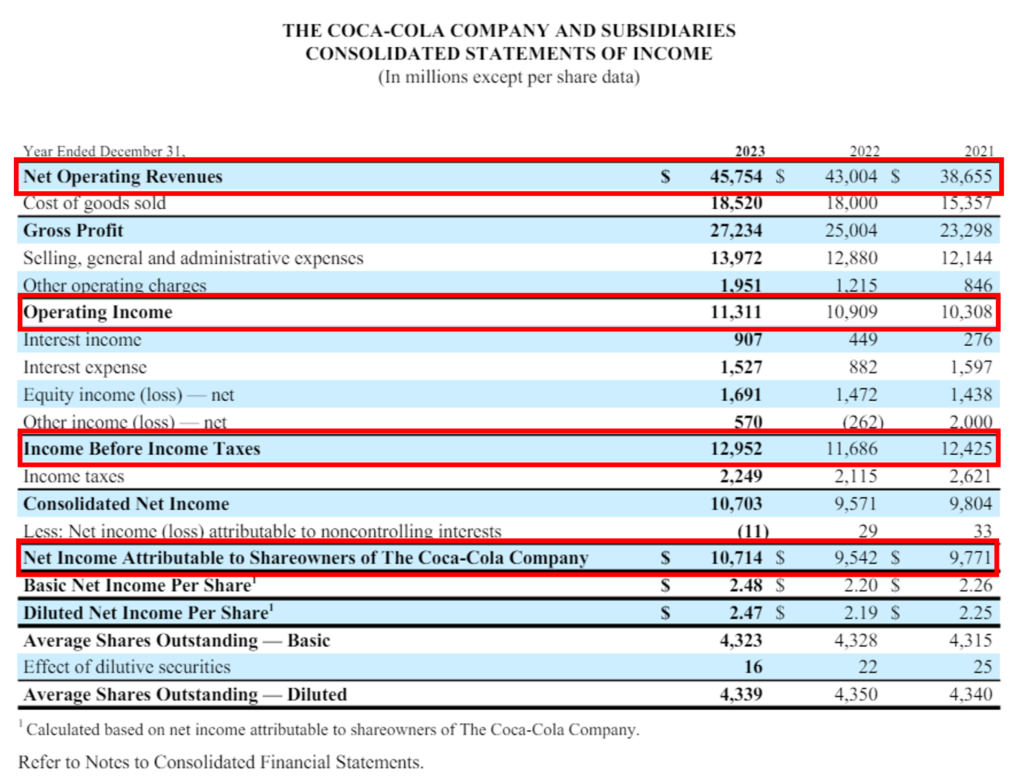
Let’s understand the calculation of DuPont’s Analysis of Coca-Cola for 2023:
3-Step & 5-Step DuPont Analysis Calculation: Coca Cola
- Working Notes:
| Net Income | = 10,714 |
| Total Revenue | = 45,754 |
| Pre-Tax Income | = 12,952 |
| Operating Income | = 11,311 |
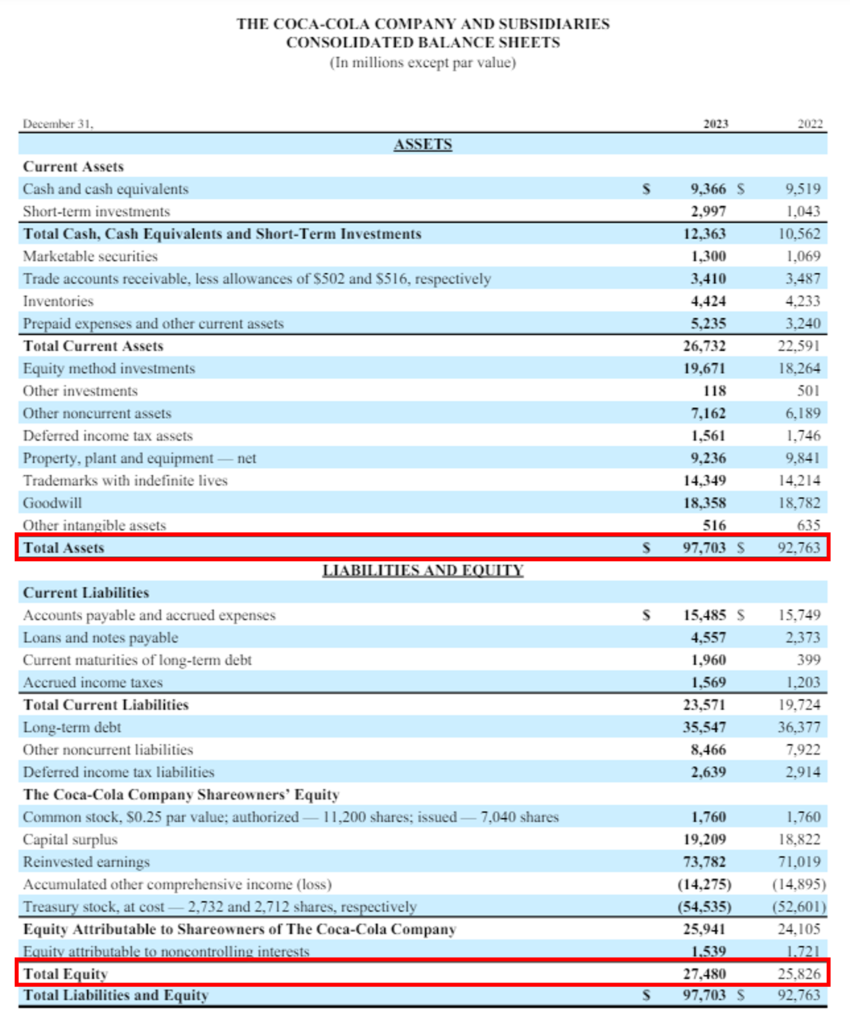
| Average Total Assets | = (Opening Value of Assets + Closing Value of Assets) / 2 |
| = (92,763 + 97,703) / 2 | |
| = 190,466/ 2 | |
| Average Total Assets | = 95,233 |
| Average Shareholders Equity | = (Opening Value of Shareholders Equity + Closing Value of Shareholders Equity) / 2 |
| = (25,826 + 27,480) / 2 | |
| = 53,306/ 2 | |
| Average Shareholders Equity | = 26,653 |
- Calculation of 3-Step DuPont Analysis:
| Net Income Margin (%) | = (Net Income / Total Revenue) * 100 |
| = (10,714/ 45,754) * 100 | |
| Net Income Margin (%) | = 23.4% |
| Asset Turnover Ratio | = Total Revenue/ Average Total Assets |
| = 45,754/ 95,233 | |
| Asset Turnover Ratio | = 0.48 |
| Financial Leverage | = Average Total Asset/ Average Shareholders Equity |
| = 95,233/ 26,653 | |
| Financial Leverage | = 3.57 |
| 3-Step Dupont Analysis | = Net Income Margin * Asset Turnover * Financial Leverage |
| = 23.4% * 0.48 * 3.57 | |
| 3-Step Dupont Analysis | = 40% |
From the above 3-Step DuPont Analysis we got the Return on Equity of Coca Cola for 2023 as 40%.
- Calculation of 5-Step DuPont Analysis:
| Tax Burden | = Net Income/ Pre-Tax Income |
| = 10,714/ 12,952 | |
| Tax Burden | = 0.82 |
| Interest Burden | = Pre-Tax Income/ Operating Income |
| = 12,952/ 11,311 | |
| Interest Burden | = 1.14 |
| Operating Margin (%) | = (Operating Income/ Total Revenue) * 100 |
| = (11,311/ 45,754) * 100 | |
| Operating Margin (%) | = 24.7% |
| Asset Turnover Ratio | = Total Revenue/ Average Total Assets |
| = 45,754/ 95,233 | |
| Asset Turnover Ratio | = 0.48 |
| Financial Leverage | = Average Total Asset/ Average Shareholders Equity |
| = 95,233/ 26,653 | |
| Financial Leverage | = 3.57 |
5-Step DuPont Analysis
| 5-Step Dupont Analysis | =Tax Burden * Interest Burden * Operating Margin * Asset Turnover * Financial Leverage |
| = 0.82 * 1.14 * 24.7 * 0.48 * 3.57 | |
| 5-Step Dupont Analysis | = 39.5 % |
The 5-Step DuPont Analysis shows the Return on Equity of Coca-Cola for 2023 as 39.5%.
Advantages of DuPont Analysis
- DuPont Analysis help investors compare companies based on their ROE composition. Investors and analysts can compare businesses based on profit margins, asset efficiency, and leverage ratio.
- DuPont Analysis dissects ROE that helps identify the strengths and weaknesses of a company. It also provides management guidance and a clear vision regarding areas that may require improvement.
- DuPont Analysis offers valuable insights for strategic decision-making. For instance, if asset turnover is low, the company may consider optimising inventory management or disposing of underperforming assets.
- DuPont Analysis is also valuable for tracking performance trends over time. By conducting periodic analyses, companies can monitor movement in profitability, asset efficiency, and leverage, enabling proactive adjustments.
- DuPont Analysis integrates various performance dimensions into a unified framework, providing a comprehensive view essential for stakeholders seeking a thorough understanding of financial performance drivers.
Summing Up
DuPont Analysis is an invaluable tool for investors and analysts, providing a detailed and insightful breakdown of a company’s financial performance. By dissecting Return on Equity (ROE) into profitability, asset efficiency, and financial leverage, DuPont Analysis reveals the underlying factors influencing a company’s profitability. This comprehensive approach enables more informed strategic decision-making, industry & corporate comparisons, and strengths & weakness identification. Furthermore, tracking these metrics over time offers valuable insights into performance trends, guiding proactive adjustments. DuPont Analysis equips stakeholders with a holistic understanding of financial health, facilitating better investment decisions and effective management strategies.
References:
Research Paper: A Decomposition of Hospital Profitability: An Application of DuPont Analysis to the US Market (2015)
Authors: Jason Turner, Kevin Broom, Michael Elliott and Jen-Fu Lee

