
The range of technologies that a good big data analyst must be familiar with is huge. It spans myriad tools, platforms, hardware and software.
There are both basic and advanced data analysis and visualization tools. See below for a list of such tools.
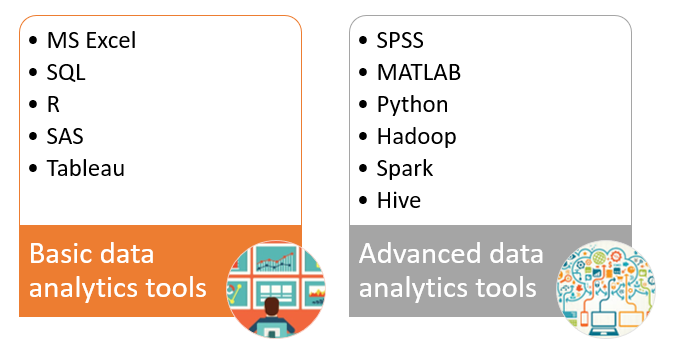
The basic tools included knowledge of Microsoft Excel, SQL, R and SAS. These are spreadsheet based tools that helps in analyzing and deciphering information from large data sets.
On a more advanced level, there are tools like SPSS, MATLAB, Python and Hadoop which uses advanced statistical knowledge as well as programming skills to predict future behavior from analyzing large data sets.
In this article, we are going to focus on Microsoft Excel as a tool for data analytics. It is the most frequently used spreadsheet in today’s world that can help analysts to ANALYZE, SYNTHESIZE AND VISUALIZE INFORMATION in a meaningful way.
MS Excel has been in use in the business world for data analysis since 1985. Over time, there are several upgrades that have happened to the tool which makes it the most frequently and widely used spreadsheet in modern day business. Irrespective of whatever role you may be in, it is difficult not to work in excel at some point of daily work life.
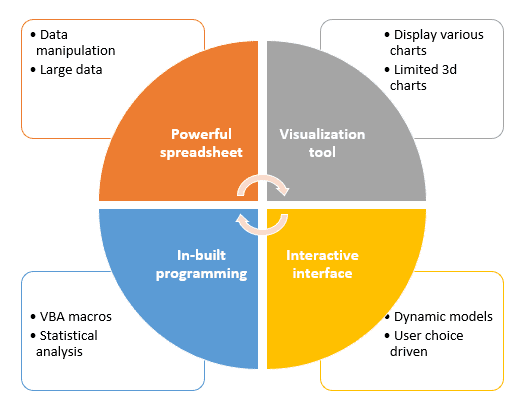
MS excel is a comprehensive tool that allows us to ANALYZE, SYNETHESIZE AND VISUALIZE information easily and in a meaningful way. There are 4 broad features in MS excel that makes it very useful for data analysis. See below:

First, MS Excel is a powerful spreadsheet that allows to do almost any level of data manipulation and analysis. As we will see further in the course, there are some basic and advanced excel functionalities like LOOKUP FUNCTIONS, PIVOT TABLES, SLICERS, etc that will help you to play with the data. Not only this, Excel is quite capable of handling extremely large data sets as well. Hence it is quite suited for the job of a data analyst. We like to believe that you can do magic with Excel for the purposes of data analysis and manipulation.
Second, Excel has some great visualization tools that helps to present information in a graphical way. There are basic charts like LINE graph, Column chart, etc as well some advanced charting functions in excel that makes it highly apt as a visualization tool. We are going to look at all of the visualization tools in excel further in the course.
Third and a very important feature of EXCEL is that it allows for creating an interactive user interface so that the user can make a choice of what he or she wants to see. There are some advanced excel functions and functionalities like the Excel OFFSET FUNCTION, list functionality etc. which will help you to make your models dynamic and interactive. We are also going to look at such functionalities in this course.
And Finally, the icing on the cake is that Excel has in built programming functionalities with VBA macros that allows to play with extremely large and complicated volumes of data. There are some in-built STATISTICAL ADD-ins that will enable you to perform statistical regression based analysis as well on large data sets. We are going to look at this feature as well in this course.
As you can see, MS excel is a comprehensive tool that allows for analyzing, synthesizing and visualize large data sets for data analysis jobs. It is the one of the greatest tool that has been built for data analysis purposes.
No wonder, it is used by more than a billion people in their professional work life.


88 thoughts on “Microsoft Excel for Data Analytics: Tips and Tricks”
[…] data analysis as “data science”, but this is a misnomer. Data science is a specific subset of analytics that focuses on the development of quantitative models. Models are mathematical representations of […]
… [Trackback]
[…] Read More Info here on that Topic: skillfine.com/excel-data-analytics-tips-tricks/ […]
… [Trackback]
[…] Read More on to that Topic: skillfine.com/excel-data-analytics-tips-tricks/ […]
… [Trackback]
[…] Find More on that Topic: skillfine.com/excel-data-analytics-tips-tricks/ […]
… [Trackback]
[…] Here you can find 36353 more Information on that Topic: skillfine.com/excel-data-analytics-tips-tricks/ […]
… [Trackback]
[…] Read More on that Topic: skillfine.com/excel-data-analytics-tips-tricks/ […]
… [Trackback]
[…] Read More Info here on that Topic: skillfine.com/excel-data-analytics-tips-tricks/ […]
… [Trackback]
[…] There you can find 10176 additional Information to that Topic: skillfine.com/excel-data-analytics-tips-tricks/ […]
… [Trackback]
[…] Read More Info here to that Topic: skillfine.com/excel-data-analytics-tips-tricks/ […]
… [Trackback]
[…] Find More on that Topic: skillfine.com/excel-data-analytics-tips-tricks/ […]
… [Trackback]
[…] Find More here on that Topic: skillfine.com/excel-data-analytics-tips-tricks/ […]
… [Trackback]
[…] Info on that Topic: skillfine.com/excel-data-analytics-tips-tricks/ […]
… [Trackback]
[…] Read More on that Topic: skillfine.com/excel-data-analytics-tips-tricks/ […]
… [Trackback]
[…] Info to that Topic: skillfine.com/excel-data-analytics-tips-tricks/ […]
… [Trackback]
[…] Read More Information here to that Topic: skillfine.com/excel-data-analytics-tips-tricks/ […]
… [Trackback]
[…] Info on that Topic: skillfine.com/excel-data-analytics-tips-tricks/ […]
… [Trackback]
[…] Info to that Topic: skillfine.com/excel-data-analytics-tips-tricks/ […]
… [Trackback]
[…] Read More to that Topic: skillfine.com/excel-data-analytics-tips-tricks/ […]
… [Trackback]
[…] Find More Information here to that Topic: skillfine.com/excel-data-analytics-tips-tricks/ […]
… [Trackback]
[…] Find More Info here to that Topic: skillfine.com/excel-data-analytics-tips-tricks/ […]
… [Trackback]
[…] Information on that Topic: skillfine.com/excel-data-analytics-tips-tricks/ […]
ร้านขายรหัส Valorant
บริการ ร้านขายรหัส Valorant ด้วยระบบออโต้ 24 ชม. รับประกันหลังการขาย
BRC123 เดโม่สล็อต
The best platform for BRC123 เดโม่สล็อต, auto deposit and withdrawal.
Thank you for your blog article.Really thank you! Really Great.
Hey, thanks for the article post.Thanks Again. Want more.
Appreciate you sharing, great blog article.Thanks Again. Want more.
wow, awesome blog post.Much thanks again. Awesome.
Major thanks for the blog post.Thanks Again. Really Cool.
Looking forward to reading more. Great blog.Really thank you! Really Cool.
Thanks again for the article.Really thank you! Fantastic.
Thanks for the blog post. Really Cool.
Looking forward to reading more. Great blog article.Much thanks again. Really Great.
Major thanks for the article post.Thanks Again. Great.
Great, thanks for sharing this blog article.Thanks Again. Much obliged.
Major thanks for the article.Really thank you! Want more.
Thank you for your post.Really thank you! Awesome.
Major thankies for the blog post.Really thank you! Really Cool.
I am so grateful for your blog post.Much thanks again. Keep writing.
Thanks so much for the blog article.Really looking forward to read more. Fantastic.
Thanks a lot for the blog article.Much thanks again. Cool.
A big thank you for your blog.Thanks Again. Keep writing.
Thanks again for the post.Much thanks again. Will read on…
Thank you ever so for you article post.Much thanks again. Really Great.
Thank you ever so for you article. Fantastic.
I really like and appreciate your blog post. Want more.
I loved your post.Much thanks again.
Great blog. Really Cool.
I appreciate you sharing this article. Will read on…
Great blog.Thanks Again. Awesome.
Thanks again for the post. Keep writing.
I really liked your article post.Thanks Again. Awesome.
I loved your blog post.Really looking forward to read more. Awesome.
Im thankful for the article. Great.
Im obliged for the blog.Thanks Again. Will read on…
I loved your post.Thanks Again. Really Great.
Awesome blog post.Thanks Again. Much obliged.
Thank you ever so for you article post.Thanks Again. Want more.
Very good blog article.Really thank you! Great.
Thanks for sharing, this is a fantastic blog post.Really looking forward to read more. Great.
Wow, great article.Thanks Again. Really Cool.
Great, thanks for sharing this blog.Thanks Again. Really Cool.
Very informative article.Really thank you! Great.
I really liked your blog article.Thanks Again. Want more.
Very neat article.Really thank you!
Thanks a lot for the blog post. Really Cool.
Really enjoyed this blog post.Much thanks again. Great.
A big thank you for your blog.Thanks Again. Want more.
Wow, great blog post.Thanks Again. Great.
Appreciate you sharing, great article.Thanks Again. Much obliged.
Some argue that certain values are inherent to human nature. These intrinsic values are believed to be part of our biological or genetic makeup.
Thanks so much for the article post.Much thanks again. Great.
I value the blog post.Really thank you! Really Great.
I cannot thank you enough for the blog article.Much thanks again. Really Great.
Im obliged for the blog article.Thanks Again. Fantastic.
Enjoyed every bit of your blog article.Really looking forward to read more. Want more.
Fantastic article.Much thanks again. Keep writing.
Awesome blog post.Really looking forward to read more. Want more.
Very neat post.Really thank you! Awesome.
Very informative article.Thanks Again. Keep writing.
Thank you for your sharing. I am worried that I lack creative ideas. It is your article that makes me full of hope. Thank you. But, I have a question, can you help me?
532095 18246The electronic cigarette uses a battery and a small heating factor the vaporize the e-liquid. This vapor can then be inhaled and exhaled 65335
I like the helpful info you provide in your articles. I will bookmark your blog and check again here frequently.
I’m quite certain I will learn a lot of new stuff right here!
Good luck for the next!
Greate post. Keep posting such kind of information on your
site. Im really impressed by your blog.
Hey there, You have performed an excellent job. I will definitely digg it and for my part
suggest to my friends. I am confident they will be benefited from this site.
270543 576220Hiya! Amazing blog! I happen to be a day-to-day visitor to your site (somewhat a lot more like addict ) of this internet site. Just wanted to say I appreciate your blogs and am searching forward for more! 737266
Hey there! This is my 1st comment here so I just wanted to
give a quick shout out and tell you I really
enjoy reading your posts. Can you suggest any other blogs/websites/forums that go over the same subjects?
Appreciate it!
848703 752406Very good day! This post could not be written any better! Reading this post reminds me of my previous room mate! He always kept chatting about this. I will forward this write-up to him. Fairly certain he will have a good read. Thanks for sharing! 274316
Your article helped me a lot, is there any more related content? Thanks!
Your point of view caught my eye and was very interesting. Thanks. I have a question for you.