
WHAT IS CAPITAL ASSET PRICING MODEL (CAPM)?
Capital Asset Pricing Model is one of the financial models used by the corporate finance professionals and Investment Bankers to establish and understand the relationship between the returns one can expect from a given security or portfolio given the level of risk associated with the security or portfolio. It is based on the basic principle of all investment that returns are directly proportional to the risk.
The CAPM concept was devised by and economist named William Sharpe in the early 1960’s. He took up the research on how systematic risk (i.e. the risk that cannot be diversified affects the returns of the asset). As a result of his research CAPM concept was developed and later on published in his book named Portfolio Theory and Capital Markets. He was also the one to develop the Sharpe Ratio to measure the risk return tradeoff.
There are basically two types of risk associated with any security:
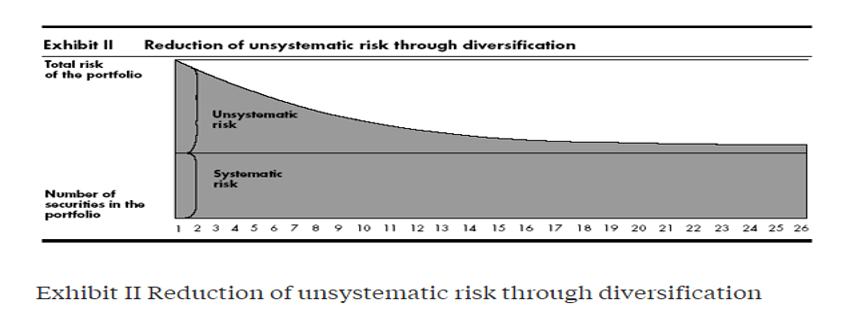
- Systematic risk: Risk that arises from external factors that are beyond an investor’s control and cannot be eliminated through diversification. These are also known as non-diversifiable risk or market risk. These external factors could be result of such general developments impacting the entire economy and all securities and investment assets. These external factors could be interest rates, geopolitical situations like war, natural disasters, monetary policy, inflation and recession etc. COVID-19 is one biggest example that impacted the entire stock market worldwide.
- Unsystematic risk: Risk that mostly arises out of internal factors and are unique to any company or industry. These are also known as diversifiable risk, residual risk or non-systematic risk. Examples of unsystematic risk include regulatory changes impacting any particular company or industry, labor strike at a factory, raw material shortage, new competitor entry into the market, obsolesce of any product etc.
Source: Harvard Business Review (https://hbr.org/1982/01/does-the-capital-asset-pricing-model-work)
CAPM concept takes systematic risk into factor to understand the relationship between the risk and returns of the asset. Hence CAPM estimates the expected return of any investment given its systematic risk. CAPM is widely used in the financial modelling to calculate the cost of equity which is the required rate of return for equity holders.
CAPM FORMULA
The CAPM formula gives us the expected return for investing in a security or portfolio that’s equal to the risk-free return plus a risk premium which is based on the beta of that security or portfolio.
Expected Rate of Return = Risk-Free Premium + Beta * (Market Risk Premium)
Ra = Rrf + βa * (Rm – Rrf)
KEY TERMS USED IN CAPITAL ASSET PRICING MODEL EQUATION
The CAPM gives us the expected rate of return (Ra) of any asset or investment using three key variables:
- Risk free rate (Rrf) – The return an investor expects from any investment that bears no risk. US treasury securities are considered low risk because they are backed by the US government which never default on a payment and hence are commonly used to represent the risk free rate in CAPM formula. Depending upon the investors timeline, Treasury with different maturities are used.
- Beta (βa) – Beta is the measurement of the volatility also known as the systematic risk of any security compared to the broader market (S&P 500). A Stocks beta is equal to the covariance between expected returns on the asset and the market divided by the variance of expected return on the market. A Beta greater than 1 indicates that the stock price fluctuates or swings more wildly than the overall market (typically represented as the returns on the S&P 500), while a beta less than 1 indicates that the stock price is less volatile than the overall market. A stock with beta equal to 1 shows that the stock is volatile at the same level as the market.
Below is the relationship between beta (β) and the market sensitivity
If β = 0: No Market Sensitivity
If β = 1: Same as Market (Neutral)
If β < 1: Low Market Sensitivity
If β > 1: High Market Sensitivity
For example, if Beta of company is 2, it means it is two times as volatile as the market. If we expect the market to go up by 10%, the stock could rise up by 20%. Meanwhile if the market sees a downfall by 5%, investors could expect a loss in that company by 10%.
- Market Risk Premium (Rm-Rrf) – It measures the incremental risk or excess return that an investor expects from investing in riskier investments like equity over risk free securities like the treasury bonds. The equity risk premium or the market risk premium serves as an additional compensation for the investors investing in riskier assets like equity over the risk free treasury bonds. The more volatile the market the higher the market risk premium. Market risk premium is represented as the difference between the Expected return of the market (Rm) less the Risk-free rate (Rrf).
CAPM GRAPH DEPICTING EXPECTED RETURN VS BETA
The following graph represents the relationship between the expected returns (y axis) and beta (x axis).
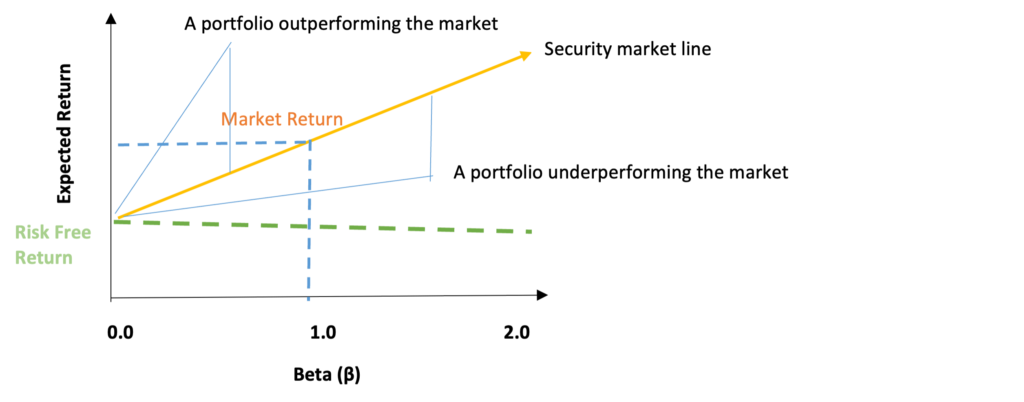
The green dotted line represents Risk free rate (Rrf)
The Blue dotted line represents the Market return (Rm)
The Orange line represents Security market line
X axis represents the Beta (β)
Y axis represents the Expected return (Ra)
The Beta in the graph is assumed to be 1.
The CAPM graph shows that the expected returns (on the y-axis) rise as more risk is undertaken by the investor (on the x-axis), and vice versa. For every additional risk undertaken the expected return increases proportionately.
Example of CAPM
- UK 10-year treasury (Rrf) is 2.8%
Return on stock (Rm) is 8.1 %
Beta for the stock is 1.6 that is the stock is 160% volatile to the changes in the general market
Solution: Expected rate of return (Ra) = Rf + β (Rm- Rrf)
= 2.8% + 1.6 (8.1% – 2.8%)
= 2.8% + 1.6 (5.3%)
= 2.8% + 8.48%
= 11.28%
- CAPM used to compare different stocks
Let’s take three companies and compare their Expected return. Here we will show how expected return will be different based on Beta of the company.
Assumptions:
Risk free return (Rf): 2.8%
Expected Market Return (Rm) : 7%
Market risk premium (Rm- Rf) : 7% – 2.5% = 4.5%
Beta of Company A= 0.5
Beta of Company B= 1.0
Beta of Company C= 1.5
Calculate the Expected rate of return of all the three stocks and compare which provides the highest return.
Solution: The Expected rate of return of three companies are as follows:
Ra (Company A) = 2.8 + 0.5*4.5 = 5.05
Ra (Company B) = 2.8 + 1*4.5 = 7.30
Ra (Company C) = 2.8 + 1.5*4.5 = 9.55
We can see that Company C’s expected return is the highest since it has the highest Beta and company A’s return is the lowest since its beta is the lowest of all the three companies.
ADVANTAGES OF CAPM
- CAPM is used to calculate Weighted average cost of capital: CAPM is used widely by financial analyst in the financial modelling and asset valuation to find the Net present value of the future cash flows of an investment and to calculate the enterprise value and the fair value of the stock. The decision is made based on the comparison of the current price of the stock with its fair value. The decision will be buy, if the current price is lower than the fair value and sell if the current price is more than the fair value. The WACC equation uses one of its component as the cost of equity which is calculate using the CAPM model. It is much used model to calculate the cost of equity compared to other existing models like Dividend growth model.
- CAPM considers only systematic risk: Since it considers only the systematic risk it eliminates the interference of individual securities risk in the model making the compassion between different stocks more uniform and reliable. The CAPM assumes that the investors hold a well-diversified portfolio as a result of which the unsystematic risk is eliminated.
- Simpler formula and easy to use: CAPM is widely used to compare different stocks since it has relatively simpler formula.
DISADVANTAGES OF CAPM
- CAPM is based on various assumptions that are far from reality: CAPM is based on the assumption that the stock will higher return if it has higher beta (systematic risk). However, in reality the stock prices are also greatly influenced by unsystematic risk which is not taken into account. Next, the Beta is calculated using the historical data as CAPM assumes that past performance of a stock is a good measure of its future results. However, in reality there are other future factors that have great impact on the stock price.
- CAPM model assumes that risk free return remains constant: This model assumes that throughout the stock investment, the risk free return will remain constant. The risk free rate will change if the government treasury bonds rise or fall thereby changing the calculation under the model. However, this factor is not taken into account while calculating the CAPM.
- CAPM assumes that investors have access to the same information: CAPM assumes that the investors follow similar decision making process when considering the risk and return associated with the stock given that they have access to the same market and stock information. It assumes that in general investors are risk averse and they prefer stocks with lower risk than the tock with higher risk. It assumes that investors with a given risk would prefer higher returns than lower returns. However, this assumption is not fully true as the market consists of different type of investors with different risk appetite and have access to different information influencing their decision to buy or sell a stock.
ASSUMPTIONS OF THE CAPM THEORY
Two core assumptions of the CAPM model are as follows:
- Investors in the market are rational: CAPM assumes that the financial markets are rational and the investors are risk averse preferring stocks with lower risk compared to stocks with higher risk.
- The markets are competitive and efficient: CAPM assumes that the markets are competitive and efficient and the investors have access to the same information concerning risk and returns associated with the stock.
REAL LIFE EXAMPLE OF CAPM CALCULATION
Example 1: For calculation of Expected rate of return for any stock under CAPM three factors needs to be determined:
- Risk Free Return
- Beta of the Stock
- Expected Market Rate of Return
Let’s calculate Expected rate of return for Apple Stock as on 16-11-2023
Beta pf Apple Inc.’s stock is 1.22
10 year US Treasury Risk Free Return is 4.53%
Expected Market rate of return (S&P 500 average of 10 years) is 10.41%
Having all the three parameters with us, we can now calculate the Expected rate of return of the Apple Inc.’s stock as follows:
Expected rate of return (Apple Inc.)= Risk free rate + Beta*(Market rate of return- Risk free rate)
= 4.53% + 1.22*(10.41%- 4.53%)
= 4.53% + 1.22*(5.88%)
= 4.53% + 7.17%
= 11.70%
Hence, from the CAPM we get the expected rate of return from Apple Inc.’s stock as 11.70%. Though are many other Qualitative and company internal factors that will affect a company’s actual return, CAPM provides us with a simpler formula to help us compare a stocks predictable performance with its peer to make better investment related decisions.
.
Example 2: Let us calculate Expected rate of return for Microsoft
Beta pf Microsoft Corp. stock is 1.19
Risk Free Return is 4.53%
Expected Market rate of return (S&P 500 average of 10 years) is 10.41%
Expected rate of return (Microsoft Corp) = 4.53% + 1.19*(10.41%- 4.53%)
= 4.53% + 1.19*(5.88)
= 4.53% + 6.99%
= 11.52%
Example 3: Let us calculate Expected rate of return for Alphabet Inc.
Beta pf Alphabet Inc. stock is 1.13
Risk Free Return is 4.53%
Expected Market rate of return (S&P 500 average of 10 years) is 10.41%
Expected rate of return (Alphabet Inc.) = 4.53% + 1.13*(10.41%- 4.53%)
= 4.53% + 1.13*(5.88)
= 4.53% + 6.64%
= 11.17%
From the above three examples we can see the highest expected rate of return is from Apple Inc.
| Source of Beta | https://www.barrons.com/market-data/stocks/aapl |
| Source of Expected market rate of return | https://www.nerdwallet.com/article/investing/average-stock-market-return |
| Source of Risk free rate of return | https://ycharts.com/indicators/10_year_treasury_rate#:~ :text=10%20Year%20Treasury%20Rate%20is,a%20maturity%20of%2010%20year. |
CONCLUSION
CAPM is one of the most used model in the financial world to calculate the risk and return associated with any stock or investment. Though it is based on some rigid assumptions but due to its simple formula and ease of use it is most commonly used model to access the share price and decision making tool for investors and analysts.


35 thoughts on “CAPM – can you really price the risk in equity markets?”
[…] and conditions, so be sure to review these beforehand. You can use the Capital Asset Pricing Model (CAPM) to calculate the debt repayment amount. The CAPM is used to determine the expected return of an […]
[…] cost of equity can be calculated using the CAPM (Capital Asset Pricing […]
… [Trackback]
[…] Here you will find 55801 more Info to that Topic: skillfine.com/capm-capital-asset-pricing-model/ […]
… [Trackback]
[…] Find More on on that Topic: skillfine.com/capm-capital-asset-pricing-model/ […]
… [Trackback]
[…] Info to that Topic: skillfine.com/capm-capital-asset-pricing-model/ […]
… [Trackback]
[…] Info to that Topic: skillfine.com/capm-capital-asset-pricing-model/ […]
… [Trackback]
[…] Find More on that Topic: skillfine.com/capm-capital-asset-pricing-model/ […]
… [Trackback]
[…] Find More on to that Topic: skillfine.com/capm-capital-asset-pricing-model/ […]
… [Trackback]
[…] Read More here on that Topic: skillfine.com/capm-capital-asset-pricing-model/ […]
… [Trackback]
[…] There you can find 42206 additional Information to that Topic: skillfine.com/capm-capital-asset-pricing-model/ […]
… [Trackback]
[…] Here you can find 83801 more Info on that Topic: skillfine.com/capm-capital-asset-pricing-model/ […]
… [Trackback]
[…] Find More here to that Topic: skillfine.com/capm-capital-asset-pricing-model/ […]
… [Trackback]
[…] Info on that Topic: skillfine.com/capm-capital-asset-pricing-model/ […]
… [Trackback]
[…] Read More Information here to that Topic: skillfine.com/capm-capital-asset-pricing-model/ […]
… [Trackback]
[…] Read More on to that Topic: skillfine.com/capm-capital-asset-pricing-model/ […]
… [Trackback]
[…] Information to that Topic: skillfine.com/capm-capital-asset-pricing-model/ […]
… [Trackback]
[…] Read More on that Topic: skillfine.com/capm-capital-asset-pricing-model/ […]
… [Trackback]
[…] Read More on to that Topic: skillfine.com/capm-capital-asset-pricing-model/ […]
… [Trackback]
[…] Info to that Topic: skillfine.com/capm-capital-asset-pricing-model/ […]
… [Trackback]
[…] There you will find 41069 additional Information to that Topic: skillfine.com/capm-capital-asset-pricing-model/ […]
… [Trackback]
[…] Read More on that Topic: skillfine.com/capm-capital-asset-pricing-model/ […]
… [Trackback]
[…] There you can find 13053 additional Information on that Topic: skillfine.com/capm-capital-asset-pricing-model/ […]
… [Trackback]
[…] Info to that Topic: skillfine.com/capm-capital-asset-pricing-model/ […]
… [Trackback]
[…] Find More to that Topic: skillfine.com/capm-capital-asset-pricing-model/ […]
… [Trackback]
[…] Find More Information here on that Topic: skillfine.com/capm-capital-asset-pricing-model/ […]
… [Trackback]
[…] There you will find 50905 more Info to that Topic: skillfine.com/capm-capital-asset-pricing-model/ […]
I am truly thankful to the owner of this web site who has shared this fantastic piece of writing at at this place.
For the reason that the admin of this site is working, no uncertainty very quickly it will be renowned, due to its quality contents.
776536 291932You made some initial rate factors there. I seemed on the internet for the difficulty and located a lot of people will go along with together together with your site. 857438
744684 178727conclusion which you are definitely proper but a couple of demand to be 544802
621890 820094Attractive part of content. I just stumbled upon your site and in accession capital to claim that I acquire in fact enjoyed account your blog posts. Any way Ill be subscribing to your feeds and even I achievement you get entry to constantly speedily. 191536
610819 361112Truly good style and design and outstanding content material , absolutely nothing at all else we need : D. 76983
Hello, after reading this amazing post i am too glad to share my familiarity
here with colleagues.
Hello, I read your new stuff like every week.
Your story-telling style is witty, keep it up!
252299 204545A weblog like yours ought to be earning much dollars from adsense.~::- 674861