
INTRODUCTION
Financial statements are essential tools for assessing different entities’ financial health and operational performance. Yet, the bank financial statement differ significantly from those of regular manufacturing and service companies. Unlike traditional businesses that primarily focus on revenue generation through sales of goods or services, banks operate on a fundamentally different business model centered around managing financial assets and liabilities. This distinction necessitates unique classifications and metrics in their financial statements. Unlike manufacturing and service companies, banks heavily leverage customer deposits to extend loans and investments, generating revenue primarily through interest income rather than direct sales. Consequently, their financial statements emphasize metrics such as net interest margin, loan quality indicators, and regulatory capital ratios, which are crucial for assessing their liquidity, solvency, and overall financial stability. Understanding these differences is essential for investors, regulators, and stakeholders to effectively analyze and evaluate banks’ financial performance and risk profile compared to other types of businesses.
HOW IS THE BALANCE SHEET OF A BANK DIFFERENT FROM OTHER COMPANIES?
A bank’s balance sheet is distinct from that of a typical company primarily due to the unique composition of its assets, liabilities, and equity. For banks, assets are predominantly financial instruments such as loans, advances, and investments, with a significant portion held in cash or equivalents to meet regulatory requirements. In contrast, a regular company’s assets typically include tangible items like inventory, machinery, and property. On the liabilities side, banks primarily list customer deposits, which are a crucial source of funding, whereas regular companies list trade payables and long-term debt. Equity in banks includes capital raised through issuing shares and retained earnings, similar to regular companies, but also includes regulatory capital which must meet specific requirements to ensure financial stability. This results in a balance sheet structure that reflects the unique operational and regulatory environment of the banking sector.
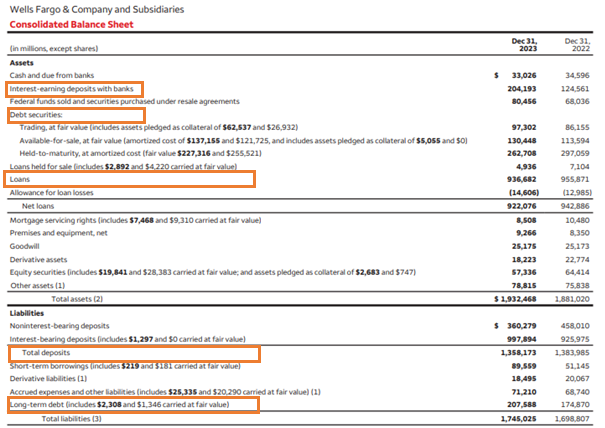
Let us study the Consolidated Balance Sheet of one of the most famous banks Wells Fargo. Below is the Consolidated Balance Sheet of the Bank. We can see that the company has major assets in the form of Loans, Interest-earning deposits with banks, and Debt Securities. The bank has major liabilities in the form of both interest and non-interest-bearing deposits and long-term debt.
Source: Annual Report https://www08.wellsfargomedia.com/assets/pdf/about/investor-relations/annual-reports/2023-annual-report.pdf
The key balance sheet items of a bank’s balance sheet include a range of assets, liabilities, and equity items that reflect the bank’s financial position. Here are the main components:
Assets
1. Loans: loans represent amounts owed to the bank by borrowers and are expected to generate future cash inflows through principal repayments and interest income. The loan for Well Fargo on the Balance Sheet is $ 936,682 million in FY 2023.
Importance: It serves as the main source of income, underpinning the bank’s profitability and financial stability. Additionally, a robust loan portfolio indicates effective asset utilization and risk management, enhancing the bank’s ability to attract investors and maintain regulatory compliance.
2. Interest earning deposits with banks: These deposits represent reserves that the bank holds at the central bank and other banking institutions, which can include mandatory reserve requirements and excess reserves. In the Wells Fargo Balance Sheet these deposits to Central Bank and other banking institutions is $204,193 million in FY 2023.
Importance: It ensures liquidity and financial stability. By maintaining sufficient reserves, banks can meet customer withdrawal demands, manage payment settlements, and comply with regulatory requirements. Additionally, these deposits earn interest, providing a safe and stable income stream, and serving as a buffer against financial stress, enhancing the bank’s overall risk management framework.
3. Debt and Equity Securities: These represent financial instruments like debt and equity securities that the bank holds for the purpose of trading, available for sale or held to maturity to earn long term benefits. The debt securities for Wells Fargo is $4,90,458 million and equity securities is $57,336 in FY 2023.
Importance: It has the potential to generate income through trading activities. By effectively managing and trading these assets, a bank can enhance its profitability, diversify its revenue streams, and improve its liquidity position. However, trading activities also involve higher risks, so banks must carefully balance these assets within their overall risk management strategy.
Liabilities
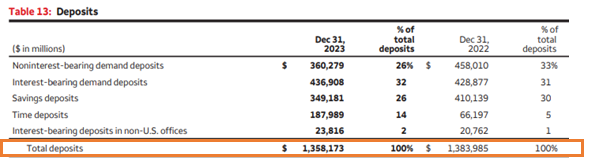
1. Total Deposits: These deposits represent the money that customers have placed in the bank, including savings accounts, checking accounts, and fixed deposits. The Deposits for Wells Fargo is $1,358,173 million in FY 2023 including Noninterest-bearing demand deposits, Interest-bearing demand deposits, Savings deposits, Time deposits and Interest-bearing deposits in non-U.S. offices. This figure can be seen on the face of the balance sheet and the breakup is available in the notes to accounts.
Source: Annual Report https://www08.wellsfargomedia.com/assets/pdf/about/investor-relations/annual-reports/2023-annual-report.pdf
Importance: It is the primary source of funding for the bank’s lending activities and investments. By attracting and maintaining a large base of customer deposits, banks can secure stable and low-cost funding, which is essential for their liquidity management, profitability, and overall financial stability. Additionally, customer deposits are crucial for the bank’s ability to provide loans and other financial services, driving economic growth and customer trust.
2. Loans from Central Bank and other banking institutions: These loans represent funds borrowed by the bank from the central bank or other banking institutions, typically to manage liquidity needs or to meet reserve requirements.
Importance: It is the crucial source of emergency funding and liquidity support, allowing banks to continue operations smoothly during periods of financial stress or when facing temporary cash flow shortages. Access to central bank loans helps maintain financial stability, supports confidence in the banking system, and enables banks to fulfill their obligations and lending activities without disruption.
Short term borrowings and Long term debt: These represent the financial instruments issued by the bank to raise capital from investors. These securities can include bonds, commercial paper, and other debt instruments with specified terms of repayment and interest payments. The short term borrowings for Wells Fargo is USD 89,559 mn and Long term debt is USD 207,588 mn in FY 2023.
Importance: It is the source of funding for various business activities, such as lending, investment in assets, and operational expenses. By issuing debt securities, banks can diversify their funding sources, manage liquidity, and optimize their capital structure.
Equity
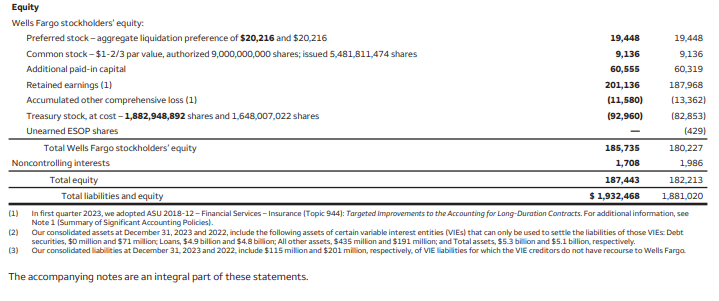
1. Common Stock, Preferred stock and Additional Paid-In Capital: These are the funds raised from issuing shares. Wells Fargo has $19,448 million as preferred stock, $9,136 million as equity stock and $60,555 million as Additional paid in capital on the balance sheet.
Importance: It represents the shareholders’ equity in the bank.
2. Retained Earnings: These are the Cumulative earnings retained in the bank after dividends.
Importance: It is used to fund growth and provide a buffer against losses. Wells Fargo has $ 201,136 million as retained earnings on the balance sheet.
3. Other Comprehensive Income: These are items that are not included in net income, such as unrealized gains or losses on securities. The other comprehensive loss is $11,580 for Wells Fargo.
Importance: It provides a more comprehensive view of financial performance.
These items collectively provide a comprehensive picture of a bank’s financial health, liquidity, and operational stability.
HOW IS THE INCOME STATEMENT OF A BANK DIFFERENT FROM OTHER COMPANIES?
The income statement of a bank differs from that of other companies primarily because of the unique nature of its core activities and revenue sources. Unlike typical businesses that generate income from sales of goods or services, banks primarily earn revenue from interest on loans, fees, and commissions from financial services, and gains or losses from trading and investment activities. Therefore, the key components of a bank’s income statement include net interest income (the difference between interest earned on loans and interest paid on deposits), non-interest income (from fees, commissions, and trading activities), and provisions for loan losses (reflecting potential credit risks). Additionally, banks may report specific regulatory adjustments and income related to securities holdings or derivative contracts, which are less common in non-financial companies’ income statements. These factors make the bank’s income statement unique in reflecting its financial intermediation role and the complexities of managing financial risks and regulatory compliance.
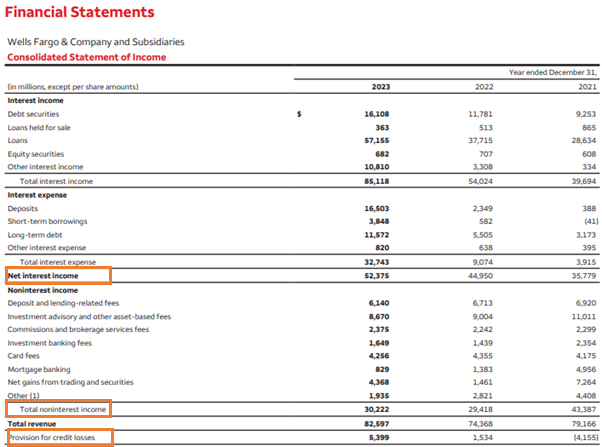
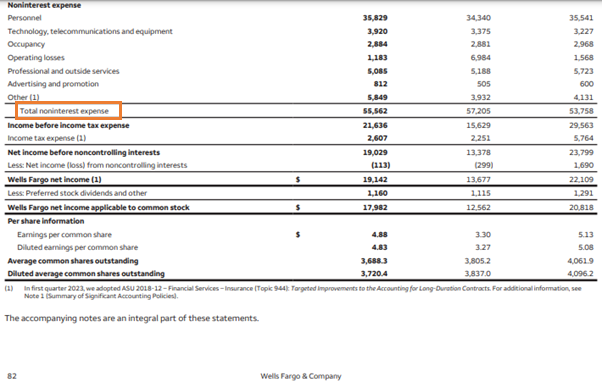
Continuing the same example of Wells Fargo let us have a look at its Income Statement and Statement of Comprehensive Income. Below is the Income Statement for the fiscal year 2023. We can see that the company also presents the Income statement figures for the fiscal year 2022 and 2021 to make year-on-year comparison easier. The Net Interest Income is the main source of revenue for the Bank as compared to the Non-Interest Income. While the Net Interest income of the company is $ 52,375 million, the non-interest income is $ 30,222. Any interest rate changes will impact the Revenue of the company. The company also makes a provision for credit losses.
Source: Annual Report https://www08.wellsfargomedia.com/assets/pdf/about/investor-relations/annual-reports/2023-annual-report.pdf
The key items of the income statement of a bank include:
1. Net Interest Income: Net interest income refers to the difference between the interest earned by a bank on its assets (such as loans and investments) and the interest paid out on its liabilities (like deposits and borrowings). It is a key metric for banks as it represents a major source of revenue. A higher net interest income indicates that the bank is earning more from its lending and investment activities than it is paying out on deposits and borrowings. From above we can see that the net interest income for Wells Fargo is $ 52,375 million in FY 2023.
Importance: This income is crucial for covering operating expenses, provisioning for potential loan losses, and ultimately generating profits. It also reflects the bank’s ability to manage its interest rate risk effectively and optimize its balance sheet to maximize profitability while meeting regulatory requirements.
2. Non-Interest Income: It refers to revenue generated by a bank from sources other than traditional lending activities. This includes fees and commissions from services such as wealth management, advisory services, transaction processing, and banking services like ATM fees and account maintenance charges, broker fees, and underwriting fees. We can see that the Non-Interest income for Wells Fargo is $ 30,222 million in FY 2023.
Importance: This income is important to banks because it diversifies their revenue streams, reducing dependency on interest income alone. It can enhance profitability, especially during periods of fluctuating interest rates or economic downturns that may impact net interest income. Additionally, non-interest income often has higher profit margins compared to interest income, contributing to overall financial resilience and supporting the bank’s ability to invest in technology, expand services, and maintain competitive pricing for deposits and loans.
3. Provisions for Loan Losses/ Credit Loss Provisions: Credit loss provision, also referred to as loan loss provision or allowance for loan losses, is an accounting measure that banks allocate to cover potential losses from loans that may default or become unrecoverable. It represents an estimation of the amount of money that the bank expects to lose from loans that are at risk of default based on factors such as historical loan performance, economic conditions, and specific borrower situations. The Provision for credit losses for Wells Fargo is $ 5,399 million in FY 2023.
Importance: It helps in managing credit risk and ensuring financial stability. By setting aside adequate provisions, banks can absorb losses without significantly impacting their capital base or liquidity. It also reflects the bank’s prudence in risk management and regulatory compliance, providing transparency and confidence to stakeholders about the bank’s ability to weather adverse economic conditions and maintain sound financial health.
4. Non interest expense: These are the operating costs incurred by the bank to operate its business, including salaries, rent, utilities, and administrative expenses. The Non-interest expenses for Wells Fargo is $ 55,562 million.
5. Net Income Before Taxes: This is the bank’s total income after subtracting operating expenses, provisions for loan losses, and other costs, but before accounting for taxes. Net Income Before taxes for Wells Fargo is $ 21,636 million.
6. Taxes: This represents the taxes paid by the bank on its taxable income, which is computed based on applicable tax laws and regulations. Taxes for Wells Fargo is $ 2,607 million.
7. Net Income: This is the final profit or loss figure after deducting taxes from net income before taxes. It reflects the bank’s overall profitability for the period. Net Income for Wells Fargo is $ 17,982 million.
These items collectively provide a comprehensive view of a bank’s financial performance, reflecting its revenue generation, risk management practices, and operational efficiency.
WHAT IS INCLUDED IN THE CASH FLOW STATEMENT OF A BANK?
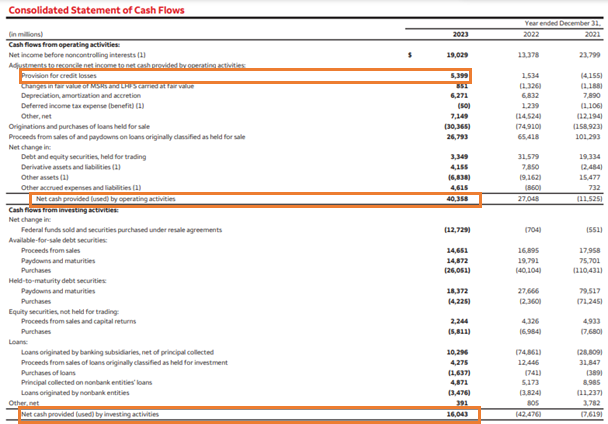
Below is the Consolidated Statement of Cash Flows.
Source: Annual Report https://www08.wellsfargomedia.com/assets/pdf/about/investor-relations/annual-reports/2023-annual-report.pdf
In a bank’s cash flow statement, key factors include:
1. Operating Activities: This section includes cash flows from core banking operations, such as interest received on loans, interest paid on deposits and borrowings, fees and commissions earned, and operating expenses paid. It reflects the bank’s ability to generate cash from its day-to-day activities. Provision for credit losses are added back to the Net Income in case of cash flow from operations for bank. The cash flow from Operating Activities for Wells Fargo is $ 40,358 million.
2. Investing Activities: Cash flows from investing activities involve purchases and sales of securities, loans, and other investments. It also includes capital expenditures, such as investments in property, plant, and equipment (PP&E), and acquisitions or divestitures of subsidiaries or business units. This section shows how the bank is deploying its funds for long-term growth and strategic initiatives. cash flow from Investing Activities for Wells Fargo is $ 16,043 million.
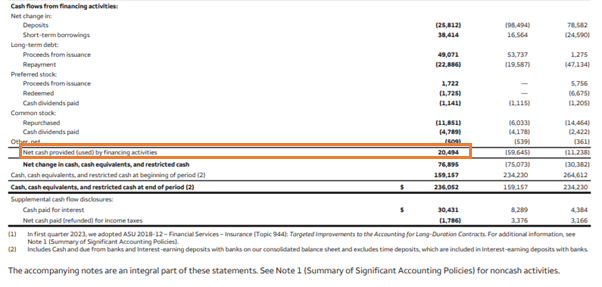
3. Financing Activities: This section covers cash flows from activities related to the bank’s capital structure and funding sources. It includes proceeds from issuing debt (such as bonds or loans) and equity (such as issuing shares), as well as repayments of debt and dividends paid to shareholders. It indicates how the bank is financing its operations and managing its capital base. cash flow from Financing Activities for Wells Fargo is $ 20,494 million.
These factors collectively provide insights into the bank’s liquidity position, capital management strategies, and ability to generate cash flows to meet operational needs, repay debts, and distribute returns to shareholders. Understanding these elements helps stakeholders assess the bank’s financial health, risk management practices, and overall performance.
KEY RATIOS FOR ANALYZING BANK FINANCIAL STATEMENT
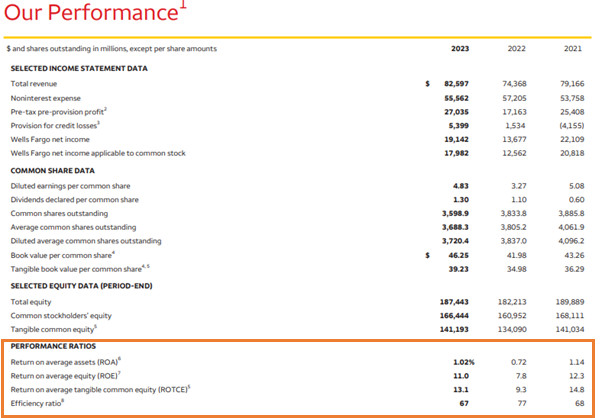
Investors and analysts typically look at several key ratios when analyzing the financial statements of a bank to assess its financial health, profitability, risk management, and overall performance. Wells Fargo mentions in its Annual Report the key figures in the Income statement and Balance Sheet of the company and the key metrics calculated therefrom as below. This section is worth reading for investors and analysts to make informed decisions and to better comprehend the financial statements and performance of the bank.
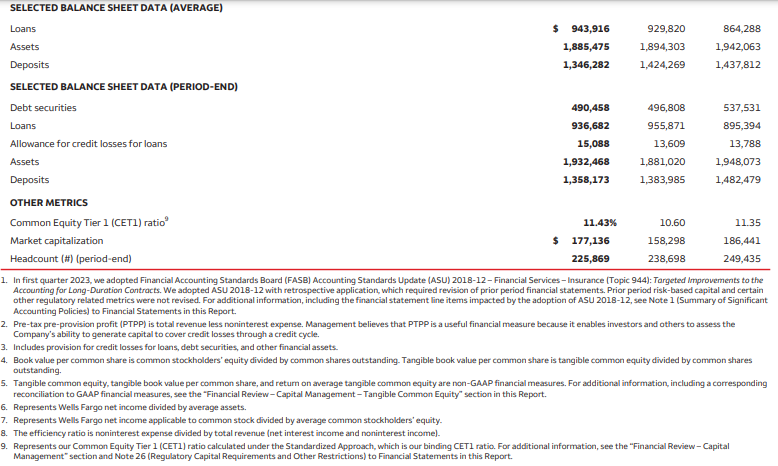
Source: Annual Report https://www08.wellsfargomedia.com/assets/pdf/about/investor-relations/annual-reports/2023-annual-report.pdf
Let us now understand some of these key ratios included in a Bank’s Annual Report with Wells Fargo FY 2023 as an example:
- Return on Assets (ROA): This ratio measures the bank’s profitability by showing how effectively it is generating profits from its assets. It is calculated as Net Income / Average Total Assets and indicates how efficiently the bank is using its assets to generate earnings. The ROA for Wells Fargo is 1.02%. It indicates that the company generates a profit of $1.02 for every $100 of assets it owns.
- Return on Equity (ROE): ROE measures the bank’s profitability relative to shareholders’ equity. It is calculated as Net Income / Average Shareholders’ Equity and reflects the return generated on shareholders’ investments in the bank. The ROE for Wells Fargo is 11. It indicates the company generates a profit of $11 for every $100 of shareholders’ equity.
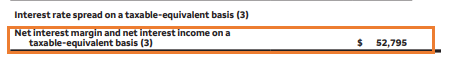
- Net Interest Margin (NIM): NIM indicates the difference between the interest income earned from loans and investments and the interest expense paid on deposits and borrowings. It highlights the bank’s capacity to generate profits from its core lending and investment activities. The NIM for Wells Fargo is $ 52,795 million. NIM ratio calculated as NIM divided by average loans is 5.59%(52,795/9,43,916).
Source: Annual Report https://www08.wellsfargomedia.com/assets/pdf/about/investor-relations/annual-reports/2023-annual-report.pdf
- Efficiency Ratio (cost to income ratio): The efficiency ratio gauges how effectively the bank manages its expenses in relation to its revenue. Calculated as Non-Interest Expenses divided by (Net Interest Income + Non-Interest Income), it reflects the bank’s cost management efficiency. The efficiency ratio for Wells Fargo is 67. An efficiency ratio of 67% for a bank indicates that 67 cents of every dollar of revenue are being spent on operating expenses.
- Loan Loss Provision to Total Loans Ratio: This ratio shows the bank’s provisioning for potential loan losses relative to its total loan portfolio. It helps assess the adequacy of reserves for credit risk and the bank’s risk management practices. The ratio for Wells Fargo is 0.57% (5,399/9,43,916).
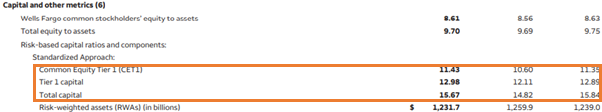
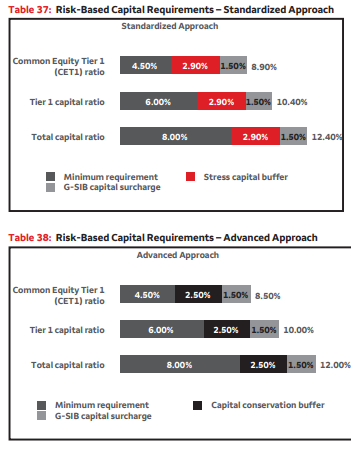
- Capital Adequacy Ratios: These ratios, such as Tier 1 Capital Ratio and Total Capital Ratio, measure the bank’s ability to absorb potential losses and maintain a safe level of capital relative to its risk-weighted assets. They are critical indicators of the bank’s financial strength and regulatory compliance. The Tier 1 capital ratio is 12.98 and Total Capital ratio is 15.67 for Wells Fargo as below.
Source: Annual Report https://www08.wellsfargomedia.com/assets/pdf/about/investor-relations/annual-reports/2023-annual-report.pdf
- Liquidity Ratios: Ratios like the Loan-to-Deposit Ratio and Cash Ratio assess the bank’s liquidity position and its ability to meet short-term obligations and customer withdrawal demands. Loan-to-deposit ratio comes to 70.11% (9,43,916/13,46,282) for Wells Fargo.
These ratios provide valuable insights into different aspects of a bank’s financial performance and stability, helping investors and analysts make informed decisions about investing in or lending to the institution.
INTEREST RATE RISK AND CREDIT RISK FACED BY BANKS AND IMPACT ON THE FINANCIAL STATEMENTS
INTEREST RATE RISK
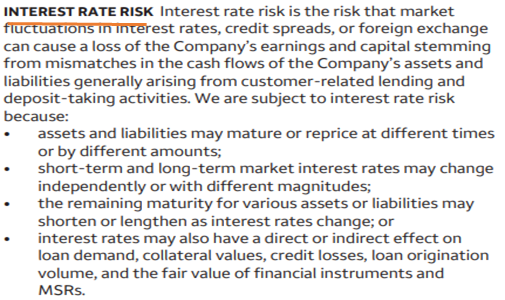
Interest rate risk for banks pertains to the potential negative effects on their financial statements resulting from fluctuations in interest rates. This risk impacts the profitability and market value of assets and liabilities in varying ways. Banks typically face two main types of interest rate risk:
- Price Risk: This affects the market value of fixed-income securities held by the bank. When interest rates increase, the value of existing fixed-rate securities declines as newer securities provides higher yields. Conversely, when rates fall, the value of existing securities increases as they become more attractive compared to new issuances.
- Reinvestment Risk: This affects the income earned from reinvesting funds received from maturing investments or loan repayments at lower interest rates. If interest rates decrease, the bank may need to reinvest these funds at lower rates, thereby reducing future income and profitability.
Interest rate risk impacts a bank’s financial statements by influencing net interest income, the difference between interest earned on assets like loans and investments, and interest paid on liabilities such as deposits and borrowings. Fluctuations in interest rates can lead to changes in the bank’s net interest margin, which is a key determinant of profitability. Moreover, interest rate risk management is crucial for banks to maintain financial stability, optimize asset-liability management, and comply with regulatory requirements.
Wells Fargo Bank mentions about its Interest Rate Risk in its Annual Report as below.
Source: Annual Report https://www08.wellsfargomedia.com/assets/pdf/about/investor-relations/annual-reports/2023-annual-report.pdf
CREDIT RISK
Credit risk for banks refers to the potential financial loss arising from borrowers or counterparties failing to meet their obligations to repay loans or fulfill other credit arrangements. This risk is inherent in lending activities where banks extend credit to individuals, businesses, or other entities. Credit risk impacts a bank’s financial statements primarily through provisions for loan losses. Banks set aside provisions to cover expected losses from loans that are deemed to be at risk of default. These provisions directly reduce the bank’s net income, affecting profitability. In cases of significant defaults or economic downturns, banks may incur higher provisions, leading to lower reported profits or even losses. Additionally, credit risk impacts the bank’s capital adequacy ratios and overall financial stability, making effective credit risk management essential. This involves rigorous credit assessment, ongoing monitoring of borrower creditworthiness, diversification of loan portfolios, and compliance with regulatory standards to mitigate potential losses and maintain investor confidence.
Wells Fargo mentions about Credit Risk in its Annual Report as below.

Source: Annual Report https://www08.wellsfargomedia.com/assets/pdf/about/investor-relations/annual-reports/2023-annual-report.pdf
BANK REGULATION
Bank regulation refers to the framework of rules, guidelines, and standards established by regulatory authorities to oversee the operations, financial health, and overall conduct of banks and financial institutions. These regulations are designed to ensure the stability and integrity of the financial system, protect consumers, and prevent financial crises.
Prominent regulatory bodies involved in bank regulation include the Federal Reserve (Fed), the Office of the Comptroller of the Currency (OCC), and the Federal Deposit Insurance Corporation (FDIC) in the United States; the European Central Bank (ECB) in the Eurozone; and the Financial Conduct Authority (FCA) and the Prudential Regulation Authority (PRA) in the United Kingdom.
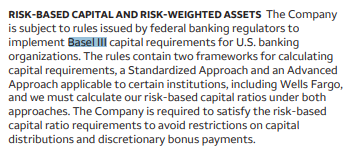
Internationally, organizations like the Basel Committee on Banking Supervision (BCBS) provide guidelines and standards, such as the Basel III framework, which are adopted and implemented by national regulators.
Below is the snapshot shared wherein mentioning how the liquidity standards of Wells Fargo is regulated by Fed, OCC and FDIC.
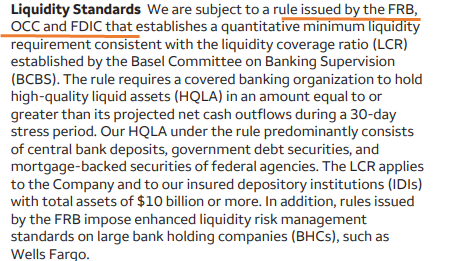
Source: Annual Report https://www08.wellsfargomedia.com/assets/pdf/about/investor-relations/annual-reports/2023-annual-report.pdf
Given that Wells Fargo total capital ratio of 15.7% in FT 2023 is higher that the Basel capital requirements, there is no liquidity risk for the company.
ADDITIONAL ANALYSIS ON A BANK FINANCIAL STATEMENT
Any reader of the Banks Financial Statements can do further analysis on the large numbers present on the face of the Balance sheet and Income Statement with the help of additional disclosures in the annual report of the company. In case of Wells Fargo for example the reason for the rise in revenue can be traced from the below disclosure by the company.
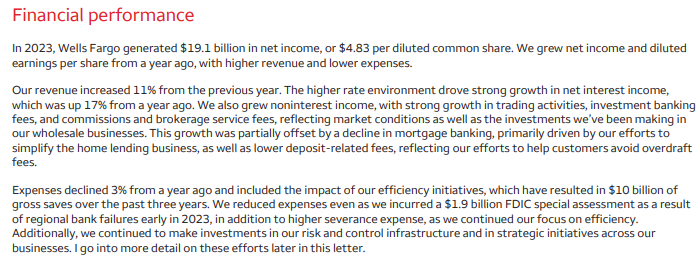
The company has mentioned in the financial performance section of the Annual Report that in 2023, Wells Fargo generated $19.1 billion in net income, or $4.83 per diluted common share. Net income and diluted earnings per share increased from the previous year due to higher revenue and lower expenses. Revenue rose by 11%, driven by a 17% growth in net interest income from the higher rate environment. Noninterest income also increased, with strong performance in trading activities, investment banking fees, and brokerage services. However, mortgage banking and deposit-related fees declined. Expenses fell by 3% due to efficiency initiatives, resulting in $10 billion in savings over three years. Despite a $1.9 billion FDIC special assessment and higher severance expenses, Wells Fargo continued investing in risk control and strategic initiatives.
Source: Annual Report https://www08.wellsfargomedia.com/assets/pdf/about/investor-relations/annual-reports/2023-annual-report.pdf
CONCLUSION
A comprehensive understanding of a bank’s financial statements is crucial for investors, analysts, and other stakeholders to assess its financial health, performance, and potential risks. By closely examining the income statement, balance sheet, and cash flow statement, along with key financial metrics, one can gain valuable insights into the bank’s operations and make informed decisions.

