Analysing financial statements is key to understanding the financial strength of any company, and in the real estate sector, the complexities are even more pronounced. Lennar Corporation, a leader in homebuilding, offers a prime example of how its financials provide crucial insights into its business operations. Unlike typical retailers or service companies, which focus on inventory and service revenue, Lennar’s financials emphasize land acquisitions, construction costs, and home sales. Each figure, from property values to development expenses, reveals the company’s strategic decisions and growth trajectory. By diving into a real estate financial statements company like Lennar Corporation, we uncover the unique accounting practices in real estate, helping us better grasp the factors that influence its performance and long-term success in a highly competitive market.
HOW IS THE INCOME STATEMENT OF A REAL ESTATE COMPANY DIFFERENT FROM OTHER COMPANIES?
A real estate company’s income statement, like that of Lennar Corporation, differs significantly from other industries due to its focus on
- Revenue: revenue from home sales and land development rather than traditional product or service sales. For example, Lennar’s income statement highlights revenue primarily from the sale of homes, land, and financial services like mortgages, rather than from selling goods or services directly to consumers.
- Expenses: Expenses include not only construction and land acquisition costs but also significant interest expenses tied to land and property development. Additionally, Lennar’s income statement reflects fluctuations in housing market conditions, such as changes in home prices and demand, which directly impact profitability.
This unique structure, focusing on property sales, development costs, and financing, distinguishes Lennar’s income statement from that of typical retailers or service companies.
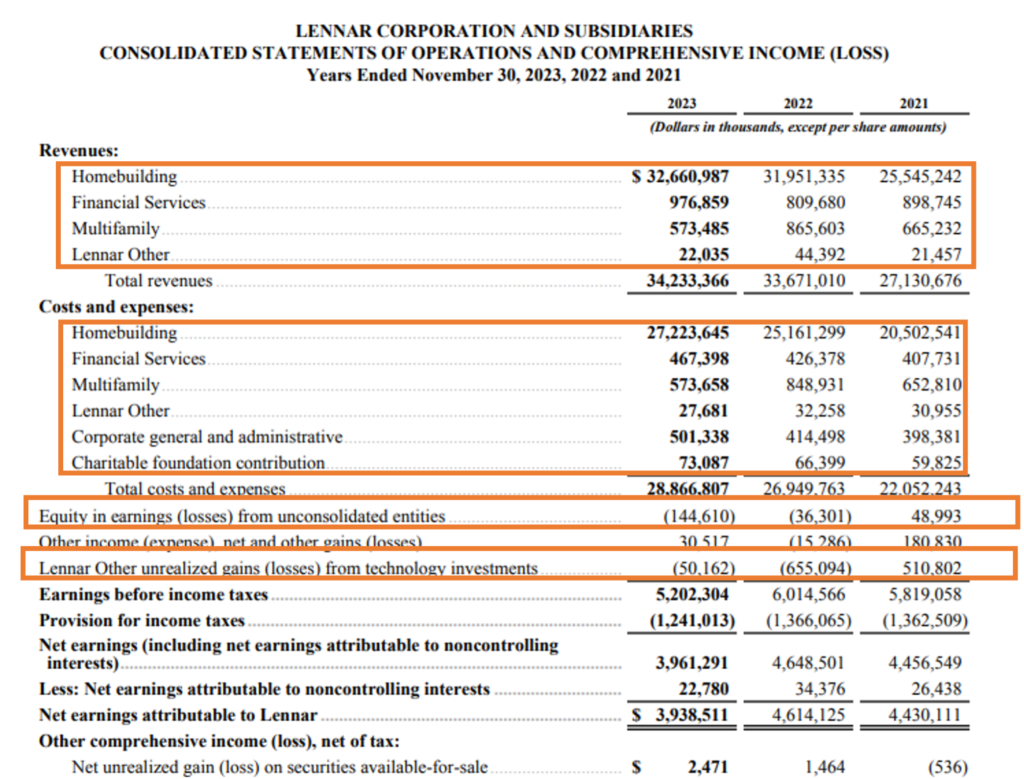
Taking Lennar Corporation as an example, let us review its income statement for the fiscal year 2023, which provides a comparison with 2022, enabling stakeholders to assess year-on-year performance. This statement illustrates the effects of real estate cycles, pricing dynamics, and financing on the company’s profitability.

Source: Annual Report https://investors.lennar.com/~/media/Files/L/Lennar-IR-V3/documents/annual-reports/2023-annual-report.pdf
The key items of the income statement of a real estate company include:
1. Revenue
- Revenue from Homebuilding: For real estate companies, revenue from homebuilding primarily refers to income generated through the construction and sale of residential properties, including single-family homes, townhouses, and condominiums. This also encompasses related activities such as land sales, which may include developed or undeveloped lots, and various homebuilding services such as managing residential communities and forfeited deposits.
For Lennar Corporation, homebuilding revenue is the core of its business, representing 95% of its total consolidated revenue. In fiscal year 2023, Lennar’s homebuilding operations generated $32,661 million, out of a total revenue of approximately $34,233 million. This revenue includes income from the sale of 73,087 homes, land sales, and fees related to residential development. Although the average home sales price decreased to $446,000 in 2023 from $480,000 in 2022, the company maintained revenue growth through increased home deliveries and effective cost management. Homebuilding revenue remains a key driver of Lennar’s financial performance
- Revenue from Financial Services: For real estate companies like Lennar Corporation, revenue from financial services refers to income generated through ancillary services such as mortgage financing, title insurance, and closing services, primarily for homebuyers. These services are essential to the home buying process and provide a steady source of income in addition to home sales.
In 2023, Lennar Corporation’s financial services segment generated $976.9 million, accounting for approximately 3% of its total revenue of $34,233 million. This revenue came primarily from mortgage origination, title, and closing services, with Lennar Mortgage providing loans for 81% of homebuyers who obtained financing. The growth in financial services revenue over the prior year was driven by an increase in the number of mortgage loans originated, rising from 37,700 in 2022 to 47,000 in 2023, as well as an increase in the total value of loans originated
- Revenue from Multifamily: Revenue from multifamily properties is crucial for real estate companies, as it represents income from developing and managing residential communities with multiple families. This income primarily comes from rental leases of various housing types, including garden-style, mid-rise, and high-rise buildings, which offer stable cash flow due to consistent demand, especially in urban areas.
In 2023, Lennar Corporation’s multifamily segment generated $573.5 million, accounting for approximately 2% of its total revenue of $34,233 million.
- Revenue from Lennar Other: Revenue from the Lennar Other segment is essential for real estate companies, representing income derived from strategic investments in technology companies that enhance the home buying experience and improve operational efficiencies.
This segment helps Lennar reduce selling, general, and administrative (SG&A) expenses while remaining competitive in the homebuilding market. Key components include investments in companies like Blend Labs (digital lending), Hippo Holdings (home insurance), Open door Technologies (home buying), Smart Rent (smart home tech), Sonder Holdings (short-term rentals), and Sunnova Energy (residential solar solutions). In 2023, Lennar Corporation’s Lennar Other segment generated $22 million, accounting for approximately 0.05% of its total revenue of $34,233 million.
- Cost and expenses: For a real estate company, costs and expenses typically include construction costs, land acquisition and development, sales and marketing, administrative overhead, financing costs, and property management expenses. These cover everything from building materials and labour to marketing properties and maintaining rental units.
For Lennar Corporation, the key costs and expenses include homebuilding costs amounting to $27,223 million, which are the largest, financial services expenses related to mortgage and insurance operations amounting to $467 million, multifamily development costs amounting to $573 million, and Lennar other expenses of $27 million. Lennar also includes charitable contributions of $73 million as part of its overall costs, reflecting its commitment to community support.’
- Equity in Earnings (Loss) from Unconsolidated Entities: It represents a company’s share of the profits or losses from investments in entities it does not fully control, typically those where it owns 20%–50% and uses the equity method of accounting. This line item shows the company’s proportionate share of the net income or loss of these entities, reflecting their impact on profitability. Lennar has reported negative $144 million as Equity in earnings (loss) from unconsolidated entities in the fiscal year 2023.
- Lennar Other unrealized gains (losses) from technology investments: In Lennar’s income statement for the year ending November 30, 2023, “Other unrealized losses from technology investments” reflects mark-to-market adjustments on publicly traded technology investments and includes losses totaling $50.2 million. These losses represent changes in the fair value of Lennar’s investments in companies like Blend Labs, Hippo, Opendoor, SmartRent, Sonder, and Sunnova, which are accounted for at fair value through earnings.
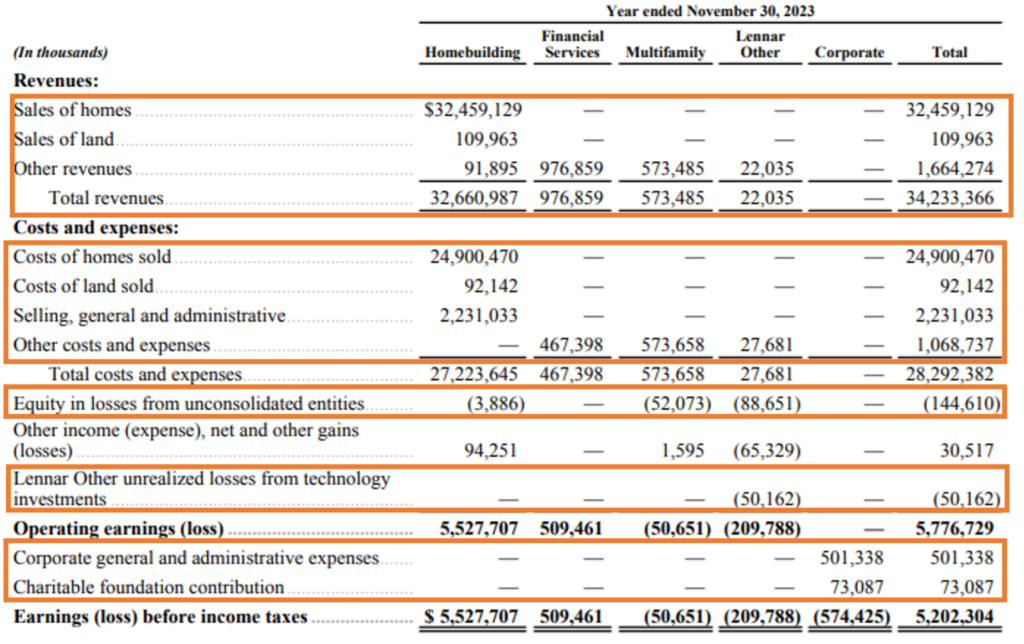
From below one can see the revenue and cost belonging to individual segments.
Source: Annual Report https://investors.lennar.com/~/media/Files/L/Lennar-IR-V3/documents/annual-reports/2023-annual-report.pdf
HOW IS THE BALANCE SHEET OF A REAL ESTATE COMPANY DIFFERENT FROM OTHER COMPANIES?
The balance sheet of a real estate company, such as Lennar Corporation, differs significantly from that of traditional businesses due to its emphasis on property-related assets and liabilities. While a typical company’s balance sheet may highlight assets like inventory and machinery against loans and accounts payable, Lennar’s balance sheet is dominated by real estate assets, including land holdings, properties under development, and completed homes awaiting sale. These assets make up a significant portion of the balance sheet, reflecting the company’s core business of acquiring, developing, and selling property. Additionally, the liabilities section often includes construction loans and obligations tied to land development, which are distinct from the short-term operational liabilities seen in retailers or service companies. This focus on real estate investments and development financing underscores the unique financial structure that drives growth in the real estate industry.
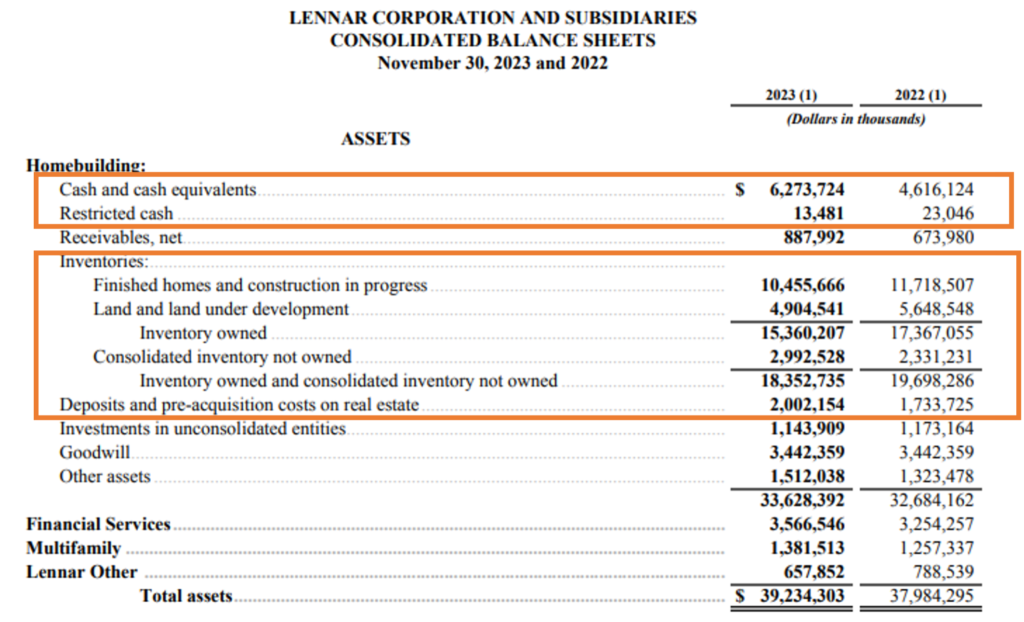
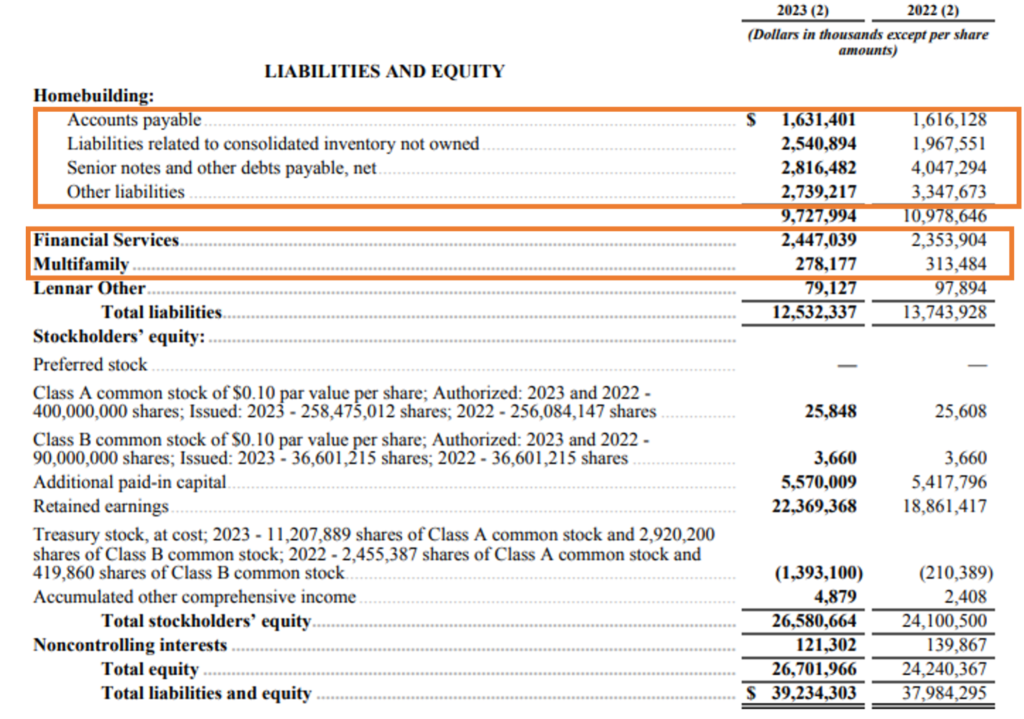
Continuing the above example, let us study the Consolidated Balance Sheet of Lennar Corporation. Below is the Consolidated Balance Sheet of the Real Estate Company. It is interesting to find that the Balance Sheet of this company does not classifies its assets and liabilities in the Balance Sheet as current and non-current. Another thing to note is that the company does not have any classification as Fixed Assets in its Balance sheet.
Source: Annual Report https://investors.lennar.com/~/media/Files/L/Lennar-IR-V3/documents/annual-reports/2023-annual-report.pdf
The key balance sheet items of a real estate company’s balance sheet include a range of assets, liabilities, and equity items that reflect the Insurance company’s financial position. Here are the main components:
Assets
- Cash and Cash Equivalents and Restricted Cash: Real estate companies, including Lennar, hold significant cash and cash equivalents to fund large-scale projects, manage debt, and respond to market opportunities. Lennar’s $6,273 million in cash as of November 2023 supports its homebuilding operations and strategic initiatives. Restricted cash of $13 million, on the other hand, refers to funds set aside for specific uses, such as customer deposits held in escrow or compliance with regulatory obligations. It also includes deposits related to loan originations and funds for performance obligations, ensuring that these resources are only used for designated purposes and not for general operations.
- Inventories: For real estate companies in general, inventories typically include land under development, finished homes, and construction in progress. These inventories are carried at cost, covering expenses such as land acquisition, development costs, construction materials, labor, real estate taxes, and capitalized interest during development. Inventories are critical for the timely delivery of homes and future revenue generation for real estate developers.
In Lennar Corporation’s case, as of November 30, 2023, its total inventory amounted to $18,352 million, comprising both land and homes in various stages of development and completion.
- Deposits and pre-acquisition costs on real estate: For real estate companies in general, deposits and pre-acquisition costs include funds committed for securing land purchase options, along with capitalized due diligence and development costs incurred prior to land acquisition. These deposits often come in the form of non-refundable cash or letters of credit, reducing the financial risk of holding land long-term until a company decides to proceed with development.
For Lennar Corporation, as of November 30, 2023, these deposits and pre-acquisition costs amounted to $2,002 million, reflecting the company’s strategy of securing land options without immediate full acquisition.
- Financial Services: For real estate companies, financial services assets generally include loans held for sale, investments in mortgage-backed securities, and other financial products offered through their financial services segment. These assets are linked to mortgage origination, title services, and insurance activities.
As of November 30, 2023, Lennar Corporation’s financial services assets amounted to $3,566 million, reflecting the company’s mortgage loans, investments, and other assets related to its financial services operations.
- Multifamily: For real estate companies, multifamily assets generally include properties developed and operated for rental income, such as apartment buildings or residential communities. These assets may also encompass construction in progress for such developments, as well as land and infrastructure intended for future multifamily projects.
As of November 30, 2023, Lennar Corporation reported $1,381 million in multifamily assets, which includes their investments in multifamily rental properties and ongoing construction projects.
Liabilities
- Homebuilding liabilities: Homebuilding liabilities for real estate companies typically consist of accounts payable related to materials, labour, and other operational expenses incurred during the construction of homes. They also encompass liabilities related to inventory not owned, such as land or homes under contract, and debts payable, including loans and senior notes.
As of November 30, 2023, the homebuilding liabilities reported by Lennar amounted to $9,727 million which comprises of $1,631 million in accounts payable, $2,540 million in liabilities associated with consolidated inventory not owned, and $2,816 million in senior notes and other payable debts.
- Financial Services Liabilities: For real estate companies, financial services liabilities typically include obligations related to loan origination, interest payable on loans, and reserves for potential losses on previously originated and sold loans. These liabilities also encompass debts incurred from financial services activities like mortgage services or title insurance operations.
In the case of Lennar Corporation, as of November 30, 2023, its financial services liabilities totalled $2,447 million, which includes loan origination liabilities and other debts related to its financial services operations.
- Multifamily Liabilities: In real estate companies, multifamily liabilities generally consist of long-term debt tied to the development, construction, and management of rental properties. These liabilities include mortgages, loans for property development, and obligations related to partnerships or joint ventures.
For Lennar Corporation, multifamily liabilities on their 2023 balance sheet amount to $278.2 million, covering debts and expenses related to their multifamily operations.
These items collectively provide a comprehensive picture of a real estate company’s financial health, liquidity, and operational stability.
WHAT IS INCLUDED IN THE CASH FLOW STATEMENT OF A REAL ESTATE COMPANY?
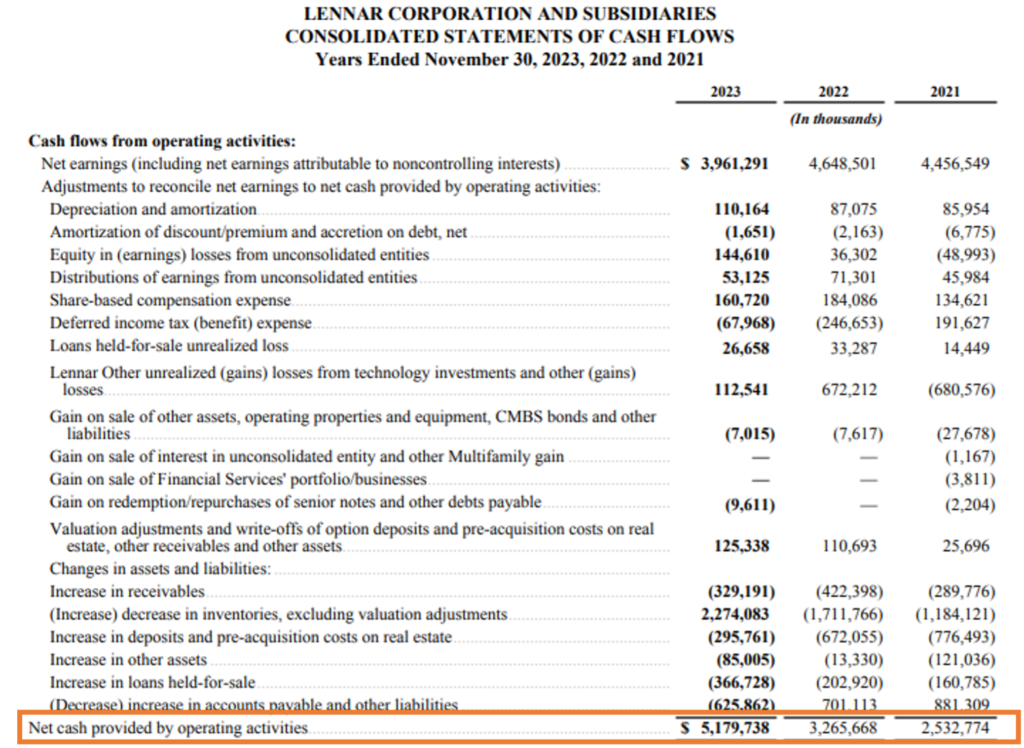
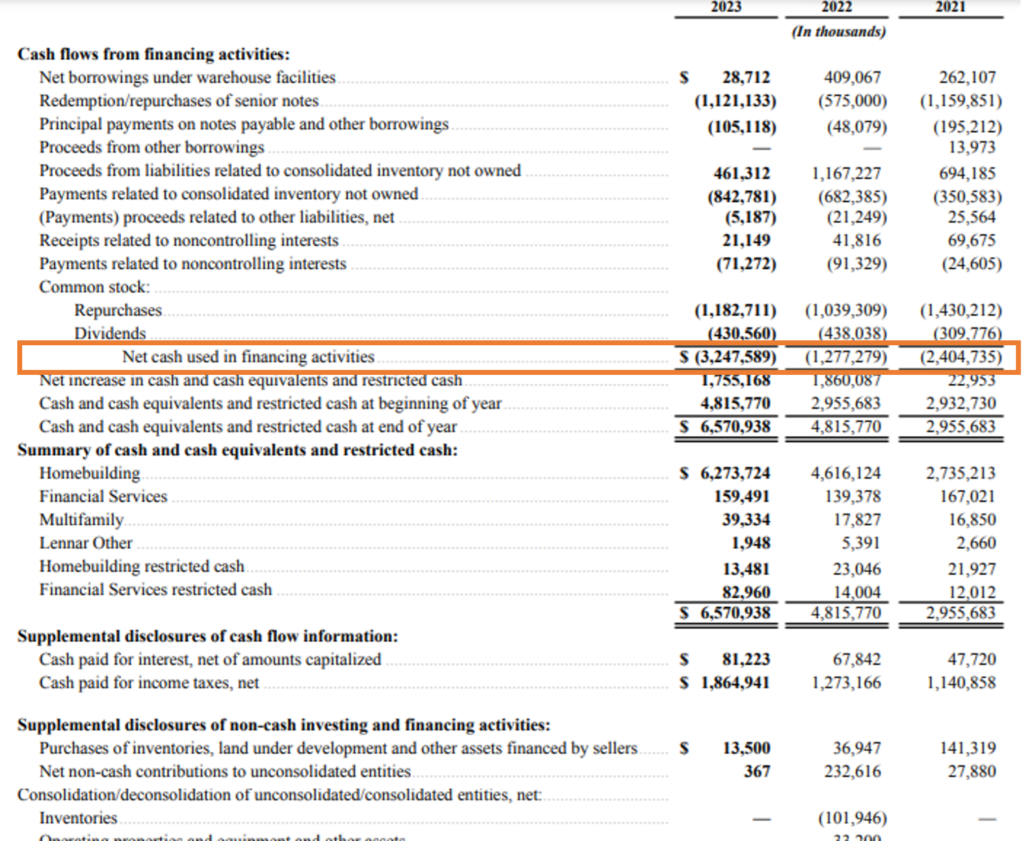
Below is the Consolidated Statement of Cash Flows.

Source: Annual Report https://investors.lennar.com/~/media/Files/L/Lennar-IR-V3/documents/annual-reports/2023-annual-report.pdf
In a real estate company’s cash flow statement, the key components typically include:
- Operating Activities: This details cash generated or used by core business operations, including receipts from property sales and payments for construction costs, taxes, and operational expenses. The cash flow from operating activities totalled $5,179 million for Lennar in the year 2023.
- Investing Activities: This includes cash transactions for acquiring or selling long-term assets, such as real estate, equipment, or investments in joint ventures. Lennar’s cash used in investing activities was $177 million in 2023, primarily due to contributions to unconsolidated entities.
- Financing Activities: This records cash movement related to financing the company, such as borrowing, repayment of debt, stock repurchases, and dividend payments. Lennar Corporation utilized $3,247 million in cash for financing activities in the year 2023, which encompassed debt repayments and stock buybacks.
KEY RATIOS FOR ANALYZING FINANCIAL STATEMENTS OF REAL ESTATE COMPANY
Key Ratios for analysing Financial Statements of Real Estate Companies:
| Ratio | Formula | Value (2023) |
| Homebuilding Gross Profit Margin | (Homebuilding Revenue – Homebuilding Costs) / Homebuilding Revenue × 100 | 23.48% |
| Return on Equity (ROE) | Net Income / Average Shareholders’ Equity | 14.82% |
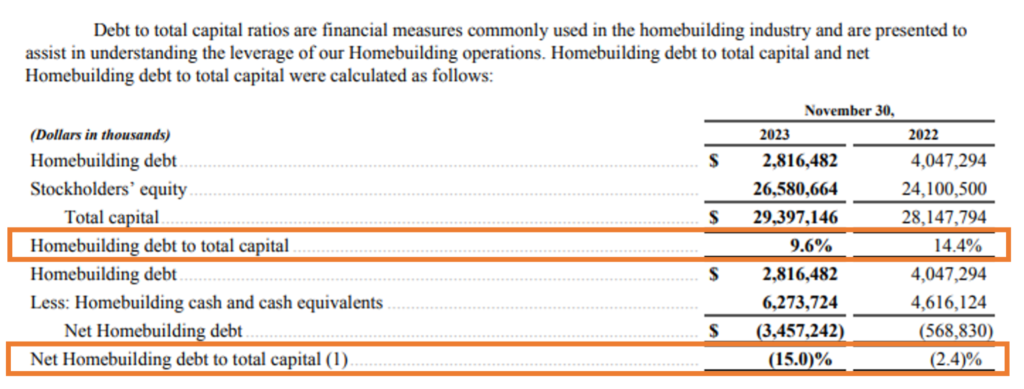
| Homebuilding Debt-to-Total Capital Ratio | Homebuilding Debt / (Homebuilding Debt + Shareholders’ Equity) × 100 | 9.60% |
| Homebuilding Net Debt-to-Total Capital Ratio | (Homebuilding Debt – Cash and Cash Equivalents) / (Homebuilding Debt + Shareholders’ Equity) × 100 | 15% |
- Homebuilding Gross Profit Margin: It assesses the profitability of the company’s primary homebuilding activities. It compares gross profit from homebuilding to revenue from homebuilding, indicating how efficiently a company manages construction and land costs. Lennar reported a gross profit margin of 23.48% (($32.66 bn-$24.99 bn)/$32.66bn*100), reflecting the efficiency of its homebuilding operations.
- Return on Equity (ROE): ROE measures the return generated on shareholders’ equity. It is required for calculating a company’s capacity to generate profits using investors’ capital. Lennar achieved an ROE of 14.82% ((Net Income/Average Shareholders Equity=$3.94 bn/$26.58 bn)), highlighting effective use of shareholder capital.
- Homebuilding Debt-to-Total Capital Ratio: This ratio indicates the amount of debt utilized in the company’s homebuilding operations relative to its total capital, which includes both debt and equity. This ratio evaluates a company’s financial leverage. Lennar’s ratio was 9.6% in 2023, a decline from 14.4% in 2022, signifying a reduction in debt and a rise in stockholders’ equity.
- Homebuilding Net debt-to-Total Capital Ratio: This ratio is a non-GAAP financial metric that evaluates the net homebuilding debt (homebuilding debt minus cash and cash equivalents) in relation to the total capital employed in the company’s homebuilding activities. This ratio helps in understanding the financial leverage employed specifically in the homebuilding segment after accounting for available cash, offering a clearer view of the company’s net debt position relative to its total capital.
Lennar Corporation in the year 2023 reported net homebuilding debt of $(3.46) billion, reflecting an excess of cash over debt, and the Net Homebuilding Debt-to-Total Capital Ratio stood at -15.0%, a decrease from -2.4% in 2022.
Source: Annual Report https://investors.lennar.com/~/media/Files/L/Lennar-IR-V3/documents/annual-reports/2023-annual-report.pdf
VARIOUS RISK FACED BY REAL ESTATE COMPANIES AND IMPACT ON THE FINANCIAL STATEMENTS
Lennar Corporation faces several risks outlined in their annual report. These include:
- Market and Economic Risks: Lennar is sensitive to fluctuations in the real estate market, interest rates, and consumer confidence. Changes in economic conditions, such as inflation, employment levels, and the availability of mortgage financing, could reduce demand for homes, impacting revenues and profitability.
- Operational Risks: Construction delays, labour shortages, and material cost increases are operational risks that Lennar faces. Additionally, challenges related to land acquisition, regulatory hurdles, and the management of subcontractors can further complicate homebuilding operations.
- Competition Risks: Lennar competes with numerous national, regional, and local homebuilders. Increased competition for land, skilled labour, and raw materials could increase costs and reduce market share. Competition in the mortgage and rental markets also affects its financial services and multifamily segments.
- Regulatory Risks: Lennar is subject to numerous local, state, and federal regulations regarding zoning, environmental laws, and building codes. Compliance with changing laws or the failure to secure necessary approvals can result in delays, increased costs, or penalties.
- Financial Risk: Lennar is exposed to risks related to fluctuating interest rates, which affect its borrowing costs and the affordability of homes for potential buyers. High levels of debt and potential inability to refinance on favourable terms can negatively impact liquidity. Additionally, inflation can drive up costs for materials, labour, and financing, affecting profitability.
- Risk Related to Planned Spin-Off: Lennar has planned a spin-off of certain business units, which carries risks of execution and potential disruption. The success of this spin-off depends on effectively managing operational, legal, and financial separation, and ensuring that the new entities perform well in the market. Failure to execute the spin-off properly could result in reduced profitability or operational inefficiencies.
- Risk Related to Ownership of Our Stock: Stockholders face risks related to volatility in Lennar’s stock price, influenced by market conditions, economic changes, and the company’s financial performance. Additionally, actions such as stock repurchases or dividends may be limited by government regulations or changes in tax laws, potentially affecting the stock’s attractiveness to investors.
REAL ESTATE COMPANY REGULATION
Lennar operates under a wide range of regulations enforced by various local, state, and federal agencies. These include zoning laws, construction permits, building design, and density requirements overseen by municipal and state planning commissions. Environmental regulations, administered by bodies such as the Environmental Protection Agency (EPA) and state environmental agencies, address water management, soil and air quality, and can impose significant compliance costs or limit development in sensitive areas. Labor regulations, enforced by agencies like the Department of Labor (DOL), may hold homebuilders accountable for subcontractor violations. Additionally, new growth restrictions, public infrastructure development fees, and requirements such as California’s rooftop solar panel mandates are governed by regional planning authorities and state energy commissions, including the California Energy Commission.

CONCLUSION
In conclusion, real estate financial statements serve as a crucial compass for investors, developers, and stakeholders navigating the complex landscape of property investments. By meticulously analysing income statements, balance sheets, and cash flow statements, one gains invaluable insights into a property’s performance, potential profitability, and overall financial health. These statements not only illuminate revenue streams and expenses but also highlight the impacts of regulatory frameworks and market conditions on investment viability. As the real estate market continues to evolve, mastering the intricacies of financial statements will empower stakeholders to make informed decisions, mitigate risks, and seize opportunities in an ever-changing environment. Ultimately, a robust understanding of these financial documents is essential for anyone looking to thrive in the dynamic world of real estate.


