
Introduction
Inventory in a business is not limited to stocks and goods, it symbolizes the flow of resources, supply and demand and a firm foundation of customer satisfaction. Inventory turnover ratio plays a pivotal role in maintaining smooth operations, meeting customers’ expectations and driving up profitability.
Among numerous tools used by managers for inventory management one key metric that encapsulates both the efficiency and effectiveness of inventory management practices is the Inventory Turnover Ratio.
What is Inventory Turnover Ratio?
Inventory Turnover also known as Sales Turnover, is a tool used to measure the business efficiency in inventory management. It measures how many times a business completely restocks its inventory in a given time. We calculate the inventory turnover ratio by dividing the Cost of Goods Sold with the Average Inventory.
Inventory Turnover Ratio = Cost of Goods Sold/ Average Inventory
The Cost of Goods Sold is the direct cost incurred by the business to produce the goods.
Average Inventory is the mean value of inventory maintained through a certain period. It is calculated as:
Average Inventory = (Opening Inventory + Closing Inventory)/ 2
The Inventory turnover ratio highlights numerous facts about a business, like inventory management, production turnaround, storage cost, demand of the product and profits.
Generally, a high inventory turnover ratio indicates efficient inventory management, less storage cost, high demand and high profits. But sometimes, high inventory turnover can also indicate that a business might be maintaining a small inventory which brings in negative factors like product shortage in the market and high transportation cost.
On the other hand, if a business is overstocked or has low sales this can result in a low inventory turnover ratio. Low inventory turnover shows that the business is holding goods for a long duration, which can later swell storage costs and hamper the profits of a business.
Investors use inventory turnover to determine the risk related to working capital, day to day management efficiency, demand & supple etc.
Real Life Example Inventory Turnover Ratio of Coca-Cola
Let’s calculate the inventory turnover ratio of Coca-Cola for the year ending 31 December’ 2022:
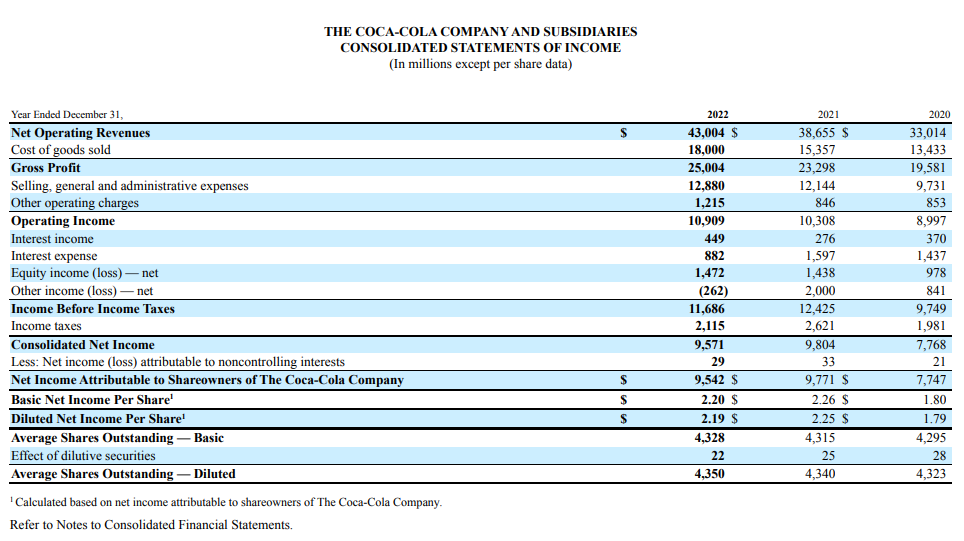
- Inventory Turnover Ratio = Cost of Goods Sold/ Average Inventory
| Cost of Goods Sold | = 18,000 |
- Average Inventory = (Opening Inventory + Closing Inventory)/ 2
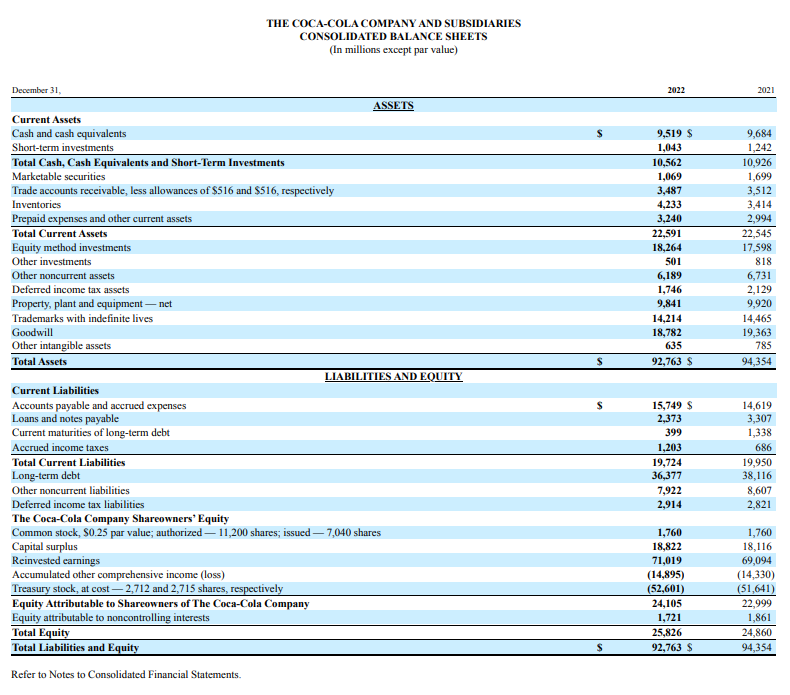
| Opening Inventory | = 3,414 |
| Closing Inventory | = 4,233 |
Calculation of Average Inventory:
| Average Inventory | = (Opening Inventory + Closing Inventory)/ 2 |
| = (3,414 + 4,233)/ 2 | |
| Average Inventory | = 3,823.5 |
Calculation of Inventory Turnover Ratio:
| Inventory Turnover | = COGS/ Average Inventory |
| = 18,000/ 3,823.5 | |
| Inventory Turnover | = 4.7 times. |
Inventory Turnover Ratio of Coca-Cola for the year 2022 is 4.7 times. This means that Coca-Cola restocked its full inventory approximately 4 to 5 times in 2022.
What is Turnover?
Turnover measures how fast a firm replaces an asset in a specified period. It is used to measure the operational efficiency of a business and how effectively it uses its resources.
The term turnover is commonly used to describe inventory and accounts receivable. It is also utilised in situations where an asset is transformed into cash or revenue.
Businesses track numerous asset turnover ratios in order to make strategic decisions, boost income, improve efficiency, reduce expenses, and make optimum use of available resources.
Relation of Inventory Turnover with Sales and Holding Costs
Inventory Turnover has a direct relation with sales generated by a business. High Inventory Turnover represents strong sales. As inventory turnover increases, goods outflow and restocking also increase. Similarly, if inventory turnover is low, sales of the business tend to be weak and restock ability of a business is also low.
Holding Cost is the cost to maintain inventory. It includes warehousing, labor costs etc. Holding Cost or storage cost has an inverse relationship with the inventory turnover ratio. If inventory turnover is high the holding cost of inventories tends to be low. This happens because of high sales which average the cost of storage.
And if the inventory turnover ratio is low, the holding cost tends to be high. Because of low sales averaging of storage costs does not happen.
Problems with Low Inventory Turnover Ratio
If a company has a poor inventory turnover ratio, it suggests two major issues. The first is that the company is buying or stocking more goods than necessary. This increases working capital in undesirable or excess goods while it also increases the holding expenses. This challenge can be overcome by conducting market surveys to analyze market demand and also by improving inventory management practices.
The second factor contributing to the company’s poor inventory turnover ratio is its low sales generating ability. Resulting, in reduced profit margins and overall corporate efficiency. This problem can potentially be resolved by conducting customer surveys to better understand their preferences, repositioning the product in the market, enhancing marketing techniques, or by innovating the product.
Day Sale Inventory (DSI)
The reciprocal of the inventory turnover ratio when computed in days is Day Sale Inventory. It measures on average how many days are required to clear the inventory through selling.
Day Sale Inventory = (Average Inventory/ Cost of Goods Sold) * 365
Day Sale Inventory provides a more realistic lookout towards inventory clearance than compared to inventory turnover ratio.
As we have seen, the higher the inventory turnover, the better, but in the case of Day Sale Inventory, the lower the day sale inventory, the better. If the Day Sale Inventory is low, it means it takes fewer days to turn inventory into sales. And if DSI is high, that means the business takes more time to turn inventory into sales.
Day Sale Inventory of Coca-Cola
| Day Sale Inventory | = (Average Inventory/ Cost of Goods Sold) * 365 |
| = (3,823.5/ 18,000) * 365 | |
| Day Sale Inventory | = 77 days |
Hence, Day Sale Inventory of Coca-Cola is 77 days, it represents that coca-coal needs 77 days to turn its stock into revenue.
Comparative Analysis of Inventory Turnover Ratio of Coca-Cola and Pepsi Co. for year ending December 31’ 2022
Source: https://stocklight.com/stocks/us/nasdaq-pep/pepsico/annual-reports/nasdaq-pep-2023-10K-23600333.pdf
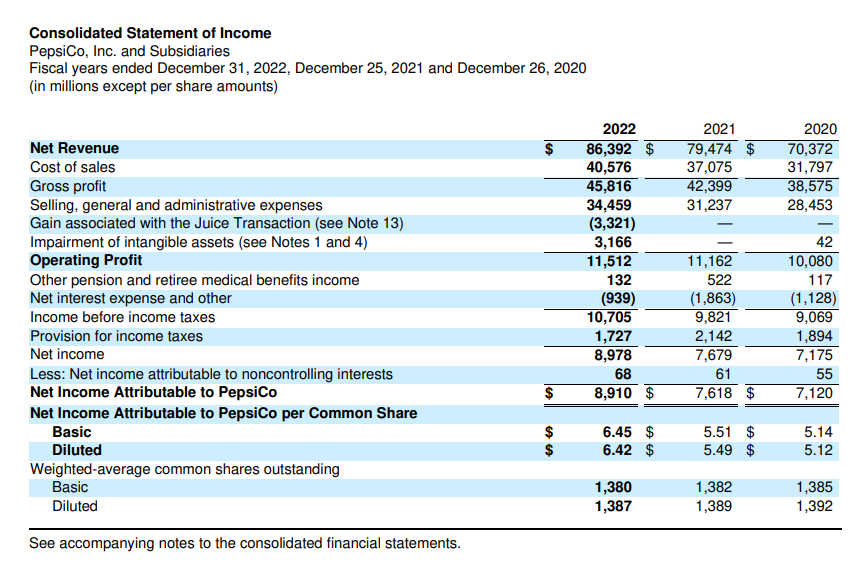
Inventory Turnover of Pepsi-Co for 2022
| Cost of Goods Sold | = 40,576 |
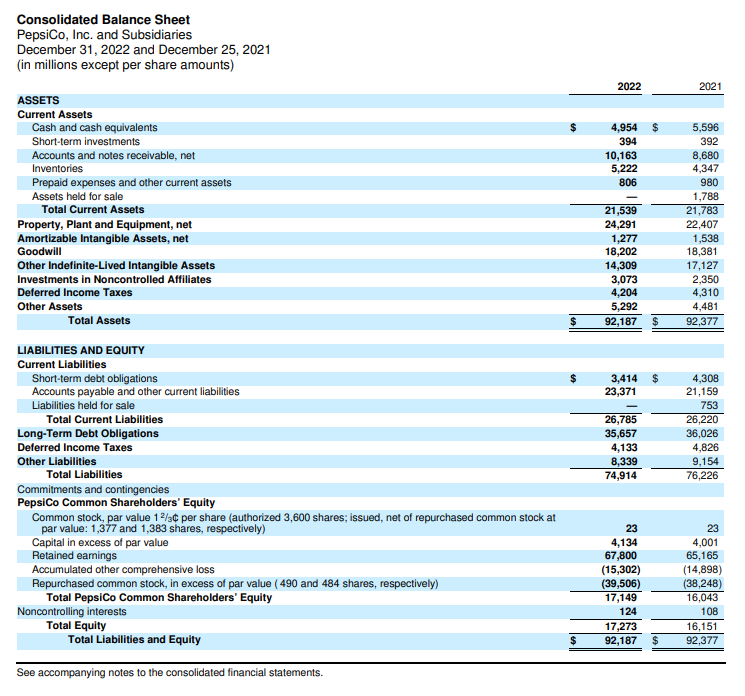
| Opening Inventory | = 4,347 |
| Closing Inventory | = 5,222 |
Calculation of Average Inventory
| Average Inventory | = (Opening Inventory + Closing Inventory)/ 2 |
| = (4,347 + 5,222)/ 2 | |
| Average Inventory | = 4,784.5 |
Calculation of Inventory Turnover Ratio:
| Inventory Turnover | = COGS/ Average Inventory |
| = 40,576/ 4,784.5 | |
| Inventory Turnover | = 8.4 times. |
- Inventory Turnover of Coca-Cola = 4.7 times.
- Inventory Turnover of Pepsi Co. = 8.4 times.
So, with these figures we can say that Pepsi Co turnover its inventory approximately twice as fast when compared to Coca Cola. In other words, Pepsi Co is doing a better job of quickly converting its inventory into sales than Coca Cola. As such, Pepsi Co would require less working capital loans to maintain the inventory levels as compared to Coca Cola.
Conclusion
To summarise, inventory management is a vital part of business operations that affects supply chain efficiency, customer satisfaction, and total profitability. The Inventory Turnover Ratio is an essential indicator for assessing inventory management success since it shows how rapidly a company restocks its inventory in comparison to sales. A high turnover ratio usually indicates strong sales and efficient inventory management, whereas a low ratio can imply overstocking or low sales, resulting in higher holding costs and lower profitability.
Additionally, the concept of Day Sale Inventory provides a practical measure of inventory clearance, emphasizing the importance of minimizing the time it takes to convert inventory into sales.
Ultimately, businesses must work hard to balance inventory levels, sales performance, and operational efficiency to optimize financial performance and maintain a competitive edge in the market.

