
INTRODUCTION
Research and Development (R&D) expenses are crucial investments for companies aiming to innovate and stay competitive in their industries. These expenses cover a wide range of activities aimed at developing new products, improving existing ones, and discovering new knowledge that can lead to better business practices. This article explores the various facets of R&D expenses, types of R&D expenses, industries with the highest R&D cost, their importance, impact on financial analysis, and how it is interpreted by the analyst, challenges of high R&D cost, how they are accounted for and its impact on the financial statements.
DEFINITION OF R&D EXPENSE
R&D expenses encompass all costs associated with the research and development of a company’s products or services. These costs typically include:
- Personnel Costs: Salaries, wages, and benefits for employees directly involved in R&D activities.
- Materials and Supplies: Costs of raw materials and supplies used in R&D projects.
- Overhead Costs: Indirect costs such as utilities, rent, and depreciation of equipment used in R&D.
- Contract Services: Payments to third-party contractors or consultants for R&D services.
- Software and Technology: Expenditures for specialized software and technology utilized in research and development activities
INDUSTRIES WITH HIGHEST R&D EXPENSES WITH EXAMPLES
Industries with the highest R&D costs are typically those that are highly innovation-driven and require significant investments in technology and product development. The most notable industries include:
1. Pharmaceuticals and Biotechnology
- Nature of R&D: Drug discovery, clinical trials, and regulatory approvals.
- R&D Intensity: Extremely high due to the long development cycles, high failure rates, and stringent regulatory requirements.
- Impact: New drug development and biotechnological advancements.
- Examples: Pfizer, Roche, Merck & Co.
2. Technology and Software
- Nature of R&D: Development of new software, hardware, and IT services.
- R&D Intensity: High, as companies continuously innovate to keep up with rapid technological changes and consumer demands.
- Impact: Advances in software, cybersecurity, AI, and consumer electronics.
- Examples: Apple, Alphabet(Google), Nvidia
3. Automotive
- Nature of R&D: Development of new vehicle models, electric vehicles (EVs), autonomous driving technologies, and safety features.
- R&D Intensity: High, driven by the need for innovation in efficiency, safety, and environmental standards.
- Impact: Development of electric vehicles (EVs), autonomous cars, and advanced driver-assistance systems (ADAS).
- Examples: Tesla, Toyota, Volkswagen
4. Telecommunications
- Nature of R&D: Development of new communication technologies, infrastructure, and devices.
- R&D Intensity: High, with a focus on enhancing connectivity, data transmission, and network security.
- Impact: Advances in 5G technology, network equipment, and consumer communication devices.
- Examples: Huawei, AT&T Inc., Verizon Communication, Qualcomm Incorporated
5. Aerospace and Defence
- Nature of R&D: Development of new aircraft, defense systems, and space exploration technologies.
- R&D Intensity: High due to the complexity, safety standards, and cutting-edge technologies involved.
- Impact: Innovations in military defense, commercial aviation, and space travel.
- Examples: Boeing, Lockheed Martin, Airbus
6. Electronics and Semiconductors
- Nature of R&D: Development of new electronic components, semiconductors, and consumer electronics.
- R&D Intensity: High, driven by the need for miniaturization, increased performance, and energy efficiency.
- Impact: Progress in semiconductor technology, consumer electronics, and industrial electronics.
- Examples: Intel Corporation, Samsung Electronics Ltd, Taiwan Semiconductor Manufacturing Company
7. Chemical
- Nature of R&D: Development of new chemicals, materials, and industrial processes.
- R&D Intensity: High, with a focus on creating more efficient, sustainable, and innovative chemical products.
- Impact: Development of advanced materials, specialty chemicals, and environmentally friendly processes.
- Examples: BASF SE, Dow Inc., DuPont de Nemours Inc.
8. Medical Devices
- Nature of R&D: Development of new medical instruments, diagnostic equipment, and healthcare technologies.
- R&D Intensity: High due to the need for innovation in medical treatments, diagnostics, and regulatory compliance.
- Impact: Introduction of advanced medical devices, diagnostic tools, and healthcare solutions.
- Examples: Medtronic plc, Johnson & Johnson (J&J) – Medical Devices Segment, Siemens Healthineers AG
ACCOUNTING FOR R&D UNDER US GAAP AND IFRS
US GAAP
Under U.S. GAAP, the accounting for R&D expenses is governed by the Financial Accounting Standards Board (FASB) Accounting Standards Codification (ASC) Topic 730, Research and Development.
Key Principles
1. Expense Recognition
Typically, all R&D expenditures are recognized as expenses when incurred. This includes salaries, materials, overhead, and contract services related to R&D activities.
Costs associated with software development intended for sale are treated under ASC 985-20, where costs incurred before technological feasibility is established are expensed. Costs incurred after achieving technological feasibility but before the product is ready for sale can be capitalized.
2. Capitalization
Under ASC 730, there is limited scope for the capitalization of R&D costs. Most R&D expenses must be expensed as they are incurred, reflecting the uncertainty and risk associated with R&D activities.
3. Disclosure Requirements
Companies are required to disclose the total R&D expenses incurred during the reporting period.
Additional disclosures may include a description of the nature of R&D activities and any capitalized software development costs.
IFRS
Under IFRS, the treatment of R&D expenses is primarily governed by the International Accounting Standard (IAS) 38, Intangible Assets.
Key Principles
1. Expense Recognition
Research costs are expensed as incurred. These costs are defined as activities aimed at obtaining new knowledge without specific commercial objectives.
However, development costs can be capitalized if specific criteria are satisfied.
2. Capitalization
Development costs are capitalized when they meet specific criteria outlined in IAS 38. These criteria include:
- Technical feasibility of completing the intangible asset.
- Intention to complete and use or sell the asset.
- Capability to utilize or sell the asset effectively.
- Expected mechanisms through which the intangible asset will likely yield future economic benefits.
- Availability of sufficient technical, financial, and other resources to complete the development.
- Ability to reliably measure the expenditure attributable to the intangible asset during its development.
- If these criteria are not met, development costs must be expensed as incurred.
3. Disclosure Requirements
Companies must disclose the total amount of research and development expenditure recognized as an expense during the period.
For capitalized development costs, companies must disclose the amortization methods used, useful lives, and other relevant details.
IMPACT OF R&D COST ON FINANCIAL STATEMENTS
1. Income Statement
- R&D costs appear as an operating expense, reducing the operating profit and net income for the period in which they are incurred.
- High R&D expenses can lead to lower short-term profitability but may signal the potential for long-term growth.
Let us have a look at how two of the most prominent companies in the pharmaceutical industry and the Information Technology industry present R&D costs in their Income Statements.
Pharmaceutical Company: Merck & Co. Inc
From the Consolidated Income Statement of Merck & Co. Inc., we can see that the total research and development cost incurred by the company in fiscal year 2023 is $30,531 million, and in 2022 is $13,548 million.
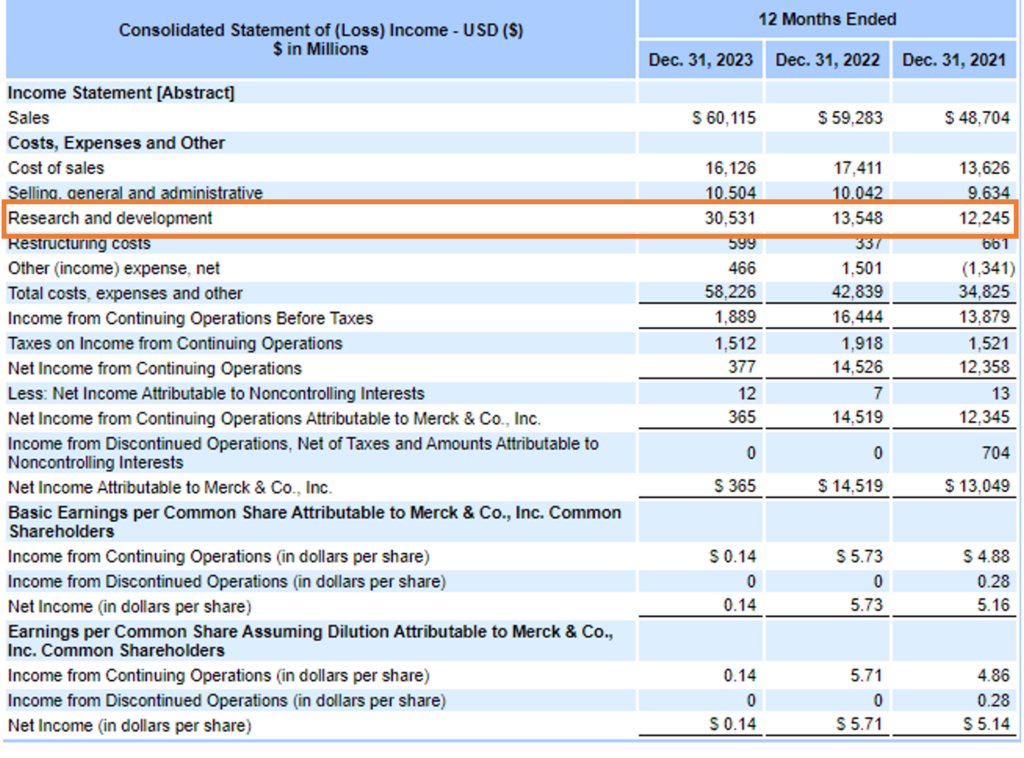
Source: Annual Report https://d18rn0p25nwr6d.cloudfront.net/CIK-0000064978/2065f989-47ab-490b-9f8e-bade50021608.html#
Technology Company: NVIDIA Corporation
From the Consolidated Income Statement of NVIDIA Corporation, we can see that the total research and development cost incurred by the company in the fiscal year 2023 is $ 7.3 billion and in 2022 is $ 5.3 billion.
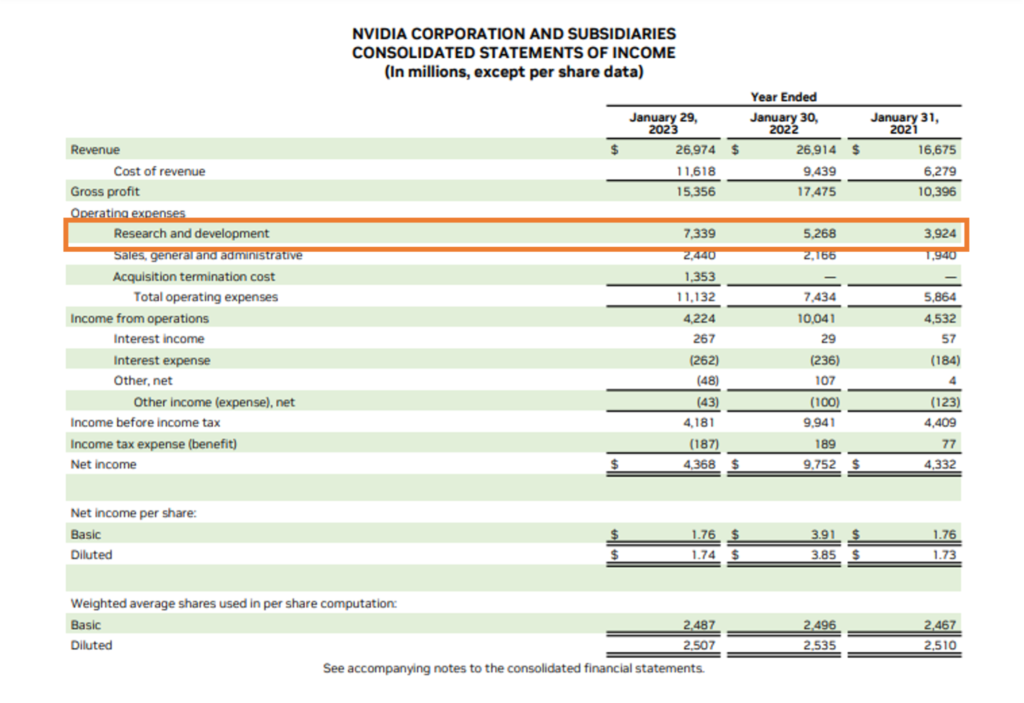
Source: Annual Report https://s201.q4cdn.com/141608511/files/doc_financials/2023/ar/2023-Annual-Report-1.pdf
2. Balance Sheet
- If development costs are capitalized, they are recorded as intangible assets on the balance sheet.
- The amortization of these capitalized costs affects future periods’ earnings, spreading the expense over the asset’s useful life.
3. Cash Flow Statement
- R&D costs are included in operating activities in the cash flow statement, impacting the cash flow from operations.
- Capitalized development costs appear as investing activities, reflecting
- cash outflows for the acquisition of intangible assets.
IMPACT OF R&D COSTS ON KEY FINANCIAL METRICS
1. Profitability Ratios
- Gross Profit Margin: High R&D costs can reduce the gross profit margin in the short term but may lead to higher margins in the future if the investments result in successful products.
- Operating Profit Margin: R&D expenses are typically included in operating expenses, affecting the operating profit margin. A higher R&D expense can lower the margin initially, but successful innovation can improve profitability over time.
2. Return Ratios
- Return on Assets (ROA): Significant R&D investments can lower ROA in the short term as these costs are expensed immediately. However, successful R&D projects can enhance asset utilization and improve ROA in the long run.
- Return on Equity (ROE): R&D costs can impact ROE by affecting net income. While high R&D spending may decrease ROE initially, the long-term returns from successful innovations can enhance shareholder value.
3. Cash Flow Analysis
- Operating Cash Flow: Research and development (R&D) expenditures typically decrease short-term operating cash flow. Analysts assess the adequacy of cash flows to support ongoing R&D investments.
- Free Cash Flow: High R&D spending can impact free cash flow, which is crucial for evaluating a company’s ability to fund future projects, pay dividends, and meet other obligations.
HOW ANALYSTS INTERPRET R&D COSTS
1. Comparative Analysis
- Analysts compare R&D spending with industry peers to evaluate a company’s relative investment in innovation.
- Higher-than-average R&D expenses may indicate a more aggressive innovation strategy, while lower-than-average spending could signal a potential risk of falling behind competitors.
2. Trend Analysis
- Examining trends in R&D spending over time helps analysts understand a company’s strategic focus and commitment to innovation.
- Consistent or increasing R&D investment is generally viewed positively, suggesting a long-term growth strategy.
3. Efficiency Metrics
- Analysts use metrics like R&D intensity (where R&D expenditures are expressed as a percentage of sales) to evaluate the effectiveness of R&D investments.
Merck & Co. Inc. calculate the R&D cost as a percentage of sales for the fiscal years 2023 and 2022 as follows from the above income statement.
| Particulars | 2023 | 2022 |
| Sales | 60,115 | 59,283 |
| Research and Development Cost (R&D Cost) | 30,531 | 13,548 |
| R&D cost as % of Sales | 51% | 23% |
We can note that in the year 2022, the R&D cost is 23% of the Sales while in the year 2023, it almost rose to 50%. As the company mentions below in 2023, R&D expenses rose to $30.5 billion from $13.5 billion in 2022, driven by significant business development activities including acquisitions and collaborations, as well as increased spending on new programs and higher employee costs. This increase was slightly offset by reduced intangible asset impairment charges.
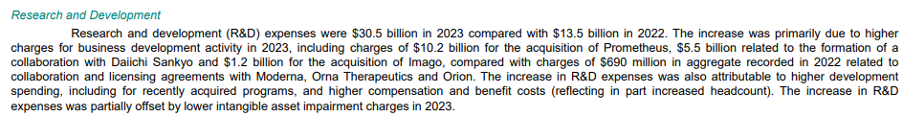
Source: Annual Report https://s21.q4cdn.com/488056881/files/doc_financials/2023/q4/4abbf601-f36f-4016-ae6f-a07650f3b571.pdf
NVIDIA Corporation calculates the R&D cost as a percentage of sales for the fiscal years 2023 and 2022 as follows from the above income statement.
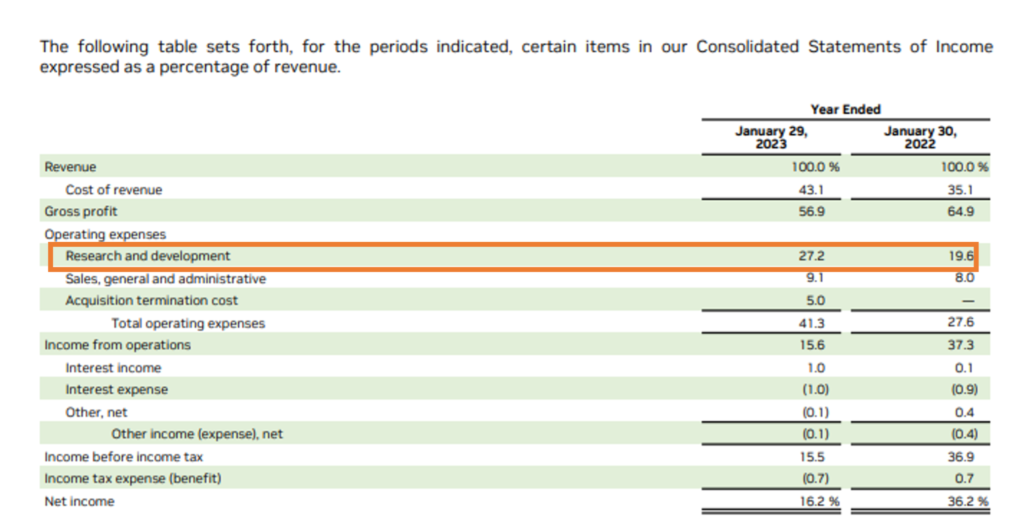
Source: Annual Report https://s201.q4cdn.com/141608511/files/doc_financials/2023/ar/2023-Annual-Report-1.pdf
The ratio is 27.2% for 2023 and 19.6% for 2022. The ratio has increased from 2022 to 2023. In 2023, NVIDIA’s rise in R&D expenses as a percentage of sales can be attributed to several factors. The increase in research and development expenses for the fiscal year 2023 was primarily driven by increased compensation, employee growth, engineering development costs, and data center infrastructure. Primarily, the company increased its overall investment in new technologies, such as AI, data centers, and automotive platforms, which led to a significant uptick in R&D costs. Despite a slight revenue increase, the substantial growth in R&D expenditures resulted in a larger proportion of sales being dedicated to research and development. This strategic approach underscores NVIDIA’s dedication to innovation and sustaining its competitive advantage in dynamic technology sectors.
- Evaluating the return on R&D investment involves looking at the outcomes of R&D efforts, such as new product launches, patents filed, and revenue generated from new products.
4. Impact on Valuation Models
- R&D costs are factored into valuation models, such as financial ratios & discounted cash flow (DCF) analysis, to project future cash flows and earnings.
- The potential future benefits of R&D investments are considered when estimating the company’s intrinsic value.
IMPORTANCE OF R&D COSTS IN FINANCIAL ANALYSIS
Some of the importance of R&D Costs in Financial Analysis are as follows:
1. Indicator of Innovation Capability
- R&D expenses are a direct measure of a company’s investment in innovation and new product development.
- High R&D spending can indicate a strong pipeline of future products and technologies, enhancing the company’s growth potential.
2. Competitive Advantage
- Companies with substantial R&D investments are often better positioned to maintain and enhance their market position.
- R&D efforts can lead to unique products, technological advancements, and improved processes, providing a competitive edge.
3. Long-term Growth Potential
- R&D spending is a signal of a company’s commitment to long-term growth and sustainability.
- Analysts look at R&D expenses to assess whether a company is investing adequately in future growth opportunities.
CONCLUSION
R&D costs are a vital element of financial reporting, offering insights into a company’s innovation efforts and long-term growth potential. Proper accounting and disclosure of these costs enable stakeholders to make informed decisions, assess the company’s strategic direction, and evaluate its financial health. Understanding the relevance of R&D costs in financial reporting helps companies maintain transparency, attract investment, and drive sustainable innovation.

