
In the dynamic realm of finance, assessing a company’s intrinsic value is as much an art as it is a science. While discounted cash flow (DCF) models and other intrinsic valuation methods often dominate the conversation, many investors and analysts rely on a simpler, often more practical approach: Relative Valuation using Multiples.
THE ESSENCE OF RELATIVE VALUATION MULTIPLES
At its core, relative multiples-based valuation hinges on comparing a company’s valuation metrics to those of its peers or the broader market. Imagine trying to determine the value of a house by clubbing the price of cement and other raw materials used in the construction, labor cost, and other miscellaneous expenses. Rather than determining the value of the house by clubbing individual expenses, you might simply compare the house with similar houses in the neighborhood with similar square feet. If the house next door sold for $500,000, you might reasonably conclude that your home, which is nearly identical, should be valued similarly.
This is the logic behind relative multiples. Instead of delving into the nitty-gritty details of a company’s financial future, investors look at how the market is valuing comparable companies. Common multiples include the Price-to-Earnings PE ratio, Enterprise Value-to-EBITDA (EV/EBITDA), and Price-to-Sales (P/S) ratio.
Take Tesla, Inc., an automobile company for example that’s both a darling and a disruptor in the stock market. Suppose an investor is trying to determine whether Tesla is higher or lower compared to its competitors. By using the P/E ratio, they can compare Tesla’s valuation to that of other automakers like General Motors and Ford Motor Company.
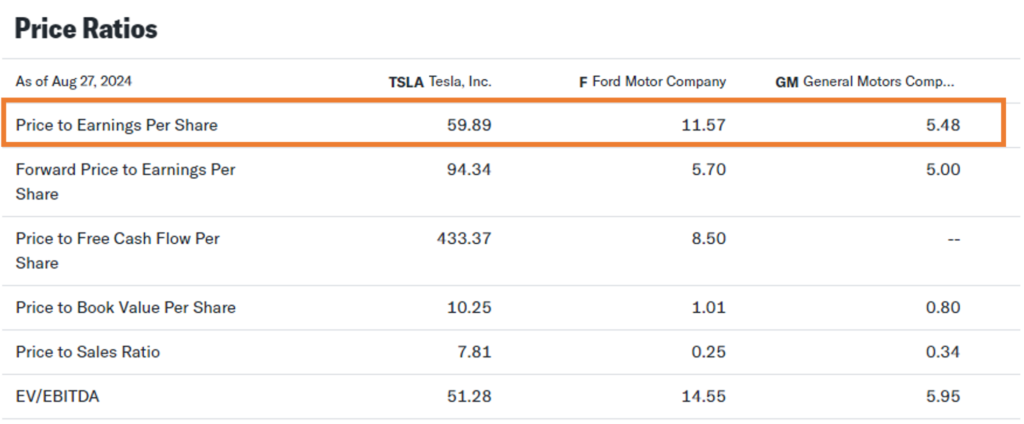
Source: https://finance.yahoo.com/compare/TSLA?comps=F,GM
We can see that Tesla’s P/E ratio is significantly higher than its competitors. At first glance, this might suggest Tesla is valued higher. However, if the investor believes that Tesla’s growth prospects, brand strength, and technological edge justify this premium, they might still consider Tesla a buy. The relative multiple in this case provides context, highlighting the market’s current expectations and helping the investor decide whether these expectations are reasonable.
THE TWO PILLARS OF RELATIVE VALUATION MULTIPLES: EQUITY MULTIPLES AND ENTERPRISE VALUE MULTIPLES
When it comes to valuing companies, grasping valuation multiples serves as a compass in the expansive world of finance. There are two primary types of these multiples: Equity Multiples and Enterprise Value Multiples. Each provides a distinct perspective on a company’s value, and together, they create a complete picture.
Equity Multiples: A Focus on Shareholder Value
Equity multiples are all about what the shareholders get. These multiples are based on the equity value, which is essentially the market value of a company’s shares. The most common equity multiples are explained below with the help of the following example of Technology company giants like Apple Inc. with its competitor companies like Microsoft Corporation and Alphabet Inc.:
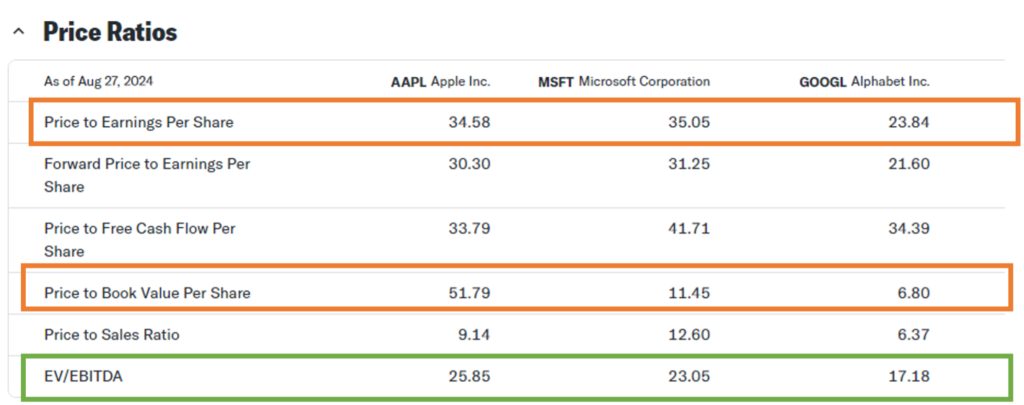
Source: https://finance.yahoo.com/compare/AAPL?comps=MSFT,GOOGL
- Price-to-Earnings (P/E) Ratio: The P/E ratio is one of the most widely recognized equity multiples. It is determined by dividing the market price per share by the earnings per share (EPS). This ratio shows how much investors are willing to pay for each dollar of a company’s earnings. A higher P/E ratio might reflect optimism about future growth, whereas a lower P/E could imply that the stock is valued lower or that the company is encountering difficulties. For example, we can see above that the P/E ratio for Apple Inc. is 34.58 which means that investors are willing to pay $34.58 for every $1 of earnings generated by the company. The P/E ratio of Apple Inc. is similar to that of Microsoft. However, the P/E ratio of Alphabet Inc. is the lowest showing the stock is valued lower as compared to Apple and Microsoft.
- Price-to-Book (P/B) Ratio: The P/B ratio compares a company’s market value to its book value (the value of its assets minus liabilities). It’s determined by dividing the market price per share by the book value per share. This multiple is particularly useful for valuing companies with significant tangible assets, like banks or manufacturing firms. A high P/B ratio suggests that investors are willing to pay a premium above the company’s net assets, often due to expectations of strong growth or valuable intangible assets. A low P/B ratio may indicate the company is valued lower relative to its assets, but it could also signal potential financial distress or market pessimism. In the example given, Apple’s P/B ratio is 51.79, indicating that the market values the company at 51.79 times its book value, which represents the value of its net assets listed on the balance sheet. This ratio is much higher than the other two competitor companies above.
- Price-to-Sales (P/S) Ratio: The P/S ratio measures how a company’s market value relates to its total sales or revenues. It’s calculated by dividing the market price per share by the sales per share. A high P/S ratio suggests strong investor expectations for future growth or a premium valuation relative to sales. A low P/S ratio indicates the stock may be valued lower compared to its sales or that the company faces challenges or low growth prospects. In the above example, the price-to-sales ratio for Apple Inc. is 9.14 which means that investors are willing to pay $9.14 for every $1 of the company’s sales. Of the three companies listed above, Microsoft has the highest P/S ratio.
Enterprise Value Multiples: A Broader Perspective
Enterprise value (EV) multiples, in contrast, offer a more comprehensive perspective. These multiples consider the total value of a company, including both debt and equity. One of the most widely used EV multiples is the Enterprise Value-to-EBITDA (EV/EBITDA) ratio. This ratio compares the total value of a company (including debt) to its operating cash flow. This multiple is popular because it strips out the effects of capital structure and non-cash expenses, offering a clear view of a company’s operational efficiency. A high EV/EBITDA ratio suggests that investors are willing to pay a premium for the company’s earnings before interest, taxes, depreciation, and amortization, often due to high growth expectations or perceived strong performance. A low EV/EBITDA ratio suggests that the company could be valued lower based on its earnings as it might be dealing with financial or operational issues.
Let’s understand this multiple with the help of the above example. Apple Inc. has an EV/EBITDA ratio of 25.85 which means that investors are willing to pay 25.85 times the company’s earnings before interest, taxes, depreciation, and amortization to acquire the company. This multiple for Apple Inc. and Microsoft is similar and lowest for Alphabet.
VARIOUS USES OF RELATIVE VALUATION MULTIPLES
Relative multiples can be used for performing Comparable Company Analysis (“Comps”), valuation of companies, and Precedent Transaction Analysis (“Precedents”). Let’s understand all three uses one by one.
1. Comparable Company Analysis (“Comps”): The Peer Benchmark
Comparable Company Analysis, commonly known as “Comps,” involves evaluating a company by comparing it to similar companies in its industry. It’s akin to assessing the value of your home by looking at the prices of comparable homes in your area. By examining the valuation multiples of similar companies, you can estimate what your company—or the one you’re interested in—is worth.
For example, let’s say you’re evaluating a technology company like Microsoft. You would look at other tech giants like Apple, Google, and Amazon to see how they’re valued based on their P/E ratios, EV/EBITDA, or other relevant multiples. If Microsoft’s multiples are in line with or below those of its peers, it might indicate that the company is fairly valued or potentially valued lower.
Comps are particularly useful because they reflect current market conditions and investor sentiment. They provide a snapshot of how the market values companies with similar characteristics, making it easier to assess whether a stock is valued higher or lower than its peers.
The example explained above for Apple Inc. with Microsoft and Alphabet is an example of Comps.
2. Valuation of unlisted companies
Determining the market value of an unlisted company can be a formidable challenge, but relative valuation offers a practical solution by leveraging the financial metrics of comparable listed companies. Imagine assessing the worth of a burgeoning retail firm without a stock market listing. By examining the average Price-to-Earnings (P/E) Ratio, Price-to-Sales (P/S) Ratio, and Enterprise Value-to-EBITDA (EV/EBITDA) Ratio of established public retailers, you can estimate the value of the unlisted firm with surprising accuracy. For instance, if the average P/E ratio of similar listed companies is 20x, and your unlisted company’s net income is $8 million, applying this multiple suggests a valuation of $160 million. Meanwhile, using the average P/S ratio of 2.77x on $100 million in revenue might push the value up to $277 million, and the EV/EBITDA approach could land somewhere around $180 million. This comparative method not only provides a range of possible values but also contextualizes the unlisted company’s worth within its industry landscape, making it an indispensable tool for investors and analysts.
For example, we want to find the market value of an unlisted retail company X. Using the relative multiples of three similar listed retail companies we can find the market value of company X as below.
| Name of Listed Retail Company | P/E Ratio | P/S Ratio | EV/EBITDA Ratio |
| Company A | 20x | 2.5x | 12x |
| Company B | 18x | 2.8x | 10x |
| Company C | 22x | 3.0x | 14x |
| Average | 20x | 2.77x | 12x |
| Unlisted Company | Revenue | EBITDA | Net Income |
| Company X | $100 million | $15 million | $8 million |
| Valuation Method | Value Calculation | Estimated Value |
| P/E Ratio | Net Income × Average P/E Ratio | $8 million × 20 = $160 million |
| P/S Ratio | Revenue × Average P/S Ratio | $100 million × 2.77 = $277 million |
| EV/EBITDA Ratio | EBITDA × Average EV/EBITDA Ratio | $15 million × 12 = $180 million |
We can then average these values or consider the most relevant one based on industry standards and the unlisted company’s specifics. In this example, we might conclude an approximate market value range of $160 million to $277 million for the unlisted company, adjusting based on qualitative factors and further financial details.
3. Precedent Transaction Analysis (“Precedents”): Learning from the Past
Precedent Transaction Analysis, or “Precedents,” takes a different approach. Instead of comparing a company to its current peers, this method looks at past transactions involving similar companies. It’s similar to estimating your home’s value by examining the sale prices of recently sold properties in your neighborhood.
Imagine you’re assessing the potential acquisition of a retail company. You would look at previous deals in the retail sector, such as Amazon’s acquisition of Whole Foods or Walmart’s purchase of Jet.com. By analyzing the multiples paid in these transactions, such as EV/Sales or EV/EBITDA, you can estimate what a similar company might be worth today in an acquisition scenario.
Precedents are particularly valuable in M&A (mergers and acquisitions) because they reflect what real buyers have been willing to pay in similar situations. They provide context for what could be considered a fair price based on actual market behavior, rather than just theoretical comparisons.
Let’s understand this with the help of the following example.
Imagine we are evaluating the acquisition of a retail company named Retail Express and want to determine its fair market value. Instead of relying solely on current industry peers, we turn to Precedent Transaction Analysis to gain insights from past transactions involving similar companies.
You start by examining recent high-profile transactions in the retail sector:
| Transaction | Company | Purchase Price | Revenue | EBITDA | EV/Revenue Multiple | EV/EBITDA Multiple |
| Amazon/Whole Foods | Whole Foods | $13.7 billion | $16 billion | $1.2 billion | 0.856 | 11.42 |
| Walmart/Jet.com | Jet.com | $3.3 billion | $1 billion | $50 million | 3.3 | 66 |
From these transactions, we calculate the multiples as follows:
Average EV/Revenue= (0.856+3.3)/2= 2.078
Average EV/EBITDA= (11.42+66)/2= 38.71
Assume Retail Express has the following financials:
| Company | Revenue | EBITDA |
| Retail Express | $500 million | $40 million |
Using the averages, we can estimate Retail Express’s value as follows:
| Valuation Method | Calculation | Estimated Value |
| EV/Revenue | $500 million × 2.078 | $1.039 billion |
| EV/EBITDA | $40 million × 38.71 | $1.548 billion |
In this analysis, the valuation range for Retail Express would be approximately $1.04 billion to $1.55 billion. This method provides valuable context by reflecting what buyers have historically paid in similar transactions, offering a grounded perspective on what might be considered a fair acquisition price for Retail Express today.
INTRINSIC VALUE VS. RELATIVE VALUATION MODELS
Navigating the world of investment valuation often involves balancing two powerful approaches: intrinsic value and relative valuation models. Intrinsic value seeks to uncover a company’s true worth by delving deep into its fundamentals—projecting future cash flows and discounting them to their present value. This method, akin to peering through a company’s financial core, offers a comprehensive picture of its potential. In contrast, relative valuation models provide a comparative lens, placing the company’s valuation alongside its peers by analyzing metrics like P/E ratios or EV/EBITDA. This approach is more about spotting opportunities within the market’s current landscape, akin to finding a gem in a field of stones. While intrinsic value unveils the underlying potential, relative valuation reveals how a company stands in the competitive arena, making both essential tools for savvy investors seeking to navigate the complexities of market dynamics.
WHAT ARE THE ASSUMPTIONS OF RELATIVE VALUATION MODELS?
Relative valuation models, like comparing apples to apples, rely on a few key assumptions to ensure accuracy:
- Market Efficiency: The model assumes that the market prices of comparable companies reflect all available information, making them fairly valued.
- Comparable Entities: The assumption is that the companies being analyzed are genuinely alike—operating in the same industry with similar business models and growth potential.
- Consistent Accounting: The companies should follow similar accounting practices to ensure that financial comparisons are meaningful.
- Similar Growth and Risk: The model assumes that the companies have comparable growth rates and risk profiles, so any differences in valuation are due to market mispricing, not fundamental differences.
- No Unique Situations: Companies shouldn’t be in unusual situations, like undergoing a major restructuring, which could distort their financials.
When these assumptions hold, relative valuation becomes a powerful tool for spotting whether a company is a bargain or overpriced compared to its peers.
PROS AND CONS OF RELATIVE VALUATION MODELS
| Pros | Cons |
| Simplicity | Market Conditions |
| Easy to understand and use; involves straightforward comparisons with peer companies. | May not account for market conditions affecting all companies similarly, leading to inaccurate valuations. |
| Quick Comparisons | Limited Insight |
| Allows for rapid assessment of a company’s value relative to its peers, facilitating quick decision-making. | Provides a snapshot based on relative metrics, potentially missing deeper insights into a company’s unique strengths or weaknesses. |
| Benchmarking | Assumption of Similarity |
| Useful for benchmarking a company’s valuation against industry averages or competitors. | Assumes that peer companies are comparable, which may not always be the case, especially if they operate under different conditions or business models. |
| Market-Based | Doesn’t Account for Growth Potential |
| Reflects current market sentiment and trends, giving an idea of how the company is valued relative to the market. | May overlook a company’s growth potential or strategic advantages that aren’t captured by simple ratios. |
| Broad Application | Potential for Misleading Results |
| Applicable across various industries and sectors, providing a versatile tool for valuation. | Can be misleading if used in isolation, as it doesn’t account for specific company nuances or future performance projections. |
CONCLUSION
Relative multiples-based valuation is a straightforward yet effective tool for investors. Comparing a company’s valuation metrics to its peers provides a quick and context-rich assessment of whether a stock is valued higher or lower compared to its competitors. However, like any tool, it is most effective when used with a clear understanding of its limitations and in conjunction with other valuation methods.
In a market overflowing with information, mastering the art of relative multiples can give investors a critical edge—helping them navigate through the noise and uncover true value. Whether evaluating Alphabet’s market position or comparing Apple to its tech rivals, relative multiples-based valuation remains an indispensable approach for the savvy investor.

