In the realm of finance, the financial statements interlinkages —the Income Statement (IS), Balance Sheet (BS), and Cash Flow Statement (CFS)—serves as the backbone of a company’s financial reporting. Grasping the interconnections among these statements is not just essential for constructing robust financial models; it’s also a common topic in interviews for positions in financial services.
So, how do these statements intertwine? The income statement details sales over a specific period, but not all sales translate directly into cash. This is where the cash flow statement steps in, transforming the non-cash elements from the income statement into actual cash flows. The fundamental difference in their preparation—where the income statement follows accrual accounting principles while the cash flow statement is grounded in cash accounting—creates a multitude of links between the two.
Furthermore, the balance sheet presents a snapshot of a company’s assets, liabilities, and equity, crafted using distinct accounting principles that diverge from those of the income statement and cash flow statement. In essence, the cash flow statement investigates changes in cash flow stemming from balance sheet items, while the income statement provides explanations for variations in the balance sheet. Although delving into every link could fill volumes, this article will highlight the most significant connections, offering clarity on how these financial statements work together to paint a comprehensive picture of a company’s financial health. You can download a sample interlinked financial statement here for your review.
MOST COMMON THREE FINANCIAL STATEMENTS INTERLINKAGES
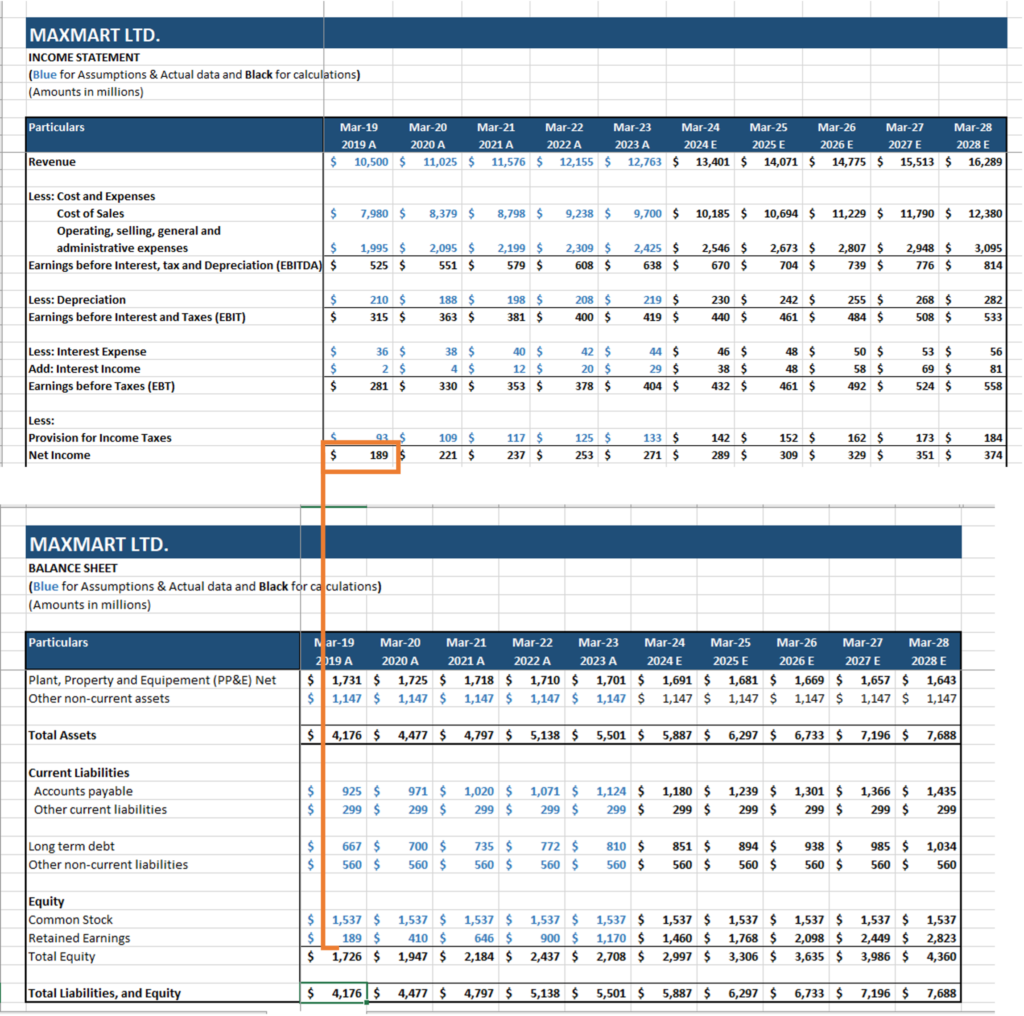
1. NET INCOME & RETAINED EARNINGS
Net income is a crucial link connecting the Income Statement, Balance Sheet, and Cash Flow Statement. It’s calculated by subtracting total expenses from total revenues, reflecting the company’s profitability over a specific period. This final figure on the Income Statement indicates how well the business performed during that time.
Net Income= Total Revenues − Total Expenses
Once established, net income influences the Balance Sheet through retained earnings, which are adjusted at the end of each period. This adjustment highlights how profits or losses impact shareholder equity and overall financial health.
Ending Retained Earnings = Beginning Retained Earnings + Net Income − Dividends
In the Cash Flow Statement, net income serves as the starting point for cash flow analysis. It is adjusted for non-cash items and changes in working capital, transforming the accrual-based figure into actual cash flow. This process reveals how much cash the company generated or consumed.
Cash Flow from Operating Activities = Net Income + Depreciation + Changes in Working Capital − Other Non-Cash Adjustments
Let’s see an example for the same to understand the flow better.

**
2. PLANT, PROPERTY, AND EQUIPMENT (PP&E), CAPITAL EXPENDITURE, AND DEPRECIATION
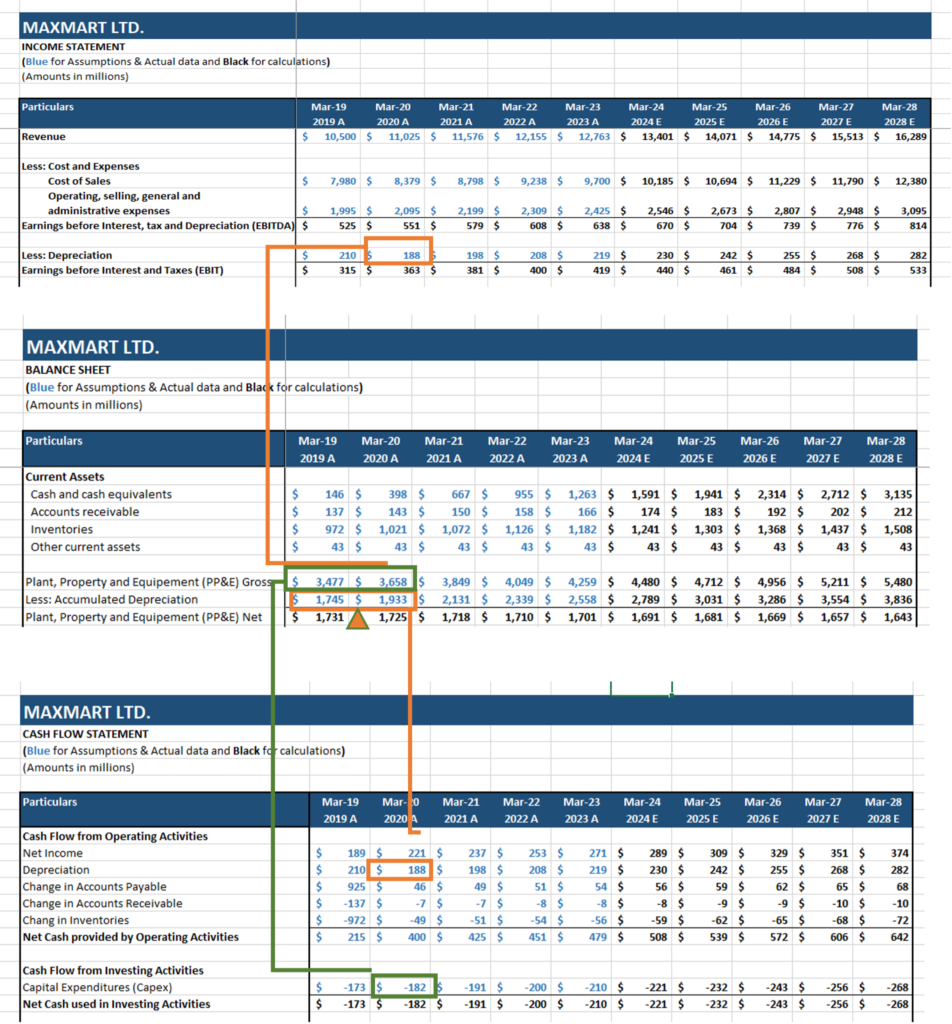
Depreciation is a crucial component in linking the Income Statement (IS), Balance Sheet (BS), and Cash Flow Statement (CFS). It refers to spreading out the cost of physical assets over the duration of their useful life. On the IS, depreciation is recorded as an expense, reducing net income, but it doesn’t reflect an actual cash outflow. Therefore, when calculating cash flow from operations on the CFS, depreciation must be added back to net income. This is because it’s a non-cash expense, meaning the company didn’t actually spend cash for this reduction in net income.
From a Balance Sheet perspective, depreciation flows directly from the Property, Plant, and Equipment (PP&E) account. As assets like machinery or buildings age, their value decreases, which is captured through depreciation. This reduction in the asset’s book value is reported on the BS, but no cash changes hands during this process. Thus, when building financial models, it’s crucial to develop a separate depreciation schedule to accurately forecast how depreciation will affect both the BS and IS.
Additionally, capital expenditures (CapEx) — investments in long-term assets like new equipment or facilities — add to the PP&E account on the BS. Unlike depreciation, which decreases asset values, CapEx increases them. However, since CapEx involves spending actual cash, it appears on the CFS under cash flow from investing activities, reducing the company’s available cash for the period. This creates a strong connection between the CFS and BS, as CapEx alters both the cash position and asset values simultaneously.
Let’s see an example for the same to understand the flow better.
**
3. OPERATING WORKING CAPITAL
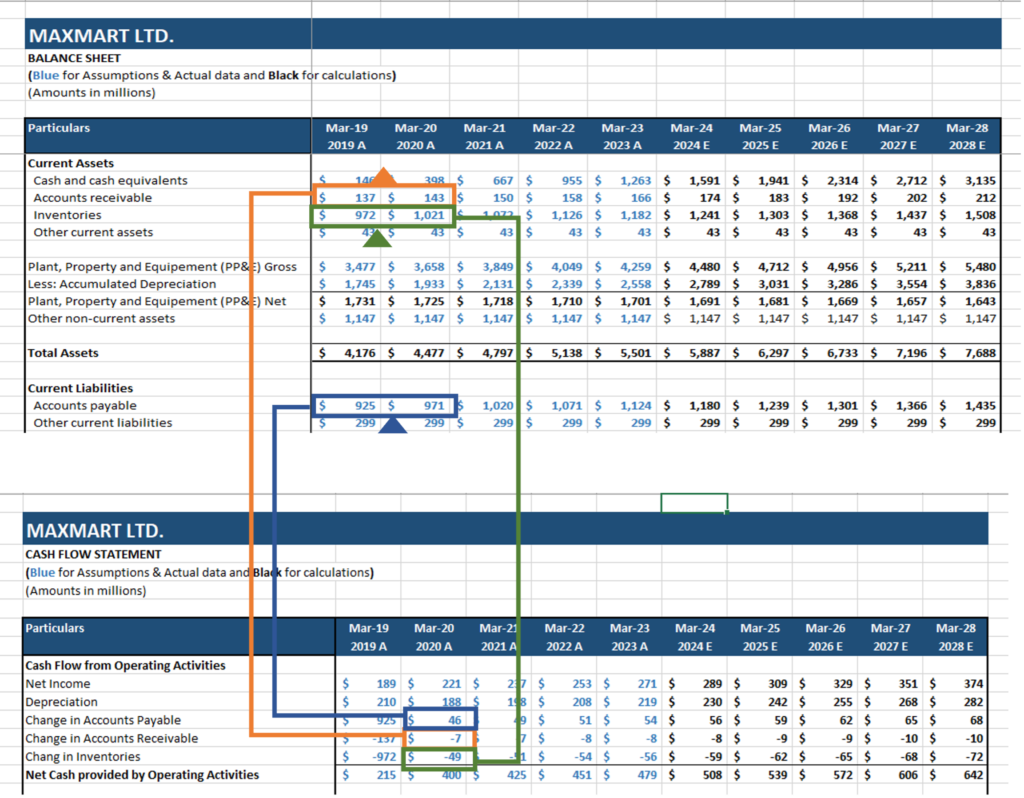
Modelling net working capital (NWC) can be tricky, but it’s essential for understanding how cash moves through a business. Net Working Capital is Current Assets (Accounts Receivable and Inventories) less Current Liabilities (Accounts Payable). Changes in current assets like inventory and accounts receivable, or current liabilities like accounts payable, reflect revenues and expenses from the Income Statement (IS). However, these don’t always show actual cash movements, so adjustments are made in the Cash Flow Statement (CFS).
To do this, a separate section calculates changes in NWC. For example, if a company’s inventory increases on the Balance Sheet (BS), it means cash was spent to purchase more stock, so it’s shown as a cash outflow on the CFS. On the other hand, if accounts receivable decrease, cash has been collected from customers, which appears as an inflow on the CFS.
Ultimately, these changes in NWC are tracked on the CFS to reveal the real cash impact of day-to-day operations. Understanding this helps provide a clearer picture of the company’s liquidity and working capital management.
Let’s see an example for the same to understand the flow better.
**
4. DEBT FINANCING
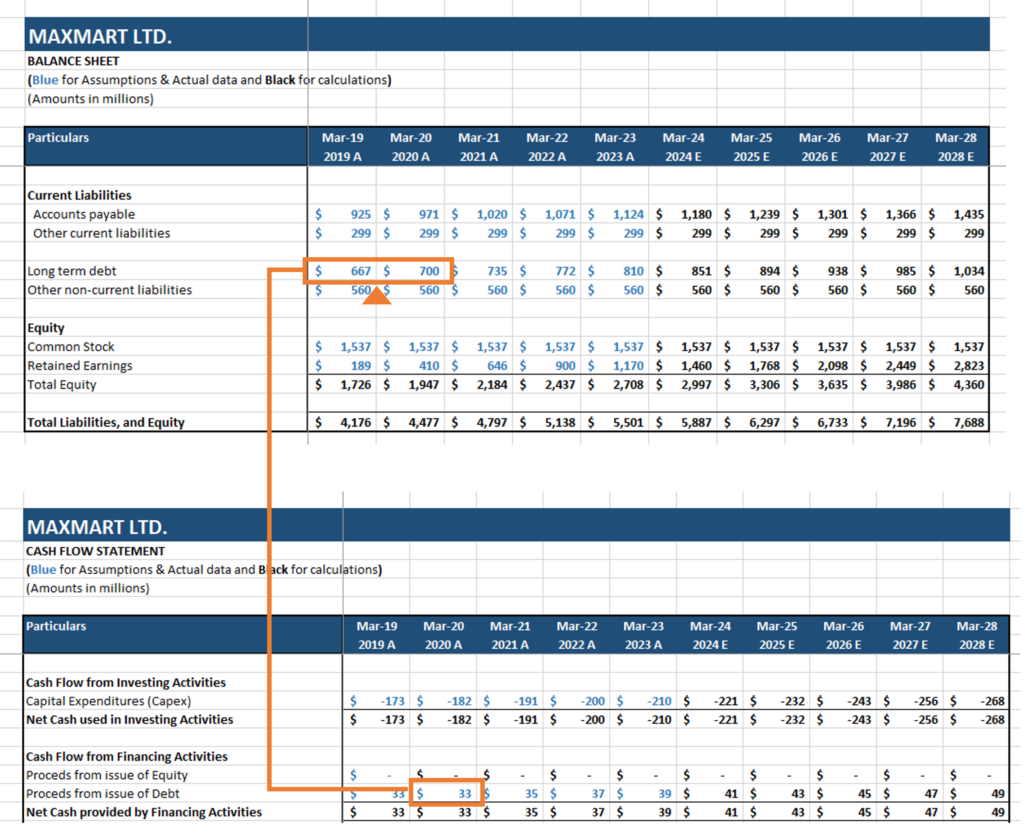
Debt plays a key role in linking the three financial statements. On the Balance Sheet (BS), debt is recorded as a liability, and companies must pay interest on this debt, which shows up as an expense on the Income Statement (IS). Meanwhile, cash movements related to debt, such as issuing new debt or repaying existing debt, are reflected in the Cash Flow Statement (CFS) under the cash from financing section.
Issuing debt creates inflows of cash, increasing liabilities on the BS and resulting in interest expenses on the IS. Repaying debt leads to cash outflows and reduces the principal amount owed on the BS. Because of the complexity, a separate debt schedule is often needed to track and model these interactions in detail. Understanding these linkages helps paint a clear picture of how a company manages its debt obligations.
Let’s see an example for the same to understand the flow better.
**
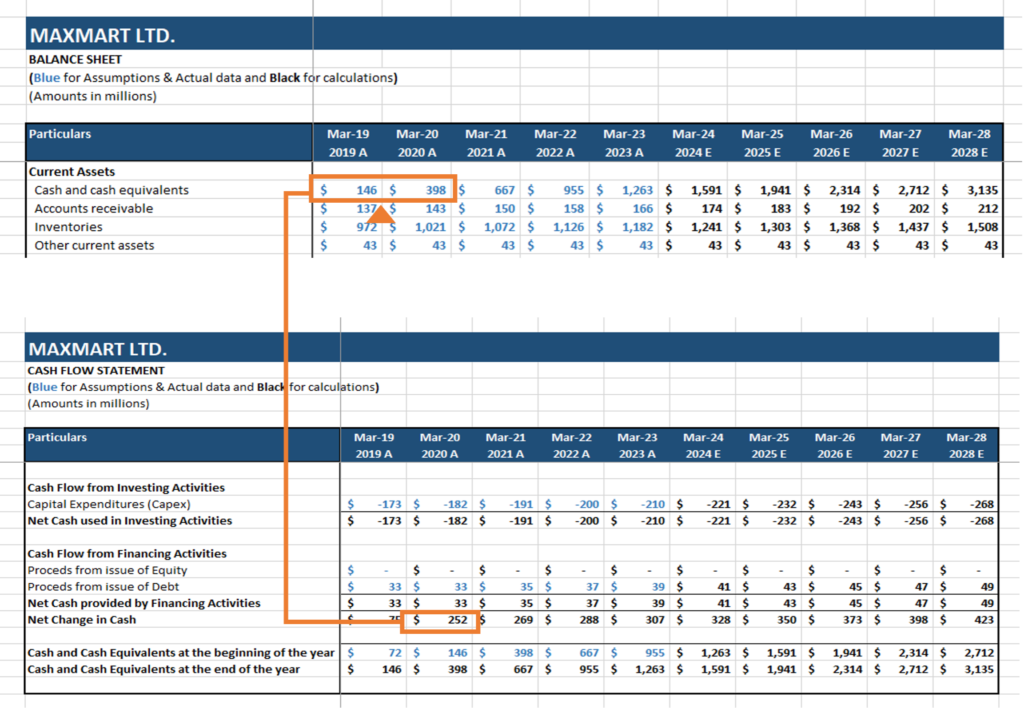
5. CASH BALANCE
The final step in connecting the three financial statements ties everything together. Once all the previous elements—such as net income, depreciation, changes in working capital, and debt—are linked accurately, the cash flow from operations, investing, and financing is summed up. This total is then added to the prior period’s closing cash balance. The result? It turns into the closing cash balance for the current period shown on the Balance Sheet.
This is the crucial moment when you check whether your Balance Sheet balances, meaning assets equal liabilities plus equity. If everything is correctly linked, the Balance Sheet will reflect an accurate picture of the company’s financial position, with the cash flow closing the loop between the Income Statement and the Balance Sheet. This final step confirms that all the moving parts of the financial statements are working harmoniously.
Let’s see an example for the same to understand the flow better.
**
LINKING FINANCIAL STATEMENTS FOR EFFECTIVE FINANCIAL MODELING
Building a financial model involves seamlessly linking the three core financial statements—Income Statement, Balance Sheet, and Cash Flow Statement. For example, imagine a small bakery.
- Historical Data Collection: Begin by gathering three years of financial data, including revenue, expenses, and net income for the Income Statement; assets, liabilities, and equity for the Balance Sheet; and cash flows from operations, investing, and financing for the Cash Flow Statement. This historical data is typically hardcoded into the model.
- Calculate Drivers and Ratios: Analyze the data to identify key performance indicators (KPIs), such as gross margin and inventory turnover, which reflect the bakery’s operational efficiency.
- Enter Future Assumptions: Based on historical performance, make reasonable assumptions, like a 10% annual revenue growth rate and a 5% increase in operating expenses. In this step, the future projections invert the hardcoded historical data, with assumptions fixed and the statements dynamically calculated.
- Build and Link the Statements: Link the statements by projecting revenue and expenses on the Income Statement, updating retained earnings on the Balance Sheet, and adjusting cash flows based on net income and changes in working capital in the Cash Flow Statement.
This integrated approach creates a dynamic financial model that offers a comprehensive view of the bakery’s financial health, aiding in informed decision-making and strategic planning.
CONCLUSION
The financial statements interlinkages are vital in painting a holistic picture of a company’s financial well-being. Understanding how the income statement, balance sheet, and cash flow statement interconnect helps investors, analysts, and management evaluate company performance more accurately and make informed financial decisions. By tracing these links, we gain insights into how companies manage profitability, cash flows, and growth strategies, making it easier to assess their overall health and future prospects.


