
Whether you’re preparing for a business meeting, an academic presentation, or a project update, showcasing your data from Excel to PowerPoint accurately and attractively can make all the difference. Excel is a powerful tool for data management and analysis, while PowerPoint excels in delivering engaging presentations. However, combining these two tools can sometimes seem daunting. This guide will walk you through the step-by-step process of copying Excel tables and charts into PowerPoint, ensuring your presentations are not only informative but also visually compelling. From basic copying techniques to advanced tips for maintaining data integrity and formatting, you’ll learn how to create professional presentations that captivate your audience and clearly convey your message.
1) Excel to PowerPoint – Tables
Method 1: Copy and Paste Options
(PowerPoint for Microsoft 365, PowerPoint 2021, PowerPoint 2019, PowerPoint 2016)
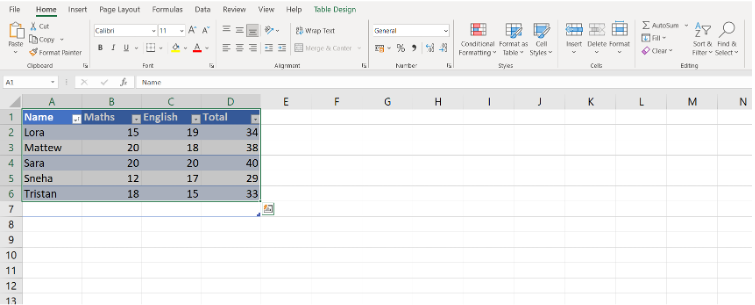
- Select the table or the range of cells you want to copy in Excel. Right-click on the selected range and choose Copy (or press Ctrl+C).
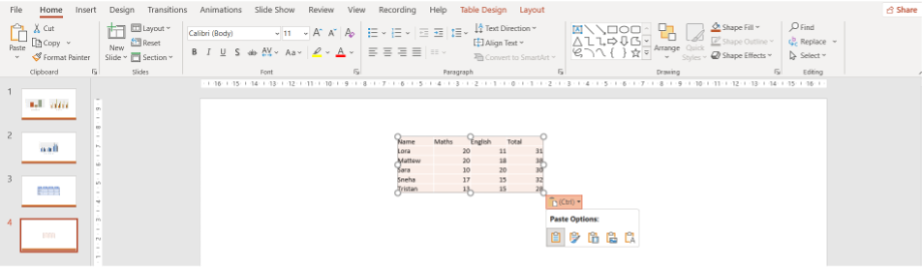
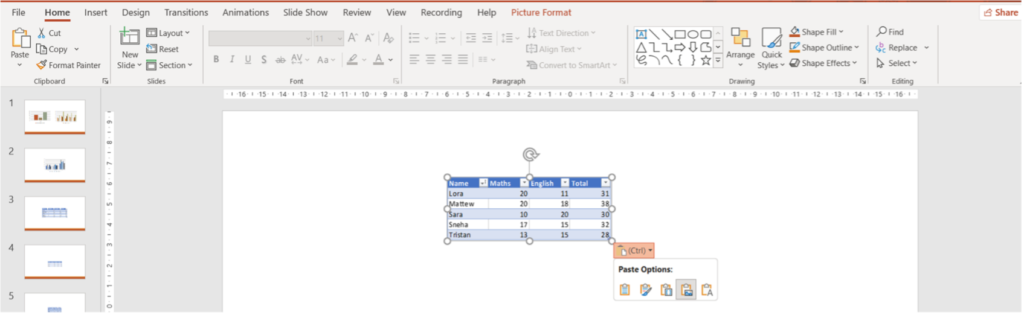
- Switch to PowerPoint and right-click on the slide and choose Paste (or press Ctrl+V).
Depending on how you want the table to appear, you can choose different paste options:
A. Use Destination Styles: Adapts the table to match the PowerPoint theme. A tables in PowerPoint gets created.
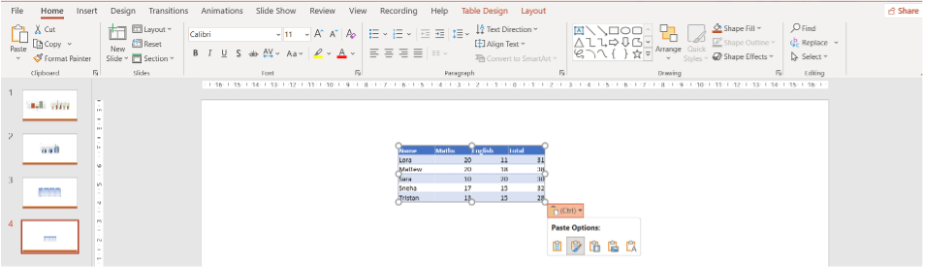
B. Keep Source Formatting: Maintains the original Excel formatting
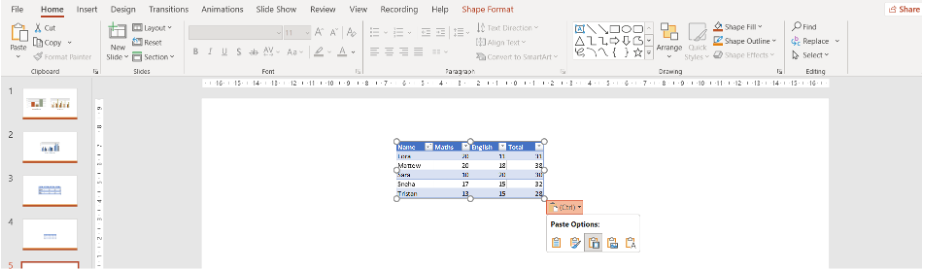
C. Embed: Embeds the Excel table in PowerPoint as a standalone object.
Consequently, any changes made to the original Excel file will not be reflected in the PowerPoint table. Similarly, any edits made to the table within PowerPoint will not affect the original Excel file. The embedded table can be edited directly in PowerPoint without any connection to the original Excel source.
D. Picture: Pastes the table as a picture, which is not editable.
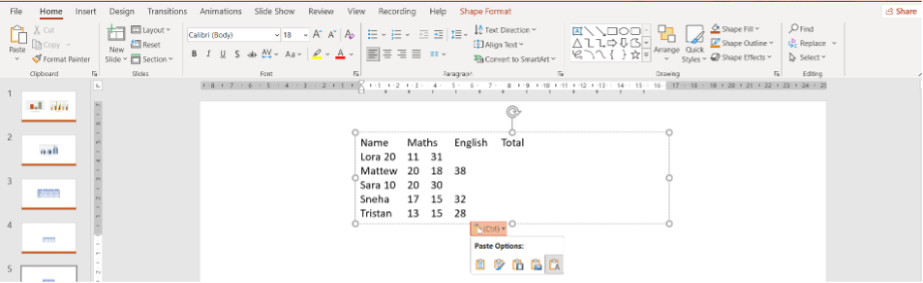
E. Keep text only: Ensure that only the text from the Excel cells is transferred, and all original formatting (such as cell borders, colors, fonts, and cell sizes) is removed
***
Method 2: Insert As An Object
(PowerPoint for Microsoft 365, PowerPoint 2021, PowerPoint 2019, PowerPoint 2016)
(This method works only if your Excel file contains a single table. Please note that if your Excel file contains multiple charts or other content, this method may not be effective.)
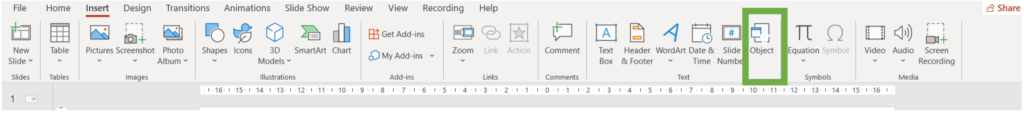
1. Navigate to the Insert tab, and click on Object in the Text group
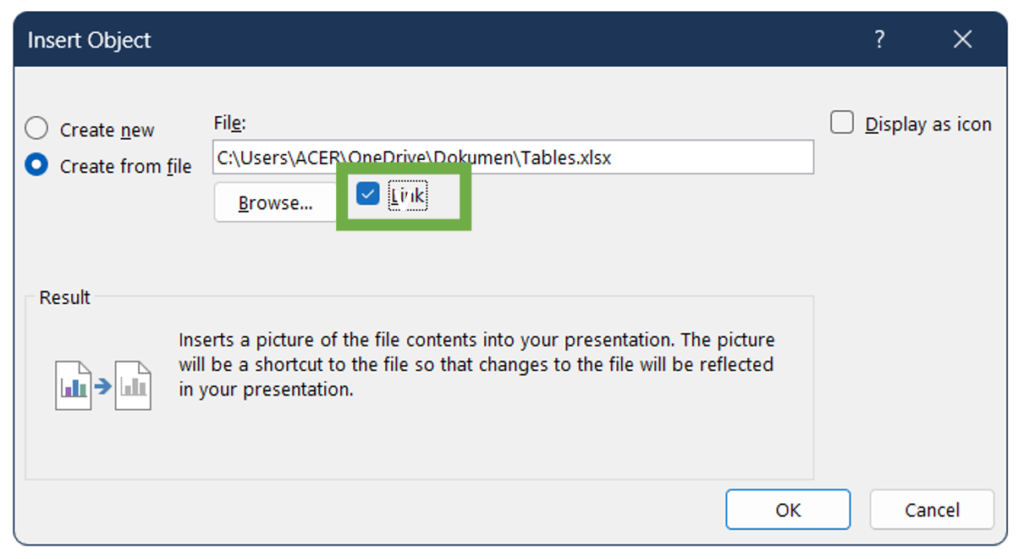
2. In the Insert Object dialog box, select Create from file.
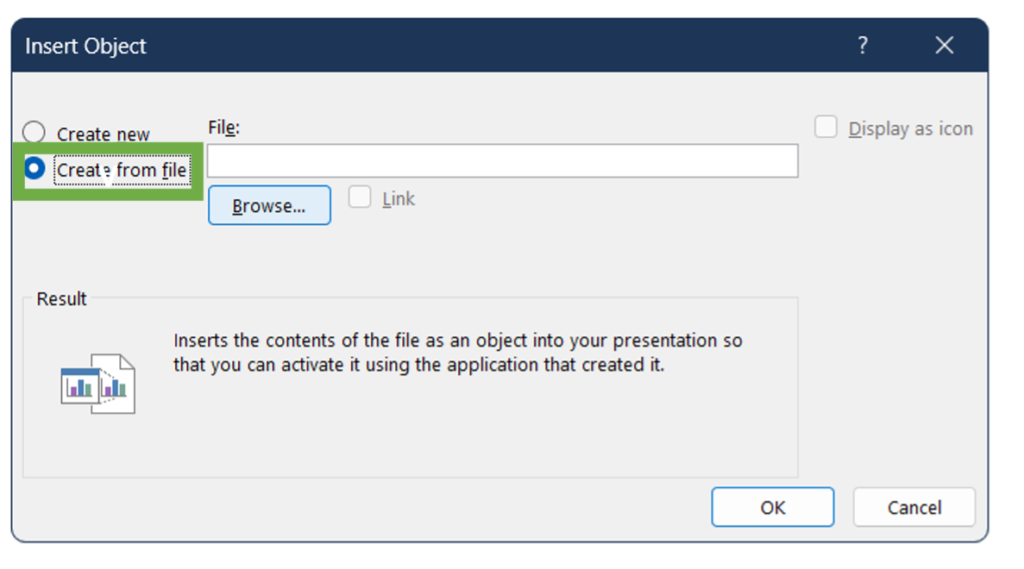
3. Click Browse and locate the Excel file containing the table, select the file and click Insert
(Check Link if you want the table to be updated automatically when the Excel file is updated)
Watch the video below to see how we can embed an Excel workbook containing a table in PowerPoint
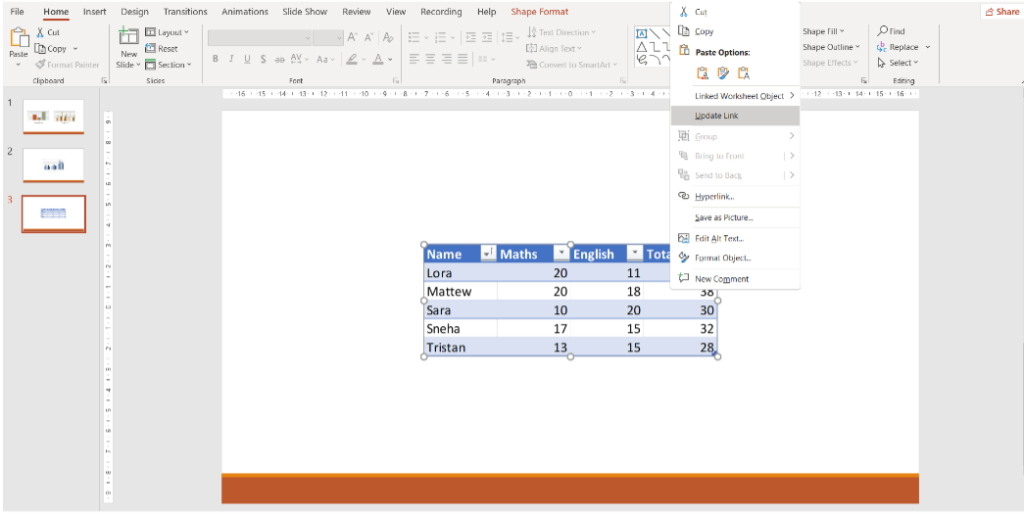
Pro tip 1: To update your object, simply right-click the object and select Update Link.
Pro tip 2: PowerPoint will insert the entire worksheet as an object. You might need to double-click the object to open it in Excel and adjust the view to show the specific table you want.
Updating Your Links
The dialogue box you see below is a security feature in Microsoft PowerPoint, it pops up every time you open PowerPoint with linked objects in it. It alerts you that the presentation contains links to other files and gives you the option to update or not update these links.

- Update Links: Click this to refresh the data from the linked files. This ensures you have the most up-to-date information.
- Cancel: Click this to keep the previous data without updating the links.
***
Excel to PowerPoint – Charts/Graphs
(PowerPoint for Microsoft 365, PowerPoint 2021, PowerPoint 2019, PowerPoint 2016)
Copy and Paste Chart Options
- In Excel, select the chart you want to copy. Right-click on the chart and choose Copy (or press Ctrl+C).
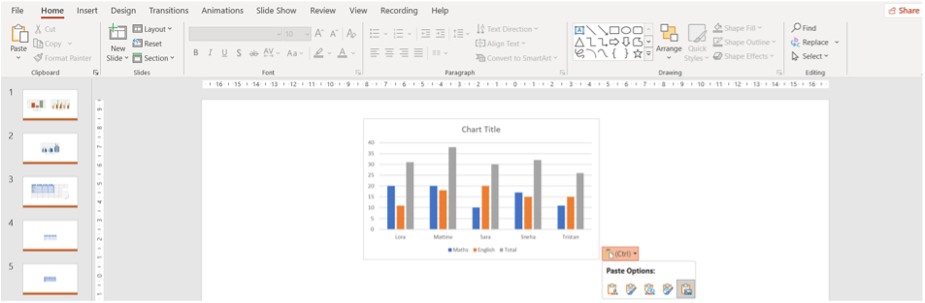
- Switch to PowerPoint and right-click on the slide and choose Paste (or press Ctrl+V). Depending on how you want the chart to appear, you can choose different paste options:
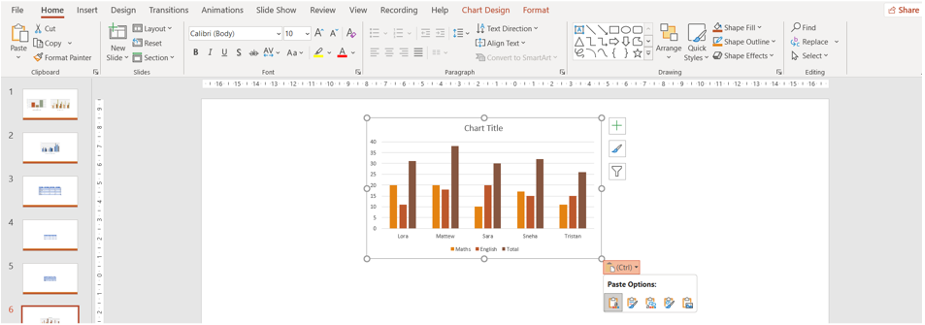
Select Paste Options:
A. Use Destination Theme and Embed Workbook: Matches the PowerPoint theme, embedding the chart for future edits only in PowerPoint.
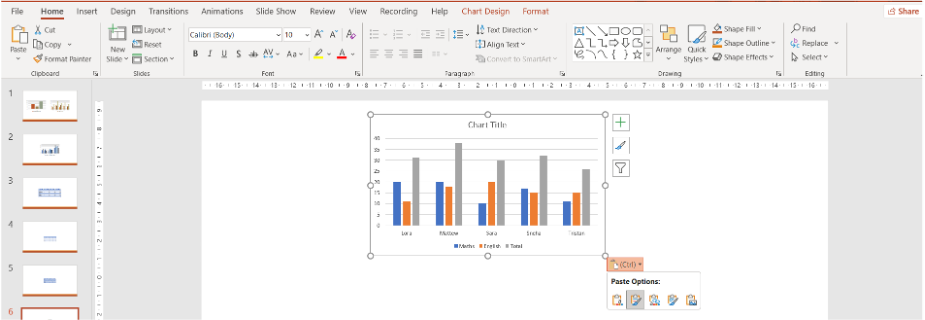
B. Keep Source Formatting and Embed Workbook: Maintains Excel formatting, embedding the chart for future edits only in PowerPoint.
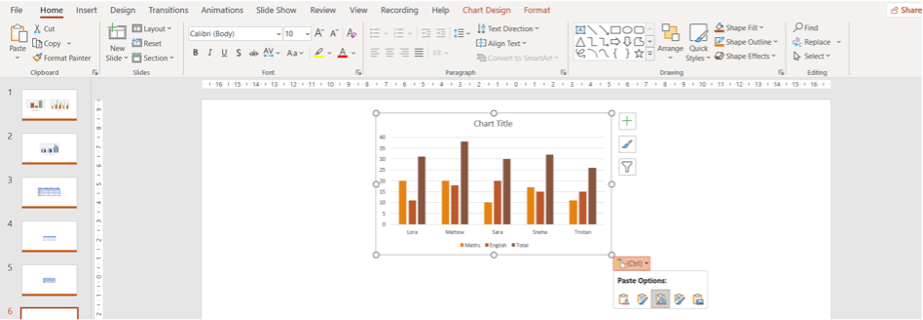
C. Use Destination Theme and Link Workbook: Matches PowerPoint theme, linking the chart to update with Excel changes.
D. Keep Source Formatting and Link Workbook: Maintains Excel formatting, linking the chart to update with Excel changes.
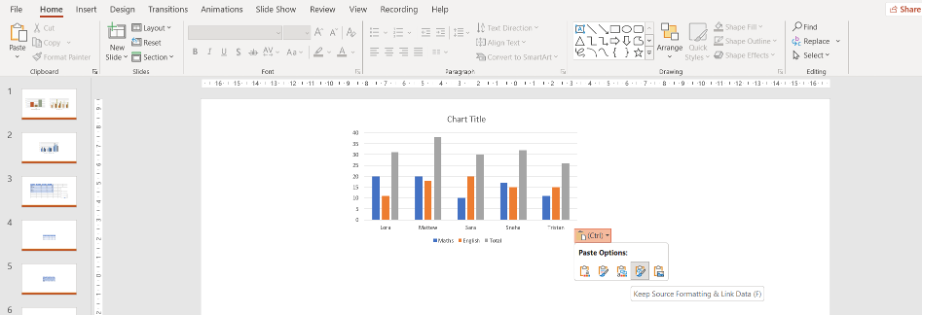
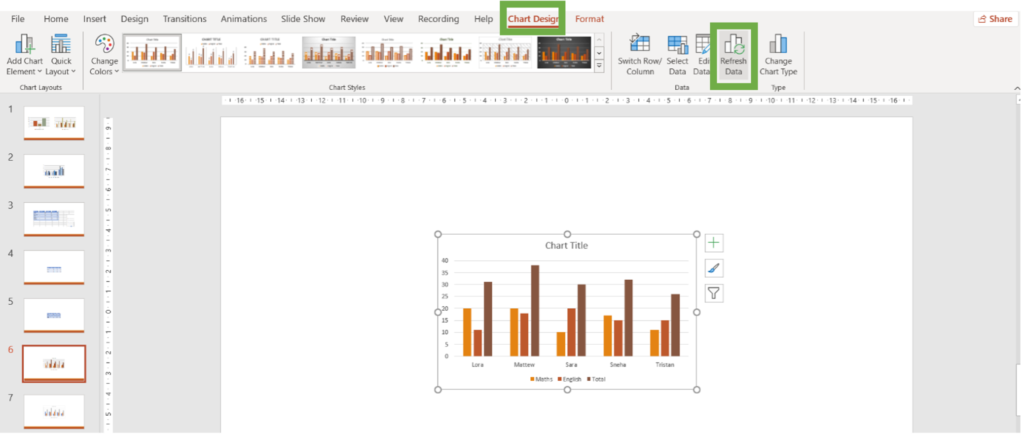
Pro Tip: In the Link Workbook option, we can update out data. Click on the table and navigate to Chart Design Tab, navigate to Data group and click on Refresh Data.
E. Picture: Pastes the chart as an image, which is not editable
Difference between Use Destination Theme and Keep Source Formatting
- Use Destination Theme: Adapts the appearance of the chart or table to match the PowerPoint presentation’s theme.
- Keep Source Formatting: Maintains the original formatting of the chart or table as it appears in Excel workbook.
Difference between Embed Workbook and Link Workbook
1. Embed Workbook:
Edits can be made directly in PowerPoint, and those changes are saved within the presentation. The PowerPoint file size increases since it contains the entire workbook. Changes made in the original Excel file do not affect the embedded data.
2. Link Workbook:
The PowerPoint charts/table is linked to the original Excel file. The data in PowerPoint updates automatically when the Excel file is updated. Also, sometimes you may need to Refresh manually in PowerPoint to update the chart Edits to the data need to be made in the original Excel file.
The PowerPoint file size remains smaller as it doesn’t contain the entire workbook.
Conclusion
By utilizing methods such as Copy and Paste, and Insert Object, you can ensure that your data is accurately represented and seamlessly integrated into your slides. Whether you’re working with tables or charts, understanding the differences between embedding and linking workbooks, as well as the various paste options, allows you to tailor your presentations to your specific needs. These skills not only enhance the visual appeal of your presentations but also improve your efficiency, making your data-driven insights more accessible and engaging. With these methods, you can confidently present your data in a clear, professional, and visually captivating manner, elevating the overall quality of your presentations.

