
What is Compound Annual Growth Rate (CAGR)?
Compound Annual Growth Rate is commonly referred to as CAGR in the business or industry. It is the measure of the annual growth rate of any investment over time, taking into the account the compounding effect and assuming that the profits are reinvested at the end of each year of the investment’s life span. A CAGR measures the rate of return for an investment like- Bond, equity share, Mutual fund, or savings account. CAGR is an important financial metric used for better financial analysis and helps in undertaking and understanding predictions and forecasts. CAGR estimated is commonly published by various analysts and market intelligence firms about the expected growth and future prospects for a given industry. CAGR is also often used by small and mid-sized business to identify opportunities to explore new markets and expand their product line. It is especially useful for the investors who without wanting to look deep into the ups and downs of any stock, want to take a quick overview of the financial performance of the company. It is commonly used to project an investments expected future returns or used to measure and compare an investment’s past performance. It however ignores the volatility factor associated with any investment opportunity and smoothens the rate of growth for a given period. If CAGR is negative, it indicates losses rather than gain over a given period of time.
CAGR FORMULA:
CAGR= [(EV/BV)] ^1/n – 1) * 100
Where,
EV= Ending Value
BV= Beginning Value
n = Number of Investment periods (months, years, etc.,)
Steps to calculate CAGR of an investment for “n” no. of time period?
- Investment’s value at the end of the period should be divided by the value at the beginning of the period
- The result should be raised to an exponent of one divided by the no. of Investment period
- From the result of Step 2 subtract one
- Finally, to get the result in percentage multiply Step 3 by 100.
Modification required in the CAGR formula: Investments may not necessarily be made on the first or the last day of the year. Hence the number of Investment period (n) in the above formula has to be first calculated in days. In may happen that an investor purchased or sold a stock somewhere in the middle of the year, then it has to calculate the number of investment periods (n) in days first and then divide it by 365 days to get the fractional no. of years the stock had been held.
ADVANTAGES AND USES OF CAGR:
- It Smoothens the rate of Growth hence making comparison easier between the different investments alternatives-
CAGR can be used to compare different investment options with one another as its produces a geometric mean, giving us a constant rate of return over any given time period. For example, Mr. A and investor had ideal $20,000 with him in the year 2017 and he invested $10,000 in a savings account for a term of five years with a fixed annual rate of interest of 4%. He invested another $10,000 at the same time into a stock mutual fund for 5 years. Since the rate of return on the stock mutual fund is uneven across the span of 5 years, the comparison between the two investments made become difficult. However, CAGR is one such metric through which a reasonable comparison can be made between the two different investment options.
Suppose at the end of the period the balance in the fixed deposit account is $12,166 and the mutual fund balance is $16,987, then using CAGR we can compare the two investment options as below:
CAGR (Savings Account) = ($12,166/$10,000) ^ 1/5 -1 *100 = 4%
CAGR (Mutual Fund) = ($16,987/$10,000) ^ 1/5 -1 *100 = 11.17%
From the CAGR figures an investor may find Mutual fund option more lucrative, with nearly 7% more return than savings account. However, the investor will not be able to see through the risk associated with the uneven and volatile nature of mutual fund as CAGR smoothens the returns over the period of time ignoring the risk factor.
- CAGR is a useful metric for comparing different investments over the same investment horizon-
If we are comparing two or more investment alternatives for the same investment horizon, then CAGR reflects a better picture than average annualized rate of return since CAGR is not affected by percentage changes within the same time horizon, and hence does not give misleading results. We can understand this through the following example:
Mr. A invested $10,000 in year in mutual fund. The Investment yielded the following returns in Year 2 & 3.
| Year | Amount | Return |
| 0 | $10,000 | – |
| 1 | $13,500 | 35% |
| 2 | $8,775 | -35% |
Average Return from Mutual fund= (35%-35%)/2= 0
CAGR= (8,775-10,000)/10,000 = -12.25%
The above example shows that the investment gave 35% positive return in Year 1 and negative 35% return in Year 2. The average return of two years comes to zero. However, when we calculate CAGR, we get a negative return of 12.25%. From this we get that CAGR, equalizes the return over a given period of time to reflect the compounded annualized rate of return giving us somewhat a better representation of investments performance. Whereas averaging the return indicates that there is no change in the return over the 2-year time span.
- CAGR can be used to track performance of one or more company’s different business measures alongside with one another: CAGR helps in analyzing the performance and behavior of different business metrics, such as revenue, sales, costs, customer satisfaction, market share over a span of given years for one or multiple companies. For Example: A company named ABC uses CAGR to analyze the annual growth rate of its customer satisfaction and market share to get insights into its position in the competitive market place. ABC Ltd had market share CAGR of 23.21% but customer satisfaction CAGR of -0.21% which in turn helped ABC Ltd dig deep into its strengths and weaknesses.
- CAGR helps companies helps in swot analysis: CAGR can be used by companies to compare their strengths and weaknesses with other companies in the same industry by comparing the CAGR of various business activities. For Example: ABC Ltd had market share CAGR of 23.21% whereas the market share CAGR of its competitor XYZ Ltd, is 25.75% during the same time span. Hence, XYZ Ltd enjoys a better market positioning than ABC Ltd.
- CAGR can be used by Investors to evaluate the past returns of any investment or predict future profits: CAGR formula can be rearranged so that investors can find out the present value or future value of its investment or calculate the desired rate of return from any investment. For example: Mr. A has ideal $ 50,000 as on date and he knows that 10 years down the line he has to invest around $90,000 in his daughter’s education. He thus plans to invest in such an investment alternative which yields him this required amount of money. Thus CAGR can be used to find the investment providing the ideal rate of return to fetch the desired amount of money in future. Here, we can replace the beginning value of investment with the present value of money that Mr. A has with him and the end value of investment with the future value of money that Mr. A wants in future.
Hence CAGR= $(90,000/50,000) ^ 1/10*100 = 6.05%
Hence, Mr. A shall investment in such an investment option which has a historic CAGR of around 6.05% or more to get the desired amount of money for future to meet his goal.
- CAGR is used to forecast future values: CAGR can be used for forecasting purpose by finance professionals or investors by using the historic growth rates of a series of data to predict the future returns. For example: CAGR is commonly used in business valuations and forecasting to forecast the expected revenue for the next few years.
LIMITATIONS OF CAGR
- CAGR smoothens the rate of growth and ignores the risk factor: One of the limitations of CAGR is that it smoothens the rate of growth over a period of time and hence ignores the risk factor i.e., the volatility and shows that an investment had a steady growth during that given span of time. However, the fact is that the investments have an uneven return rate over the life of the investment except a few like bonds held till maturity, fixed deposits or other such similar investments with low volatility. CAGR is used by investors to take quick decisions about the overall performance of any company or investment till date. However, any decisions should be made by considering both the risk and return associated with any investment.
- CAGR does not account for the funds added or withdrawn from any portfolio or investment over the span of time for which CAGR is being calculated: CAGR gives a compounded annualized rate of return assuming that the funds are reinvested over the next year. It does not account for any changes in the investment over the given span of time due to insertion or withdrawal of funds. For example, if an investor has a portfolio of $10,000 invested for a time span of 5 years and the investor adds extra $5,000 in the third year, them the CAGR will stand inflated as CAGR accounts for the beginning and the end balance of the investment. Similarly, if the investor withdraws any amount in the middle of the 5 years, CAGR would stand deflated and give us an inaccurate result.
- CAGR is not much viable for evaluating return of investment with shorter life span: CAGR gives a smooth growth rate and ignores the volatility factor attached to it. No matter how steady has been the performance of the stock over the past few years, based on CAGR one cannot predict that the future returns will also remain steady. Any unpredictable future event may result the return to inflate or deflate. If we calculate CAGR for 2 years and there is any loss or disruption in the second year, CAGR is affected significantly. However, if we increase the number of years to five or ten years, any disruption in the second year will cause just a minor impact on the compounded annualized rate of return.
- CAGR can be used to compare only those investments with identical time span: CAGR can be used to compare different investments or business metrics only for the same time span. We cannot compare CAGR of a 5-year Fixed Deposit with a 10-year Mutual Fund.
WHAT IS AN IDEAL EXAMPLE OF A GOOD CAGR?
An ideal CAGR for any investor, analyst or any company varies depending upon the circumstance and for what purpose one is evaluating the CAGR. For example, an investor may be evaluating stock of two different companies with CAGR of 20% and 30% respectively. While at a glance the investor may find the second alternative more lucrative, on further study of the Industry the investor may find that the industry CAGR for the 1st stock is 15% and for 2nd industry is 35%. The investor on comparing the stock performance with industry performance may choose to invest in the first stock since its CAGR is better than the industry CAGR, implying it is well performing above the given industry standard.
Also the risk appetite of the investors decides which stock or investment they choose irrespective of investment with high CAGR. A stock may have high CAGR but also high risk associated with it. An investor who is risk averse shall find stock with lower risk more appealing.
DIFFERENCE BETWEEN CAGR AND IRR
CAGR measures the compounded annualized return on any investment over a given time span. Internal rate of return (IRR) also measures the performance of the investment but its calculation is not that straightforward like CAGR. In IRR gives us a rate of return at which if all the projected cash flows of the investment or company when discounted gives an NPV equal to zero. CAGR uses only beginning investment value and ending investment value, while IRR uses estimated cash inflows and outflows for calculation of the discounted rate of return. IRR shows the highest level of growth that can be achieved by any company without requiring external financing.
Formula for IRR is:

Where,
CF0 = Initial Investment
CF1, CF2, CF3,….., CFn = Cash Flows
n = Each Period
IRR= Internal Rate of Return
DIFFERENCE BETWEEN CAGR AND GROWTH RATE
CAGR, accounts for the compounding factor and smoothens the rate of return any investment provides over a period of time. However, growth rate does not account for compounding effect while calculating the rate and is simple a linear measure.
RISK ADJUSTED CAGR
CAGR does not account for the risk or volatility factor associated with any investment or business metric. In order to better compare the performance of the investments taking volatility factor into account investors can use risk- adjusted compounded annual growth rate. Risk adjusted CAGR can be calculated by multiplying the CAGR by one minus the standard deviation of the investment. In case of less risky investments like fixed deposits, savings account or treasury bonds the standard deviation is mostly less or equal to zero. If the standard deviation is zero, the risk adjusted CAGR remains unaffected. The higher the standard deviation, the lower will be the risk adjusted CAGR.
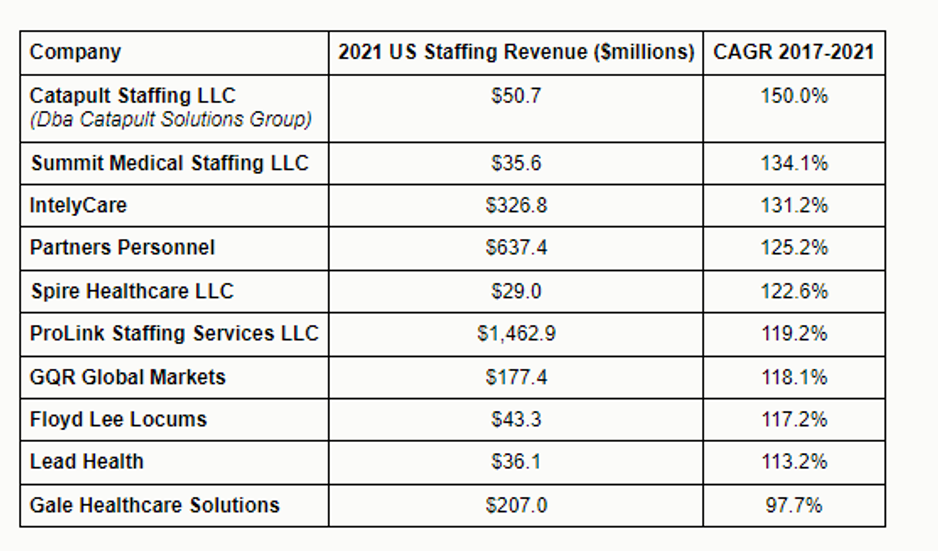
REAL LIFE EXAMPLE OF CAGR USED TO COMPARE DIFFERENT COMPANIES
Example 1: SIA is one of the fastest growing staffing firms of United States and it has published on its website the list of annual fastest growing US staffing firms. Following is the list of the top 10 fastest growing staffing firms in United States.
Example 2
A data set is published by NYU Stern School of Business on the historical CAGR sector wise. It comprises of CAGR in Net income in last 5 years and CAGR in Revenue in last 5 years sector wise.
(Date : as of January 2023)
| Industry Name | Number of Firms | CAGR in Net Income- Last 5 years | CAGR in Revenues- Last 5 years |
| Advertising | 58 | 23.38% | 18.17% |
| Aerospace/Defence | 77 | 5.04% | 3.99% |
| Air Transport | 21 | -23.70% | 2.24% |
| Apparel | 39 | 11.00% | 5.84% |
| Auto & Truck | 31 | 20.13% | 28.06% |
| Auto Parts | 37 | 8.37% | 7.07% |
| Bank (Money Centre) | 7 | 1.29% | 1.94% |
| Banks (Regional) | 557 | 18.14% | 11.02% |
| Beverage (Alcoholic) | 23 | -12.31% | 12.54% |
| Beverage (Soft) | 31 | 17.39% | 15.05% |
| Broadcasting | 26 | 21.36% | 19.54% |
| Brokerage & Investment Banking | 30 | 27.60% | 14.23% |
| Building Materials | 45 | 19.32% | 10.60% |
| Business & Consumer Services | 164 | 15.60% | 8.46% |
| Cable TV | 10 | 31.30% | 20.05% |
| Chemical (Basic) | 38 | 9.22% | 27.02% |
| Chemical (Diversified) | 4 | 21.55% | 1.75% |
| Chemical (Specialty) | 76 | 21.61% | 9.48% |
| Coal & Related Energy | 19 | 8.80% | -3.71% |
| Computer Services | 80 | 16.80% | 10.48% |
| Computers/Peripherals | 42 | 10.07% | 16.36% |
| Construction Supplies | 49 | 9.02% | 5.02% |
| Diversified | 23 | 2.37% | 7.69% |
| Drugs (Biotechnology) | 598 | 7.17% | 27.23% |
| Drugs (Pharmaceutical) | 281 | 30.74% | 42.35% |
| Education | 33 | 16.76% | 4.13% |
| Electrical Equipment | 110 | 14.37% | 13.90% |
| Electronics (Consumer & Office) | 16 | -36.80% | -0.47% |
| Electronics (General) | 138 | 14.11% | 10.63% |
| Engineering/Construction | 43 | 17.28% | 12.14% |
| Entertainment | 110 | 9.02% | 28.59% |
| Environmental & Waste Services | 62 | 45.61% | 10.13% |
| Farming/Agriculture | 39 | 17.56% | 17.57% |
| Financial Svcs. (Non-bank & Insurance) | 223 | 16.33% | 10.44% |
| Food Processing | 92 | 9.38% | 25.21% |
| Food Wholesalers | 14 | 9.74% | 9.84% |
| Furniture/Home Furnishings | 32 | 8.73% | 14.45% |
| Green & Renewable Energy | 19 | 31.38% | -14.71% |
| Healthcare Products | 254 | 10.83% | 19.90% |
| Healthcare Support Services | 131 | 15.80% | 20.16% |
| Healthcare Information and Technology | 138 | 26.83% | 20.45% |
| Homebuilding | 32 | 39.52% | 15.82% |
| Hospitals/Healthcare Facilities | 34 | 11.24% | 1.60% |
| Hotel/Gaming | 69 | 14.93% | 7.58% |
| Household Products | 127 | 6.68% | 11.55% |
| Information Services | 73 | 10.35% | 11.06% |
| Insurance (General) | 21 | 10.52% | 6.90% |
| Insurance (Life) | 27 | 11.96% | 8.29% |
| Insurance (Prop/Cas.) | 51 | 8.33% | 3.82% |
| Investments & Asset Management | 600 | 9.47% | 10.79% |
| Machinery | 116 | 12.20% | 8.50% |
| Metals & Mining | 68 | 23.30% | 5.88% |
| Office Equipment & Services | 16 | -5.91% | 15.79% |
| Oil/Gas (Integrated) | 4 | 49.73% | 12.12% |
| Oil/Gas (Production and Exploration) | 174 | 40.68% | 29.57% |
| Oil/Gas Distribution | 23 | 70.78% | 21.86% |
| Oilfield Svcs/Equip. | 101 | 28.63% | 7.72% |
| Packaging & Container | 25 | 15.05% | 5.90% |
| Paper/Forest Products | 7 | 26.35% | 7.00% |
| Power | 48 | 7.87% | 6.41% |
| Precious Metals | 74 | 23.59% | 3.74% |
| Publishing & Newspapers | 20 | 4.60% | 3.32% |
| R.E.I.T. | 223 | 11.30% | 9.57% |
| Real Estate (Development) | 18 | 39.35% | 10.16% |
| Real Estate (General/Diversified) | 12 | 10.72% | 8.74% |
| Real Estate (Operations & Services) | 60 | 4.28% | 16.00% |
| Recreation | 57 | 10.98% | 7.79% |
| Reinsurance | 1 | -6.28% | 5.63% |
| Restaurant/Dining | 70 | 7.04% | 6.28% |
| Retail (Automotive) | 30 | 25.14% | 17.12% |
| Retail (Building Supply) | 15 | 28.63% | 13.02% |
| Retail (Distributors) | 69 | 30.97% | 7.33% |
| Retail (General) | 15 | 9.20% | 4.32% |
| Retail (Grocery and Food) | 13 | 17.59% | 4.96% |
| Retail (Online) | 63 | -22.18% | 20.71% |
| Retail (Special Lines) | 78 | 15.26% | 13.32% |
| Rubber& Tires | 3 | 31.93% | 12.42% |
| Semiconductor | 68 | 26.11% | 8.88% |
| Semiconductor Equip | 30 | 22.16% | 15.70% |
| Shipbuilding & Marine | 8 | 51.39% | 15.54% |
| Shoe | 13 | 28.02% | 11.90% |
| Software (Entertainment) | 91 | 1.95% | 30.38% |
| Software (Internet) | 33 | 25.67% | 25.94% |
| Software (System & Application) | 390 | 22.17% | 20.10% |
| Steel | 28 | 56.85% | 15.21% |
| Telecom (Wireless) | 16 | -7.11% | 18.50% |
| Telecom. Equipment | 79 | 10.05% | 3.51% |
| Telecom. Services | 49 | 20.72% | 16.81% |
| Tobacco | 15 | 1.70% | 5.77% |
| Transportation | 18 | 24.56% | 14.99% |
| Transportation (Railroads) | 4 | 12.93% | 3.78% |
| Trucking | 35 | 44.06% | 14.16% |
| Utility (General) | 15 | 10.42% | 4.05% |
| Utility (Water) | 16 | 10.62% | 14.35% |
| Total Market | 7165 | 17.00% | 13.90% |
| Total Market (without financials) | 5649 | 17.81% | 14.81% |
Source: https://pages.stern.nyu.edu/~adamodar/New_Home_Page/datafile/histgr.html
Example 3: Product category wise, Retail E-Commerce sales CAGR from 2017 to 2027 in the United States
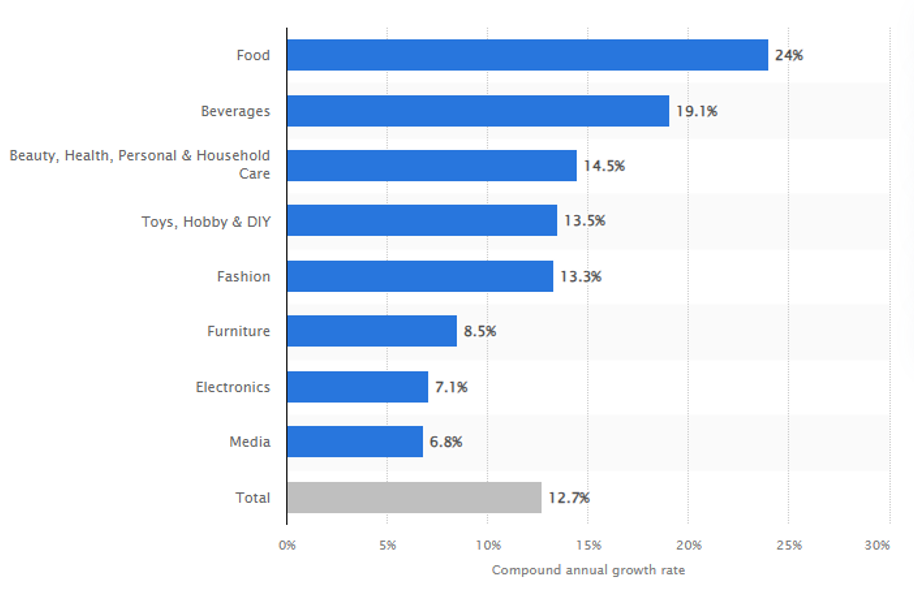
Source:https://www.statista.com/statistics/257516/us-retail-e-commerce-sales-cagr-by-product-category/
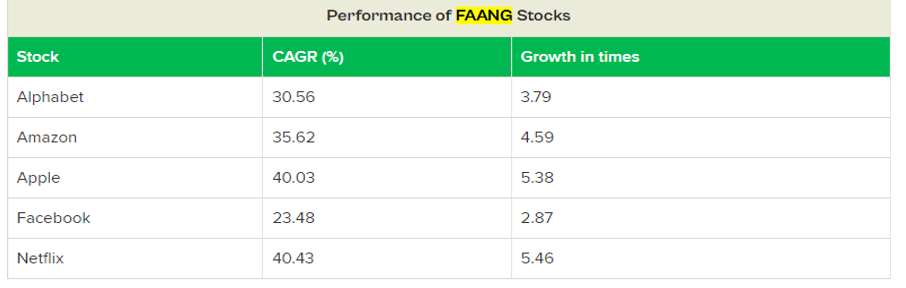
Example 4: Performance of FAANG (Facebook, Apple, Amazon, Netflix, Google or Alphabet) Stocks published by ET Money


23 thoughts on “CAGR – how does compounding even work?”
[…] in Jan 1990, have become $55.1 million in January 2021. This is at a compounded annual growth rate (CAGR) of 28.7%. Holding an investment for 30 years is much difficult than earning a return of 28.7% […]
… [Trackback]
[…] Read More on to that Topic: skillfine.com/cagr-compound-annual-growth-rate/ […]
… [Trackback]
[…] Find More here to that Topic: skillfine.com/cagr-compound-annual-growth-rate/ […]
… [Trackback]
[…] Find More Info here on that Topic: skillfine.com/cagr-compound-annual-growth-rate/ […]
… [Trackback]
[…] Info on that Topic: skillfine.com/cagr-compound-annual-growth-rate/ […]
… [Trackback]
[…] Read More here to that Topic: skillfine.com/cagr-compound-annual-growth-rate/ […]
… [Trackback]
[…] Find More here to that Topic: skillfine.com/cagr-compound-annual-growth-rate/ […]
… [Trackback]
[…] Read More on on that Topic: skillfine.com/cagr-compound-annual-growth-rate/ […]
… [Trackback]
[…] Read More on on that Topic: skillfine.com/cagr-compound-annual-growth-rate/ […]
… [Trackback]
[…] Read More here to that Topic: skillfine.com/cagr-compound-annual-growth-rate/ […]
… [Trackback]
[…] Info on that Topic: skillfine.com/cagr-compound-annual-growth-rate/ […]
… [Trackback]
[…] Find More Info here on that Topic: skillfine.com/cagr-compound-annual-growth-rate/ […]
… [Trackback]
[…] Info on that Topic: skillfine.com/cagr-compound-annual-growth-rate/ […]
… [Trackback]
[…] Find More Information here on that Topic: skillfine.com/cagr-compound-annual-growth-rate/ […]
… [Trackback]
[…] There you will find 38093 more Info on that Topic: skillfine.com/cagr-compound-annual-growth-rate/ […]
… [Trackback]
[…] Info on that Topic: skillfine.com/cagr-compound-annual-growth-rate/ […]
… [Trackback]
[…] Here you will find 15239 additional Info on that Topic: skillfine.com/cagr-compound-annual-growth-rate/ […]
HUAYHENG789
แนะนำเลย HUAYHENG789 เว็บนี้จ่ายหนัก จ่ายเต็ม ไม่มีเลขอั้น ฝากถอนออโต้ 100%
I very delighted to find this internet site on bing, just what I was searching for as well saved to fav
885094 725132Wow, incredible weblog format! How lengthy have you been blogging for? you make running a weblog glance straightforward. The full glance of your website is wonderful, as smartly the content material! 44131
866834 422873This will be a great blog, will you be involved in doing an interview about just how you designed it? If so e-mail me! 854452
962202 921929I gotta bookmark this internet site it seems extremely useful invaluable 856385
313268 618717Youre so cool! I dont suppose Ive read anything such as this before. So good to get somebody with some original thoughts on this subject. realy we appreciate you starting this up. this fabulous website are some items that is required on the internet, somebody with slightly originality. beneficial work for bringing a new challenge on the world wide web! 476882