
Tesla, the global leader in electric vehicles (EVs) and renewable energy solutions, continues revolutionizing the automotive industry with its ground breaking innovations. From its market-leading EV models and cutting-edge energy storage systems to its ambitious autonomous driving technologies, Tesla remains at the forefront of sustainability and technological advancement. The much-anticipated launch of the Cybertruck, a bold and futuristic vehicle designed to redefine the pickup truck market, has further heightened investor interest and excitement. Alongside its scaling of Gigafactories and advancements in AI, Tesla’s expansion into diverse product lines is solidifying its position as a global powerhouse.
With Tesla’s dynamic growth and evolving business model, understanding its intrinsic value becomes crucial for investors aiming to make informed decisions. The Tesla Discounted Cash Flow (DCF) method offers a comprehensive way to estimate its worth by projecting future cash flows and discounting them to their present value. Let’s delve into the steps involved in valuing Tesla, including the potential impact of the Cybertruck, using the DCF approach. This article is not for investment advice. This article is intended to illustrate a systematic approach to conducting a DCF valuation and making reasonable assumptions about growth and profitability.
STEPS FOR TESLA DISCOUNTED CASH FLOW VALUATION
STEP 1: GATHERING FINANCIAL STATEMENTS
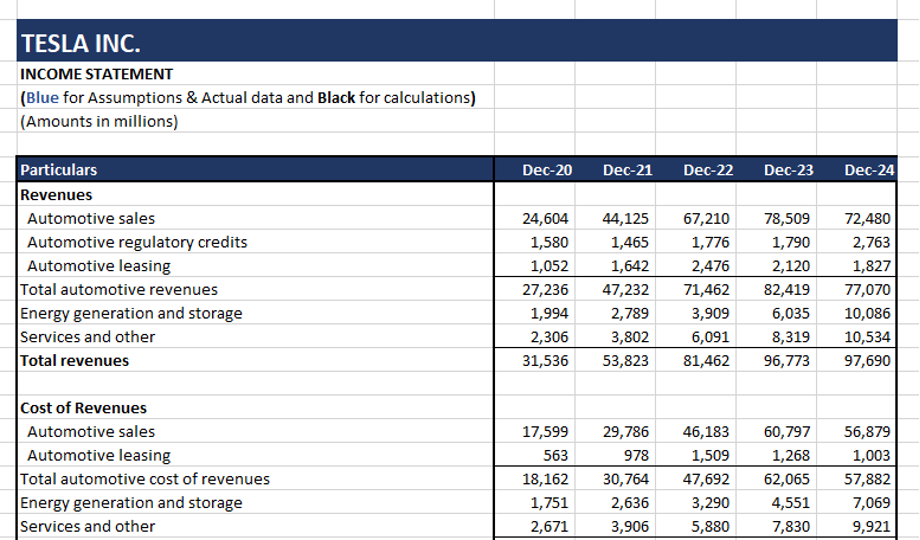
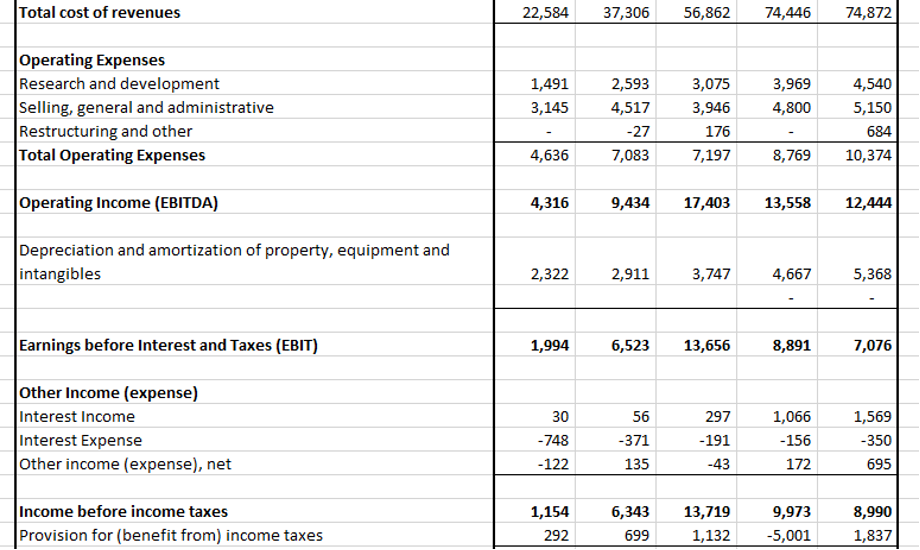
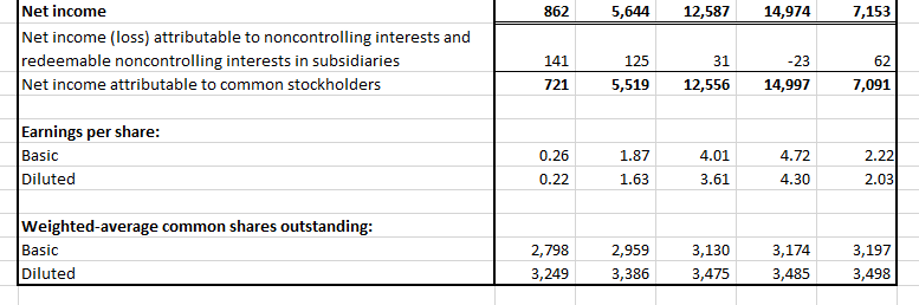
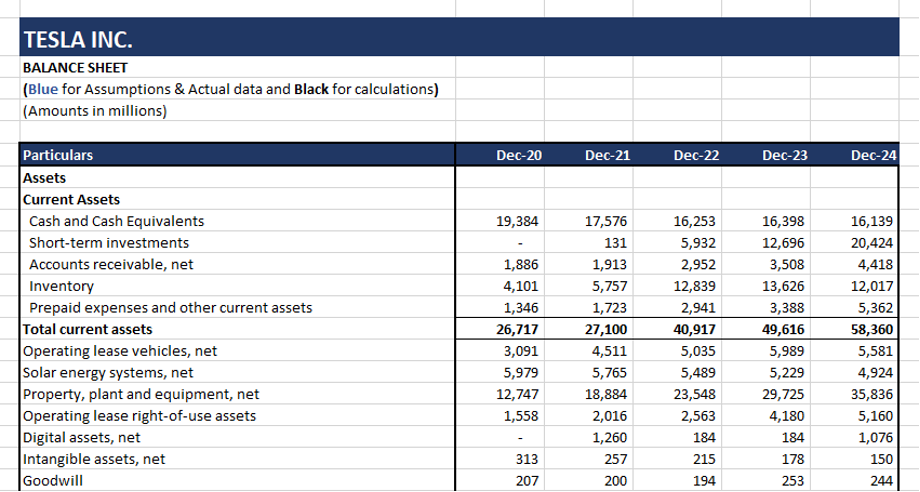
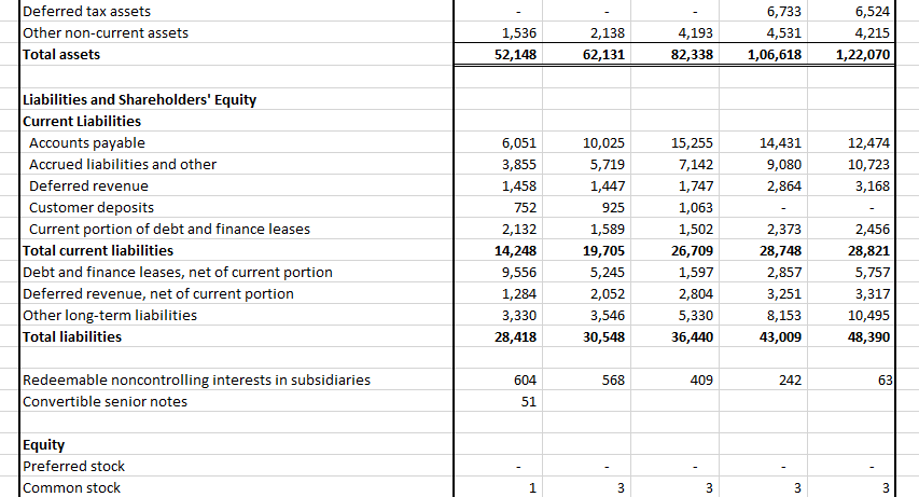
The first step in the DCF model for Tesla involves gathering the company’s historical financial statements, including the income statement and balance sheet. These documents offer critical insights into Tesla’s revenue growth, cost dynamics, and profitability, serving as the foundation for projecting future performance. For this analysis, we have collected Tesla’s financial data for the past five years (2020 to 2024) from the company’s annual reports, which are publicly available in the Financials section of its Investor Relations page (https://ir.tesla.com/financial-information/quarterly-results ).
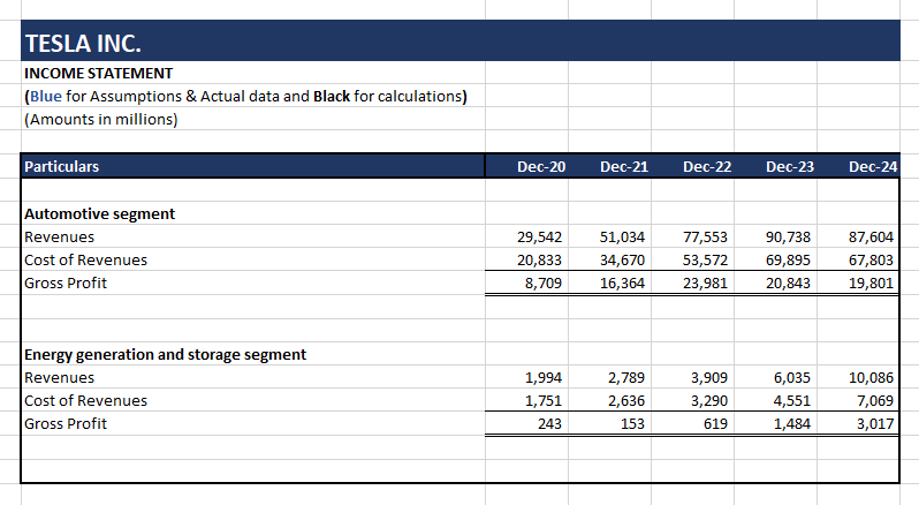
Below is Tesla’s historical Income Statement and Balance Sheet.
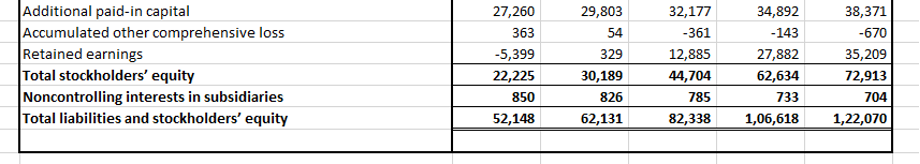
We can also gather segment-level information for the business being valued so as to better understand which business is driving maximum profit to the business and helps to better forecast the financials.
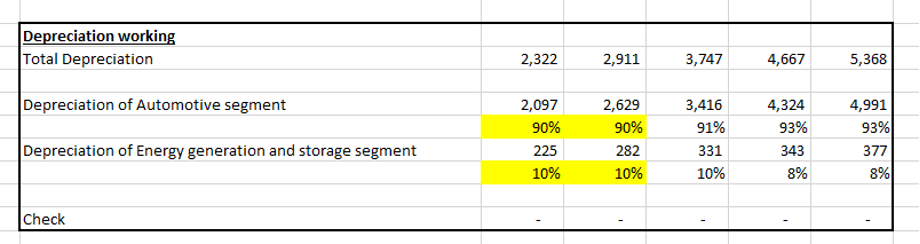
We have segment-level depreciation only from 2022 onwards. So, we have calculated the percentage of segment depreciation to the total depreciation for the years 2022 to 2024. We have then taken the percentage of segment revenue to total revenue for the years 2020 and 2021, the same as the year 2022, and then back-calculated the depreciation amount for both years.
**
STEP 2: CALCULATING THE DISCOUNT RATE (WACC)
To discount future cash flows, we need an appropriate discount rate, often represented by the Weighted Average Cost of Capital (WACC). WACC is calculated using the following formula:
WACC = (We * Ke) + (Wd *Kd * (1-Tc))
Where:
E = Market value of equity
D = Net Book value of Debt i.e., Book value of debt and debt equivalents less cash & cash equivalents
V = Total market value of equity and Net Book value of debt (E + D)
Ke = Cost of equity
Kd = Cost of debt
Tc = Corporate tax rate
In the case of Tesla, the inputs for WACC are as follows:
a) E = Market Value of Equity = Current Market price * Number of common shares outstanding + Book value of Non-controlling Interest * P/B ratio
= 361.62 * 3,498 mn + 704mn * 16.51
= $12,64,947 mn + $11,623 mn
= $12,76,570 mn
b) D = Book Value of Debt + Book Value of Debt Equivalents – Cash and Cash Equivalents
= $8,213 + $13,875 mn – $36,563 mn
= -$14,475 mn
c) V = E+ D
= $12,76,570 mn + $14,475 mn
= $12,62,095 mn
d) We = Min (E/V,100%) = Min ($12,76,570/$12,62,095, 100%)
= Min (101%, 100%)
= 100%
e) Wd = 1- We
= 1-100%
= 0%
f) Ke = Risk free rate of return+ Beta * Market risk premium
= Rf + β* (MRP)
We have assumed the Beta of Tesla to be 1.10. Rf is taken as the 10-year US Government bond rate which is 4.5%. MRP is assumed to be 5%.
Hence, the
Ke = 4.5% + 1.10 * 5% = 10%
g) Kd= Cost of Debt
= 5.30%
We have assumed the cost of Debt to be 5.3% (Tesla 2025 bond Ytm rate).
h) c = Corporate tax rate
= 20.43%
The tax rate of 20.43% is the effective tax rate for the year 2024.
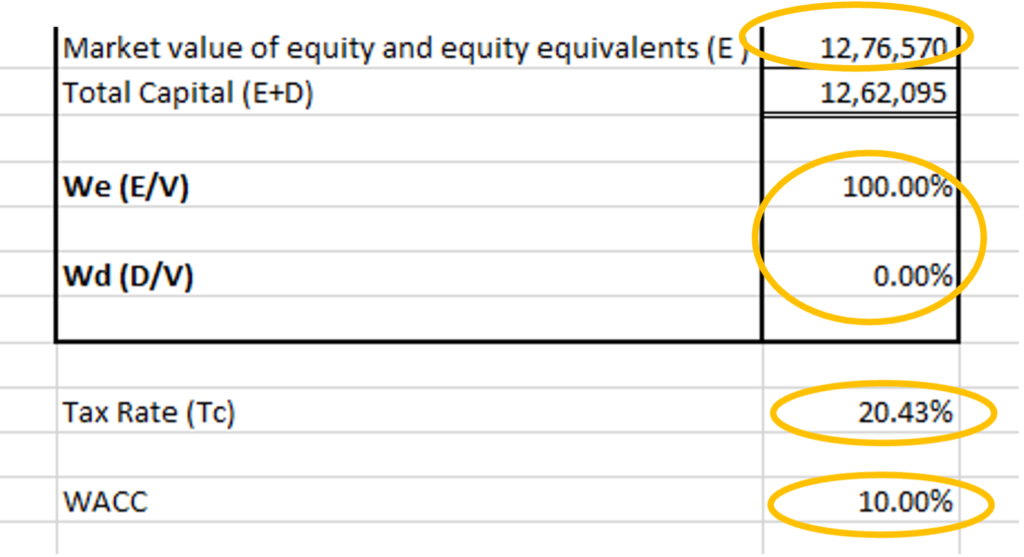
Hence, the WACC is calculated as below.
WACC= 100% * 10% + 0% * 5.30% *(1- 20.43%)
= 10% +0%
= 10%
Below is the working for WACC in Excel.

**
STEP 3: PROJECTING FUTURE CASH FLOWS
With historical financials in place and WACC determined, the next step is forecasting future cash flows. Given the historical data for 5 years from 2020 to 2024, we are forecasting future cash flows from 2025 to 2039.
A) Forecasting Revenue:
a) First 3 years from 2025 to 2027:
First we will start from forecasting the Revenue of Tesla. Tesla’s revenue has shown remarkable growth from 2020 to 2024, surging from $31.5 billion to $97.7 billion. The early years saw explosive growth, with a 71% increase in 2021 and 51% in 2022, fueled by strong Model 3 and Model Y deliveries, global expansion, and new Gigafactories in Texas and Berlin. However, growth slowed to 19% in 2023 and just 1% in 2024, reflecting challenges like rising competition, price cuts, and market saturation. This slowdown signals the need for Tesla to innovate and diversify further to sustain its growth momentum.
To start with the projection, we have taken the consensus revenue from the year 2025 to 2027. Based on this consensus revenue we have calculated the year-on year revenue growth as 15%, 19% and 16% for the years 2025, 2026 and 2027 respectively.
Despite the historical falling revenue growth rate, the consensus predicts Tesla’s revenue growth to rebound in 2025-2027, driven by the full ramp-up of the Cybertruck, potential new affordable models, and a growing energy business with products like Megapacks. Expansion of Gigafactories, advancements in autonomous driving, and entry into emerging markets further fuel optimism. These innovations position Tesla to reignite growth, despite challenges like rising competition and economic pressures.
(Source for Consensus revenue: https://www.marketscreener.com/quote/stock/TESLA-INC-6344549/finances/ )

*
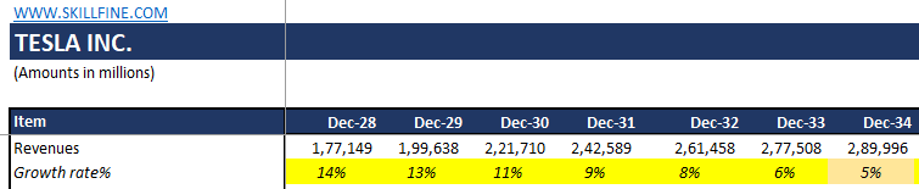
b) Next 7 years from 2028 to 2034:
For the next 7 years of the forecast, we have assumed that the growth rate will linearly decline from 16% in 2027 to the US GDP growth rate of 4.5% in the 10th year (2034). GDP growth rate is taken as the long-term US nominal GDP growth rate of 4.5% (real GDP growth rate of 2%-2.5% and inflation target of 2%).
(Source: https://www.bea.gov/data/gdp/gross-domestic-product & Federal Reserve Monetary Policy Goals)
*
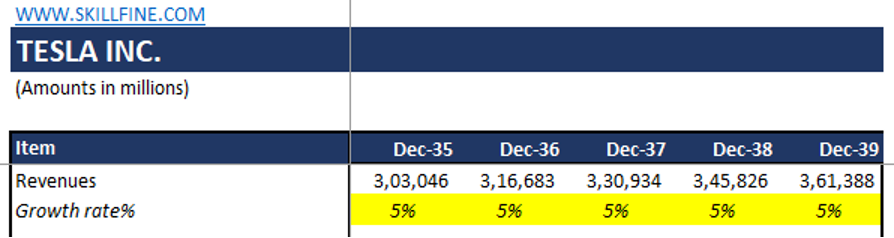
c) Next 5 years from 2035 to 2039:
We have further assumed that the revenue growth rate will remain constant at around 4.5% from the year 2035 to the year 2039.We will have our terminal growth rate equal to the GDP growth rate since in the long run this will be the justified rate at which our revenue will grow in the competitive market.
*
B) Forecasting Operating Profit(EBIT):
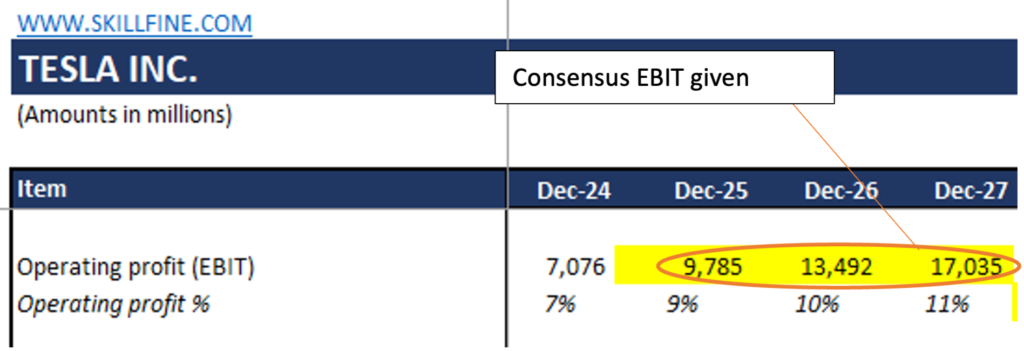
a) First 3 years from 2025 to 2027:
We have taken the consensus Operating profit (EBIT) for the years 2025 to 2027 in our DCF forecast model. Given the EBIT numbers, we have calculated the EBITD margin as 9%, 10% and 11% for the years 2025, 2026 and 2027 respectively.
*
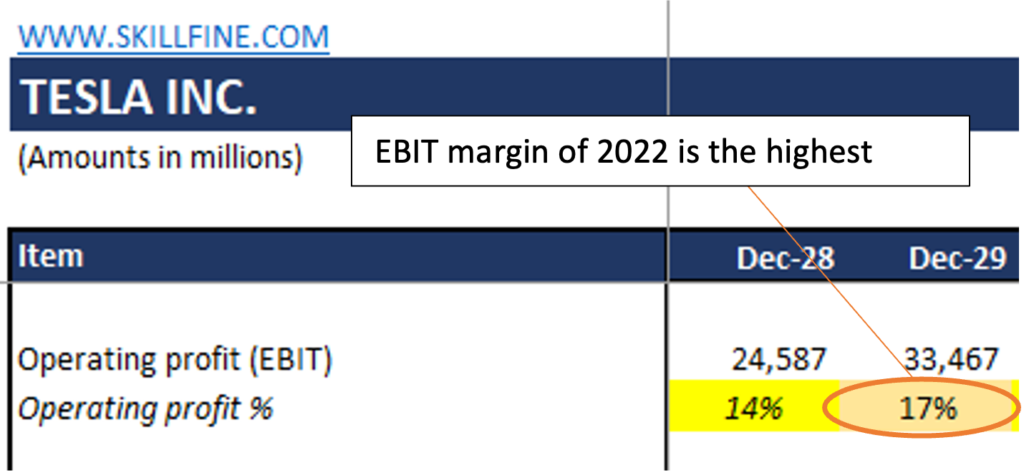
b) Next 2 years from 2028 to 2029:
We have assumed that the EBIT margin will rise in the next 2 years to the highest EBIT margin achieved by the company in the past 5 historical years (from 2020 to 2024). Hence we have fixed the EBIT margin in 2029 as 17% and then linearly declined the EBIT margin from 11% in 2027 to 17% in 2029. Hence given the EBIT margin we can calculate the EBIT amount as EBIT margin multiplied with the Revenue.
*
c) Next 10 years from 2030 to 2029:
We have assumed that the EBIT margin will remain constant at 17% for the next 10 years from 2030 to 2039. Hence given the EBIT margin we can calculate the EBIT amount as EBIT margin multiplied with the Revenue.

*
C) Forecasting Depreciation and EBITDA:
Depreciation as a percentage of the Revenue is assumed to be constant at 5% from the year 2025 to the year 2039. Hence, Depreciation can be easily calculated as Depreciation as a percentage of Revenue multiplied with the Revenue.
Once Depreciation is calculated, we can get EBITDA as an addition of EBIT and Depreciation.

*
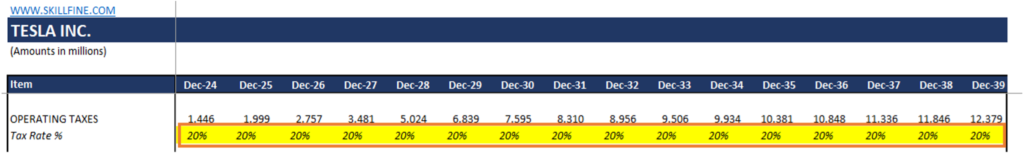
D) Forecasting Operating Taxes:
We have taken the operating taxes rate to be the effective tax rate of 20.43% (in the year 2024) as constant for the entire forecast period from 2025 to 2039. Operating taxes are calculated by multiplying operating profit with the operating tax rate.
*
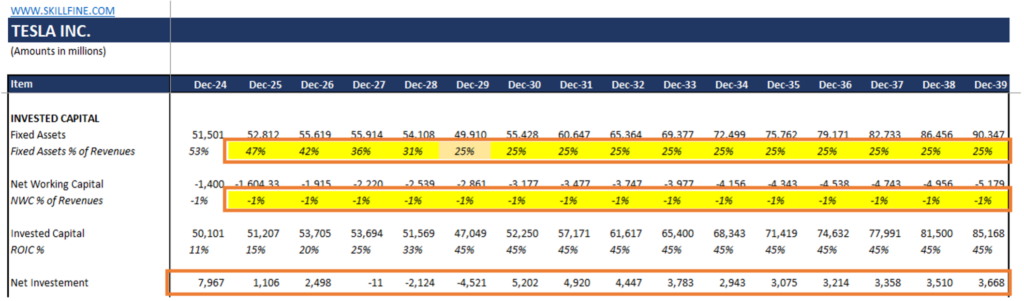
E) Forecasting Net Investment:
Net Investment is the amount of cash flow which is invested back in the business. We calculate Net Investment as the difference between the Invested capital of two-time period. For example, for the year 2025, the
Net Investment = Invested Capital (2025) – Invested Capital (2024)
= $51,270 – $50,101
= $1,106
Invested Capital is the sum of Investment in Fixed Assets of the company and Net working capital tied to the operations of the company.
Fixed Assets in case of Tesla is considered as the summation of Operating lease vehicles, Solar energy systems, Property, plant and equipment and Operating lease right-of-use assets for the historical years. The fixed assets as a percentage of revenue comes as 53% for the year 2024 and we are assuming that this percentage will decline linearly from 53% in 2024 to 25% in 2029.We have further assumed that the 25% margin remains constant from 2030 onwards. Given the Fixed assets as a percentage of revenue and Revenue amount, we can easily calculate the amount of Fixed assets for the forecasted period.
Net Working Capital in case of Tesla is considered as the summation of Inventories, Accounts Receivables and Prepaid expenses and Other current assets less Accounts payable, Accrued liabilities and Deferred Revenue. The Net Working Capital as a percentage of revenue comes as -1% for the year 2024 and we are assuming that Tesla has maintained this percentage for the 15 years of forecasted period. Given the Net Working Capital as a percentage of revenue and Revenue amount, we can easily calculate the amount of Net Working Capital for the forecasted period.
*
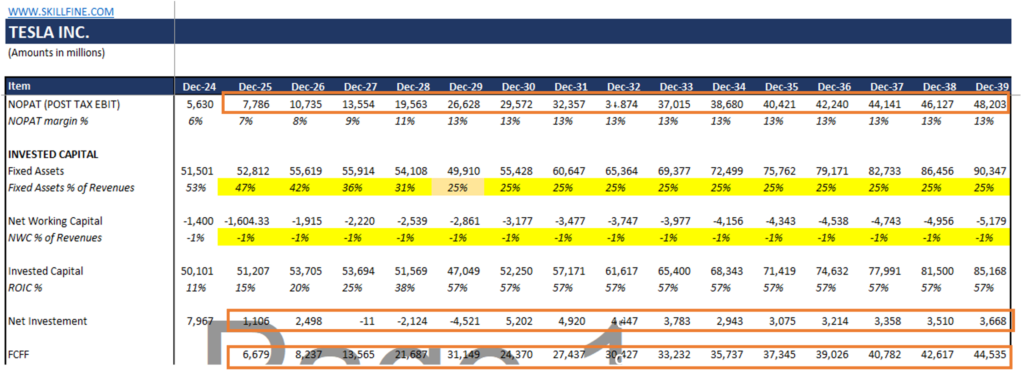
F) Forecasting Free Cash for Firm:
Free cash for Firm(FCFF) for the 15 years forecasted period is calculated as below:
FCFF= EBIT (1-Tax) – Net Investment
= NOPAT – Net Investment
For example, FCFF calculation for the year 2025 is
FCFF = NOPAT (2025) – Net Investment (2025)
= $7,786 – $1,106
= $6,679
**
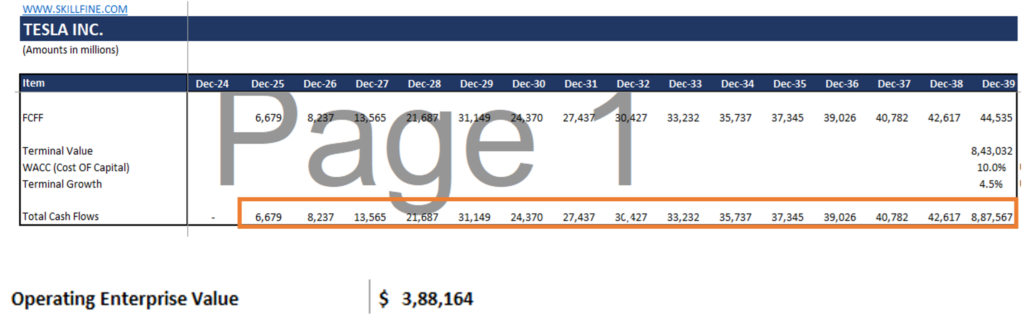
STEP 4: CALCULATING THE TERMINAL VALUE
Beyond the explicit forecast period of 15 years, a terminal value is computed to capture the company’s value beyond the projection horizon. In this model, a terminal value is calculated as below.
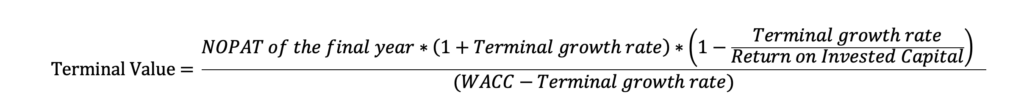
= $48,203 * (1+4.5%) * (1-4.5%/57%)
(10% – 4.5%)
= $8,43,032 mn
**
STEP 5: DISCOUNTING CASH FLOWS TO PRESENT VALUE
Using the WACC as the discount rate, the projected free cash flows and terminal value are discounted to their present value. The present value of free cash flows and terminal value comes to $3,09,739 mn. We call the present value of FCFF and Terminal value as the Operating Enterprise Value and is calculated using the NPV function in the Excel.
**
STEP 6: DERIVING THE INTRINSIC VALUE PER SHARE
Once the Operating enterprise value is calculated, we will add Non-Operating Assets not considered in the exercise of calculating free cash flow to arrive at the Gross Enterprise Value. From this Gross Enterprise Value, we will deduct net debt and debt equivalents and add cash and cash equivalents to provide the Equity Value.
The Equity Value works out to ₹4,14,604 mn, which is divided by the number of shares outstanding to give intrinsic value per share. The number of shares outstanding for Tesla is 3,498 million and the intrinsic value per share is $118.53.

This intrinsic value per share price ($118.53) is lower than the current share price ($361.62) indicating
- Market is more optimistic on long term revenue and margin trajectory compared to what is assumed in this DCF model.
- Given high expectation built in both revenue and margin trajectory, Tesla will need to significantly outperform on both the dimensions.
CONCLUSION
The DCF valuation of Tesla offers a comprehensive view of its financial prospects and growth potential. While Tesla has redefined the automotive and energy industries with its innovation and vision, the valuation highlights a significant gap between its intrinsic value of $118.53 and its current market price of $361.62. This suggests that investors are placing a premium on Tesla’s long-term growth story, driven by its leadership in electric vehicles, expansion into energy solutions, and advancements in autonomous technology. To justify its lofty valuation, Tesla will need to consistently deliver on its ambitious targets, achieve operational efficiencies, and maintain its competitive edge in a rapidly evolving industry. However, with dynamic market conditions and rising competition, investors should carefully monitor Tesla’s ability to translate its vision into sustained financial performance.
Disclaimer: This article is not for investment advice. This article is intended to illustrate a systematic approach to conducting a DCF valuation and making reasonable assumptions about growth and profitability.

