Financial statements are crucial for assessing a company’s financial health, but when it comes to oil and gas companies like ExxonMobil, they reveal a distinct picture compared to typical product or service-based firms. The oil and gas industry is volatile, and heavily influenced by fluctuating commodity prices, regulatory challenges, and capital-intensive operations. Unlike traditional companies that control prices and revenue, oil and gas financial statements are at the mercy of market-driven commodity prices. Their financial statements reflect this through unique metrics, such as exploration expenses, reserve depletion, and fluctuating asset values. Additionally, oil and gas companies are balance sheet-centric, much like banks and insurance firms, as their reserves—critical to future revenue—are key assets. A notable difference is the depleting nature of assets; as oil and gas companies extract resources, their valuable reserves diminish over time, directly affecting their asset base. In this article, we’ll explore how ExxonMobil’s income statement, balance sheet, and cash flow statement highlight the industry’s unique challenges and opportunities, offering insights into what sets oil and gas financials apart from other sectors.
HOW IS THE INCOME STATEMENT OF AN OIL AND GAS COMPANY DIFFERENT FROM OTHER COMPANIES?
The income statement of an oil and gas company diverges sharply from that of typical product and service firms by emphasizing revenue derived from the complex realms of upstream, midstream, and downstream operations rather than straightforward sales. For instance, ExxonMobil’s income statement reveals revenues categorized by exploration and production activities (upstream), transportation and storage (midstream), and refining and marketing (downstream). Expenses are not limited to operational costs; they also encompass hefty exploration costs and significant production expenditures tied to extracting resources from the ground. Furthermore, oil and gas companies face unique challenges such as fluctuating commodity prices that can dramatically impact revenue streams. The inclusion of charges for depleting assets and asset retirement obligations adds another layer of complexity. This distinct blend of revenue sources and expense categories highlights the intricate relationship between resource extraction, market volatility, and operational costs, setting the oil and gas income statement apart from that of traditional firms.
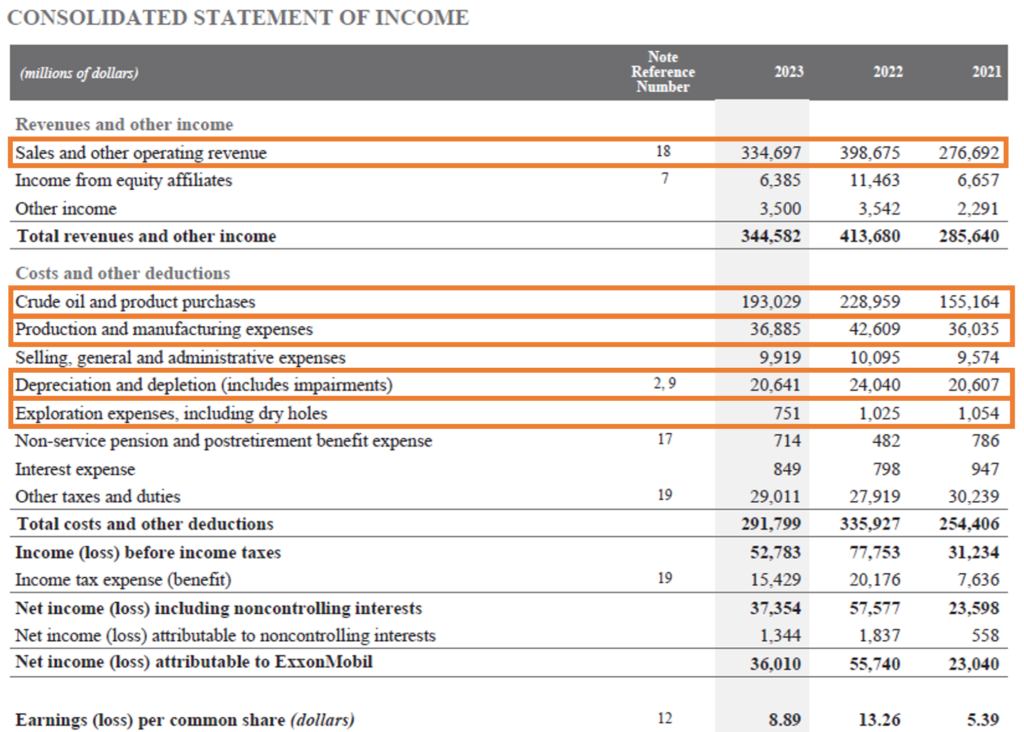
Let’s us have a look at ExxonMobil’s Income Statement and Statement of Comprehensive Income for the fiscal year 2023. The company provides figures for the fiscal year 2022 alongside the 2023 data to facilitate year-on-year comparisons. The income statement of an oil and gas company is heavily influenced by fluctuating commodity prices, which directly impact revenues from its upstream, midstream, and downstream operations. Additionally, significant factors include exploration and production expenses, costs associated with asset retirement obligations, and depreciation of depleting reserves. Changes in global demand, geopolitical events, and regulatory frameworks can also significantly affect financial outcomes and reporting. These elements combine to create a dynamic income statement that reflects the unique challenges and opportunities within the oil and gas sector.
Source: Annual Report https://investor.exxonmobil.com/sec-filings/annual-reports/content/0001193125-24-092555/0001193125-24-092555.pdf
The key items of the income statement of an Oil and Gas company include:
1. Sales and other operating revenue: The main source of revenue for an oil and gas company comes from the sale of crude oil, natural gas, refined petroleum products, and midstream activities such as transportation, storage, and processing of these resources. Revenue is typically categorized by upstream activities (exploration and production), midstream (transportation and storage), and downstream (refining and marketing).
For ExxonMobil, revenue is generated from four key segments: Upstream, focused on the extraction of crude oil and natural gas; Energy Products, which includes the sale of fuels and catalysts; Chemical Products, involving the production of olefins and polyolefins; and Specialty Products, which offers finished lubricants, waxes, and resins. Together, these categories reflect ExxonMobil’s broad revenue streams, from the extraction of resources to the sale of petroleum products and petrochemicals, with additional earnings from midstream operations and corporate interest revenue. The total sales and other operating revenue for ExxonMobil in the year 2023 is $334,697 million.
2. Crude oil and product purchases: This represents the costs incurred by the company for acquiring raw crude oil and other petroleum products. These purchases are necessary for refining and producing the final products sold by the oil and gas company. This line item is a significant part of the company’s cost structure, reflecting its global trading and refining activities. This cost is $193,029 million for ExxonMobil in the year 2023 and is almost 56% of the total revenue.
3. Production and manufacturing expenses: This refers to the costs incurred to extract crude oil and natural gas and transform them into marketable products. These include labour, materials, and other operational costs directly associated with production facilities and manufacturing operations. For example, in 2023, ExxonMobil reported $36,885 million in production and manufacturing expenses, which reflects the scale of its global operations in upstream and downstream segments, contributing to its overall operational costs.
4. Depreciation and depletion (includes impairments): This refers to the allocation of the cost of the company’s long-term assets over their useful lives. Depreciation applies to tangible assets like equipment and facilities, while depletion relates to the gradual consumption of natural resources, such as oil and gas reserves. Impairment occurs when the carrying value of these assets exceeds their recoverable amount, leading to a write-down. Together, these expenses amount to $20,641 million and reflect the wear and tear, usage, and reduction in value of ExxonMobil’s assets used in production and extraction activities.
The depreciation and depletion costs in oil and gas companies are particularly large because these companies heavily invest in large-scale, capital-intensive assets like oil rigs, refineries, and exploration equipment. Additionally, they deal with natural resources, which diminish over time as they are extracted. The need to explore, extract, and refine resources, along with maintaining vast infrastructure, results in high depreciation and depletion costs. These expenses are crucial for oil and gas companies as they reflect the gradual reduction in the value of physical assets and natural reserves, impacting overall profitability and financial reporting.
5. Exploration expenses, including dry holes: This represent the costs involved in searching for new oil and gas deposits. These expenses cover the drilling of exploratory wells, which may or may not lead to the discovery of commercially viable reserves. If no economically recoverable resources are found, the well is considered a “dry hole,” and the full cost associated with it is charged as an expense. For 2023, these expenses amounted to $751 million, indicating ExxonMobil’s significant investment in finding new resources despite the inherent risk of unsuccessful exploration.
SEGMENT REPORTING OF OIL AND GAS FINANCIAL STATEMENTS
Segment reporting is crucial for understanding the financial figures of a company as it breaks down revenues, expenses, and profits by distinct business operations. For diversified companies like ExxonMobil, segment reporting provides clarity on how different areas contribute to overall performance, enabling investors and stakeholders to assess the profitability and risks associated with each segment. It also offers insights into the company’s operational focus and strategic priorities.
ExxonMobil organizes its financials into four main segments: Upstream, focusing on the exploration and production of crude oil and natural gas; Energy Products, which includes fuels, aromatics, and catalysts; Chemical Products, involving olefins, polyolefin, and intermediates; and Specialty Products, which offers lubricants, synthetics, and resins. The company also reports financial figures according to geographic segments i.e., US and Non US segment as can be seen in the segment report below. This segmentation highlights the diverse revenue streams and expense structures tied to each operation, reflecting the company’s comprehensive involvement in the oil and gas value chain. Such detailed reporting enables a deeper analysis of ExxonMobil’s financial health and operational efficiency across its key business areas.
Below is the Segment Financial Reporting done by ExxonMobil.
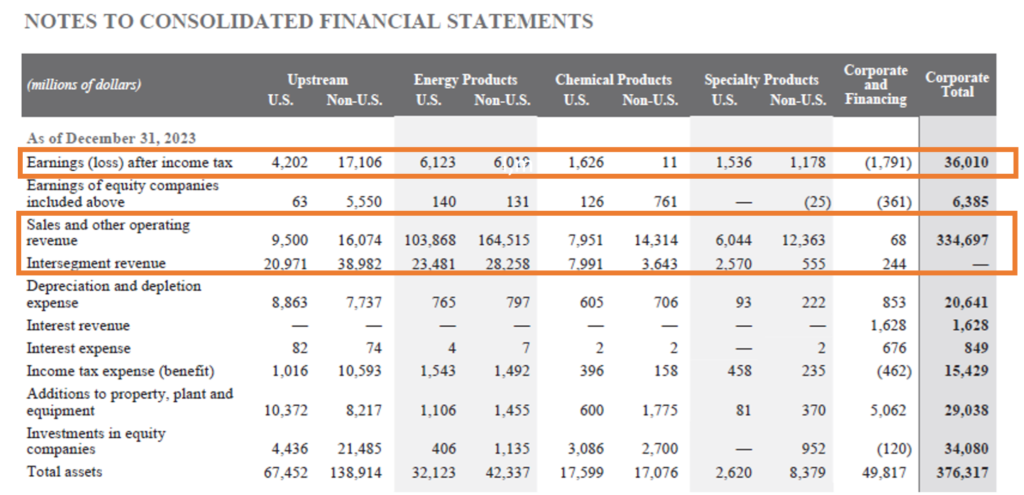
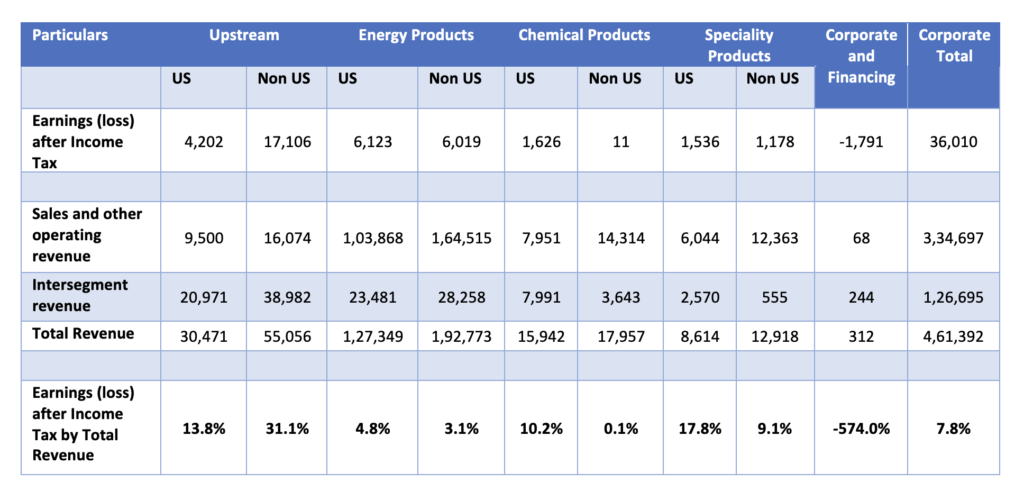
From above we can see that the company has major revenue coming from Energy products segment specially from the Non US locations. However, when we look at the Earnings (loss) after Income Tax reported for each segment, we find that the company has major Net profit margin generated form the Upstream segment. Hence, to find the best performing segment in terms of net profit generated we should calculate the Net Profit Margin for each segment (refer below).
HOW IS THE BALANCE SHEET OF AN OIL AND GAS COMPANY DIFFERENT FROM OTHER COMPANIES?
The balance sheet of an oil and gas company differs from that of a standard product or service company in several important ways. While standard items like assets and liabilities are present, oil and gas firms deal with unique factors such as Derivative Fair Value, which shows up across various sections of the balance sheet. These derivatives stem from hedging contracts that protect the company against volatile commodity prices. Additionally, Property, Plant & Equipment (PP&E) is more complex, often divided into categories like Proved, Probable, and Possible Reserves, with significant accumulated depreciation, depletion, and amortization. Oil and gas firms also carry significant Asset Retirement Obligations, which represent future costs for closing down wells and fields, a liability uncommon in most other industries.
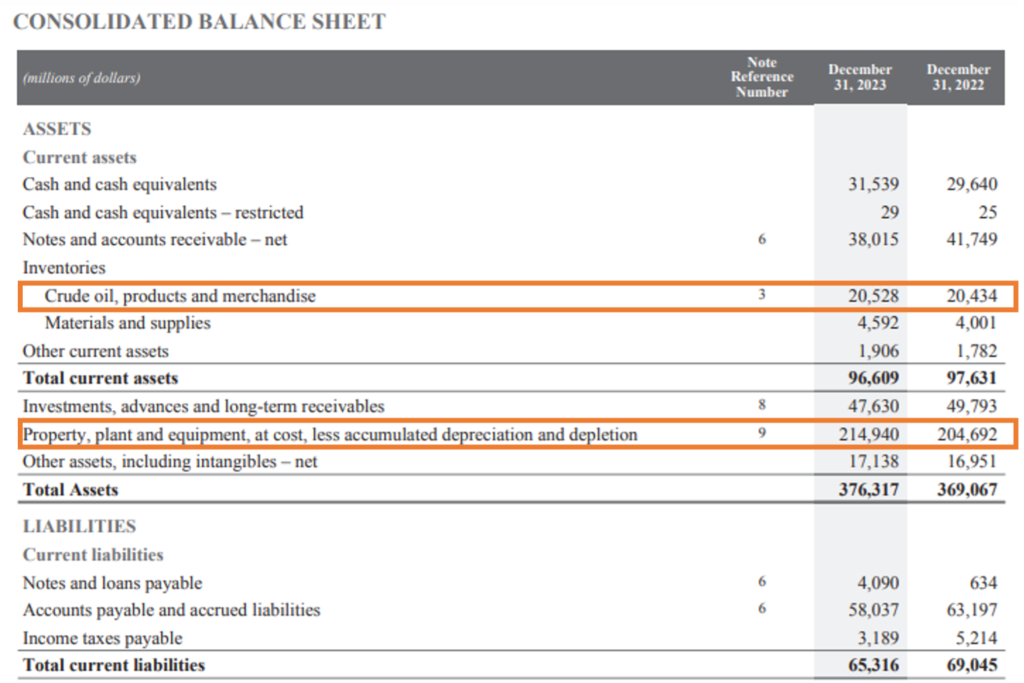
Continuing the above example, let us study the Consolidated Balance Sheet of ExxonMobil. Below is the Consolidated Balance Sheet of the ExxonMobil.
Source: Annual Report https://investor.exxonmobil.com/sec-filings/annual-reports/content/0001193125-24-092555/0001193125-24-092555.pdf
The main components of an oil and gas company’s balance sheet consist of various assets, liabilities, and equity items that represent its overall financial standing. Here are the main components:
Assets
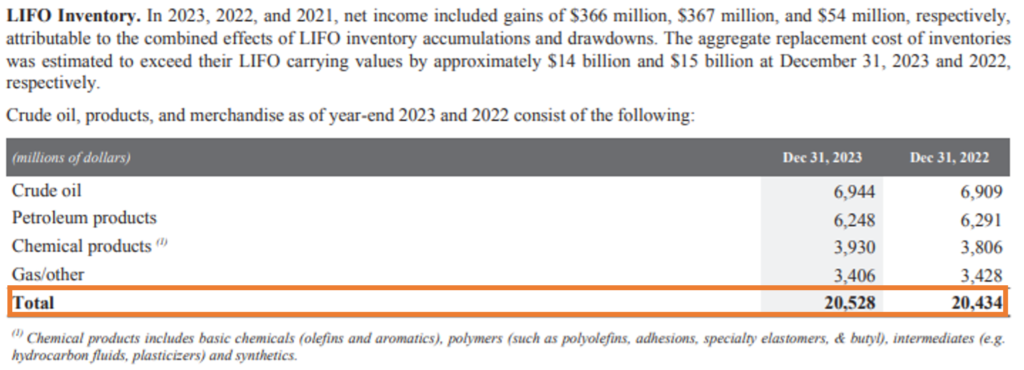
1. Inventories (Crude oil, products, and merchandise): This includes different types of physical stock the company maintains. It includes crude oil, refined petroleum products, chemical products, and other gas-related products. Crude oil refers to the raw material awaiting refining, while petroleum and chemical products represent finished or intermediate products ready for sale. These inventory items are critical to ExxonMobil’s operations, as they represent resources for processing and eventual sale to customers. Inventory costs encompass expenses and other charges (including depreciation) that are directly or indirectly incurred to bring the inventory to its current state and location. Crude oil, products, and merchandise inventories are valued at the lower of cost or current market value, with the cost generally calculated using the last-in, first-out (LIFO) method.

Source: Annual Report https://investor.exxonmobil.com/sec-filings/annual-reports/content/0001193125-24-092555/0001193125-24-092555.pdf
2. Property, plant and equipment (PP&E), at cost, less accumulated depreciation and depletion: It includes a wide range of capital expenditure assets used for exploration, production, refining, and chemical operations. These assets encompass oil rigs, wells, refineries, and chemical plants, all of which are vital for the company’s operations. Assets are initially recorded at cost, and their values are gradually reduced over time through depreciation and depletion as they are utilized.
ExxonMobil uses the “successful efforts” method for accounting its exploration and production activities, meaning costs are accumulated on a field-by-field basis. Costs to purchase or lease properties are capitalized, and exploratory well costs are carried as an asset if the well discovers sufficient proved reserves to justify development. Exploratory wells related to unproved reserves, which lack certainty, may be expensed if reserves cannot be economically or operationally justified. Interest costs incurred during the construction phase of multiyear projects are also capitalized as part of the asset’s cost. This method ensures that PP&E reflects not only physical assets but also development costs associated with acquiring and constructing long-term infrastructure. The net PP&E amount for ExxonMobil in year 2023 is $214,940 million.


Source: Annual Report https://investor.exxonmobil.com/sec-filings/annual-reports/content/0001193125-24-092555/0001193125-24-092555.pdf
Liabilities
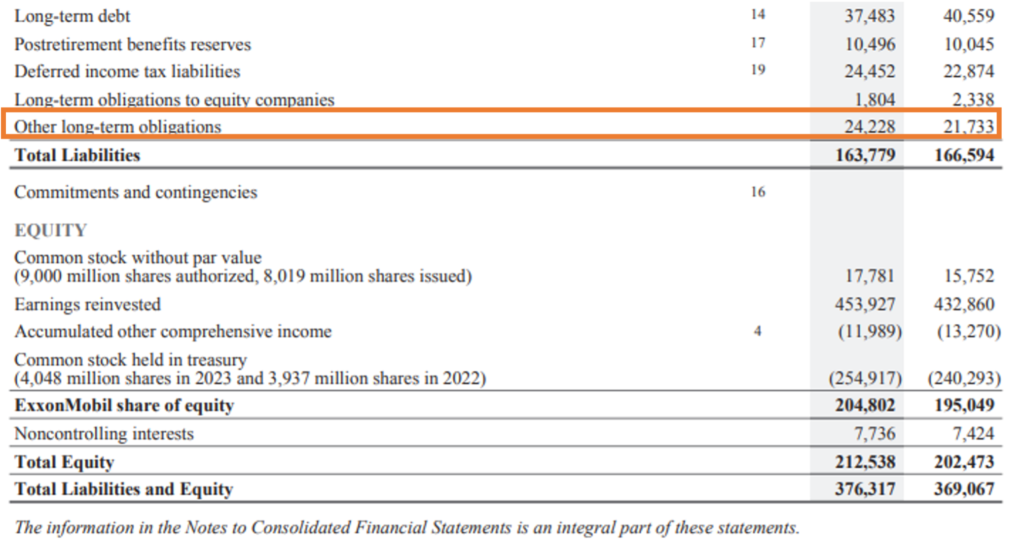
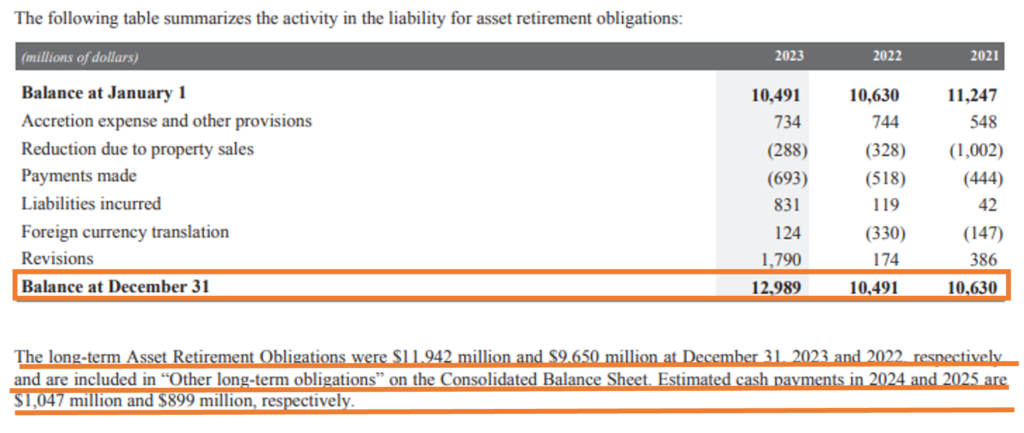
1. Other long-term obligations: Other Long-Term Obligations consist of various liabilities that the company anticipates settling over an extended period. In case of ExxonMobil A significant portion of this category is made up of Asset Retirement Obligations (ARO), which represent the company’s legal obligations to dismantle and restore production sites at the end of their useful lives. As of December 31, 2023, ARO accounted for approximately 49% of the total “Other Long-Term Obligations,” amounting to $11,942 million out of $24,228 million. These costs reflect ExxonMobil’s commitment to responsibly decommissioning its facilities in compliance with environmental regulations.
Source: Annual Report https://investor.exxonmobil.com/sec-filings/annual-reports/content/0001193125-24-092555/0001193125-24-092555.pdf
WHAT IS INCLUDED IN THE CASH FLOW STATEMENT OF AN OIL AND GAS COMPANY?
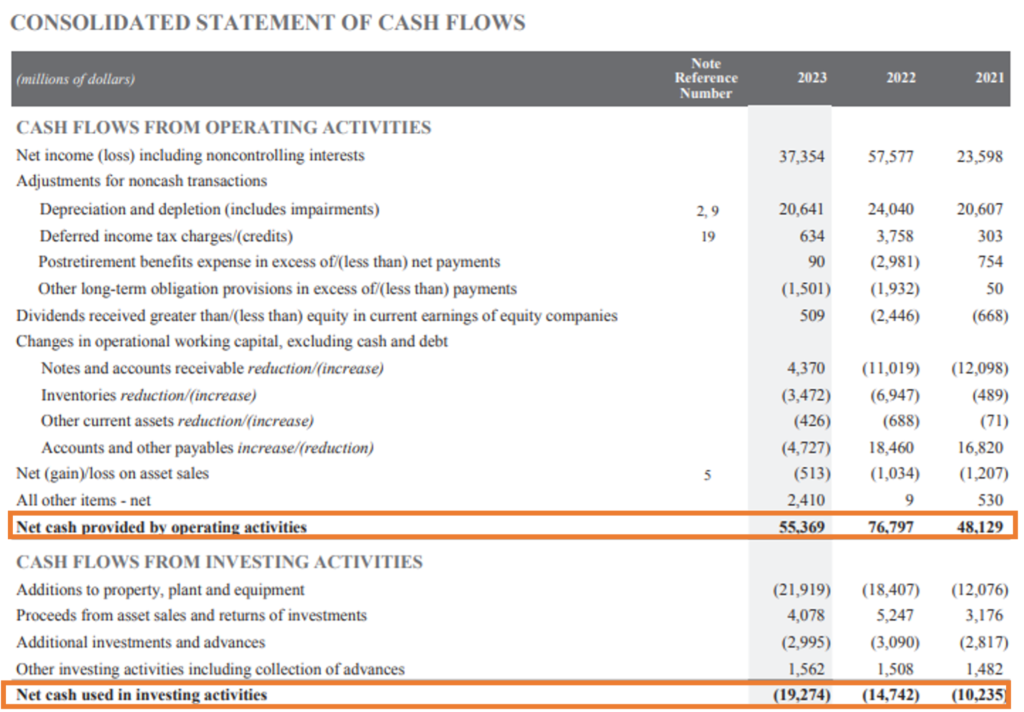
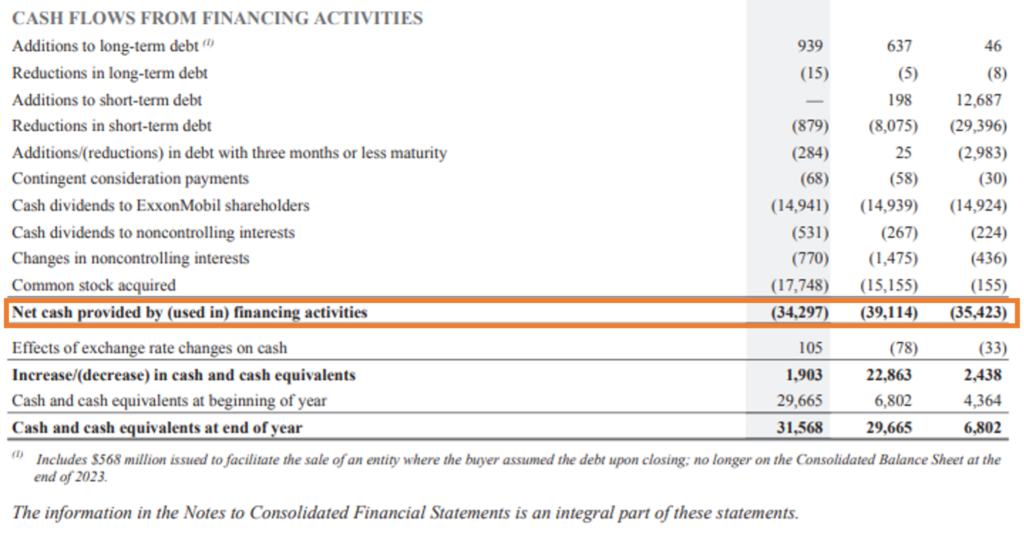
Below is the Consolidated Statement of Cash Flows.
Source: Annual Report https://investor.exxonmobil.com/sec-filings/annual-reports/content/0001193125-24-092555/0001193125-24-092555.pdf
In ExxonMobil’s cash flow statement, three main sections are highlighted:
- Operating Activities: This includes cash generated from Oil and Gas companies core business operations, such as the sale of crude oil, gas, and petroleum products. In 2023, cash provided by operating activities was $55,369 million, which was $21,428 million lower than the previous year, primarily driven by lower net income and working capital adjustments.
- Investing Activities: This section captures the cash used for investments, such as purchasing property, plants, equipment, and proceeds from asset sales. For 2023, ExxonMobil used $19,274 million in cash for investing activities, driven by $21,991 million in capital expenditures for long-term assets.
- Financing Activities: This involves cash flows related to the company’s financial structure, such as paying dividends and repurchasing shares. In 2023, ExxonMobil used $34,297 million in financing activities, including $14,941 million in dividend payments and $17,748 million for share repurchases.
IMPORTANT NOTES FOR OIL AND GAS COMPANY
1. Proved, Probable and Possible reserves: In the financial reporting of oil and gas companies, reserves are categorized as proved, probable, and possible. Proved reserves are quantities of oil and gas that geological and engineering data confirm with reasonable certainty to be recoverable under current economic conditions and regulations. Probable reserves have less certainty but are still likely to be extracted, while possible reserves have the lowest certainty and represent potential resources that may be recoverable under favourable conditions. For ExxonMobil, only proved reserves are capitalized on the balance sheet, contributing to the company’s depreciation, depletion, and amortization (DD&A) expenses. Unproved reserves, such as probable and possible reserves, are not included as assets until further exploration confirms their economic viability. ExxonMobil had total proved reserves of $16,928 million bbls.
2. Asset Retirement Obligation (ARO): It is a significant financial element for ExxonMobil and other oil and gas companies. ARO represents the legal obligation to dismantle and restore production sites after extraction activities conclude. The ARO liability is recognized on the balance sheet, with the associated costs capitalized and gradually expensed over time through accretion and depreciation. In the case of ExxonMobil, ARO accounted for approximately 49% of its total “Other Long-Term Obligations” as of 2023, highlighting the company’s substantial future environmental and site restoration responsibilities.
3. Derivative Fair Value: The fair value of derivatives is a crucial tool for oil and gas companies to manage risks related to fluctuating commodity prices, interest rates, and foreign exchange rates. Since oil and gas prices are determined by the market and can be highly volatile, companies use derivatives such as forwards, futures, and options to hedge against these risks. For instance, a company might enter into a futures contract to buy natural gas at $3 per million British thermal units (MMBtu) for delivery in the future, thereby safeguarding itself against rising prices. The fair value of these derivatives is reflected on the balance sheet as either an asset or a liability. If the contract is favourable, it’s recorded as an asset; if unfavourable, as a liability. While not unique to the oil and gas sector, derivatives are common on their balance sheets due to the industry’s exposure to constant price fluctuations. Derivative fair value ensures that the company’s financial position accurately reflects the market value of its hedging activities. Derivative fair value is not much relevant for ExxonMobil but may be relevant for other small oil and gas company.
KEY RATIOS FOR ANALYZING OIL AND GAS FINANCIAL STATEMENTS
When analysing an oil and gas company, several key financial ratios can provide insight into its performance, financial health, and operational efficiency. Here are some key ratios to take into account:
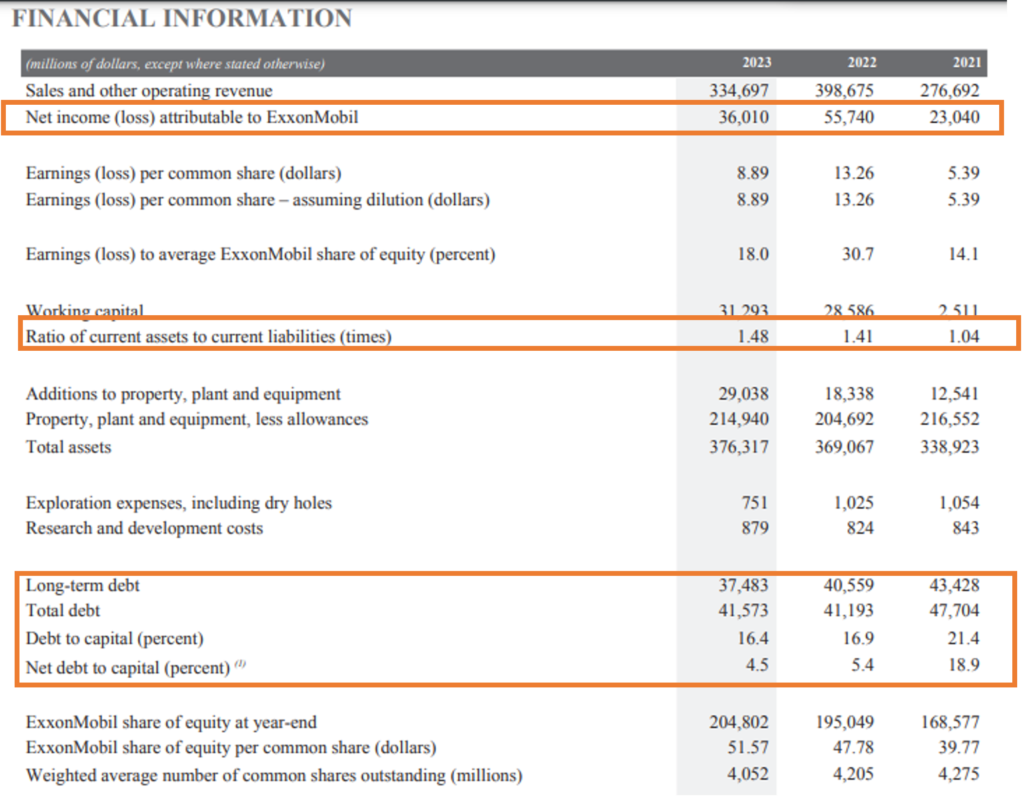
1. Debt-to-Equity Ratio: This ratio assesses the company’s financial leverage by comparing its total debt to the equity held by shareholders. A higher ratio indicates greater financial risk, while a lower ratio suggests a more conservative capital structure. The Debt-to-Equity ratio for ExxonMobil is 20% in the year 2023.
2. Net Debt-to-Capital Ratio: This ratio shows the company’s net debt (debt minus cash) in relation to its total capital. As of 2023, ExxonMobil’s net debt-to-capital ratio was 4.5%, reflecting a strong financial position.
3. Return on Equity (ROE): This ratio indicates how effectively the company is using shareholders’ equity to generate profit. A higher Return on Equity (ROE) indicates greater profitability and more effective utilization of shareholder equity. ExxonMobil’s ROE for 2023 is 17.58%.
4. Return on Capital Employed (ROCE): This measures the company’s efficiency in using its capital to generate profits. It is calculated by dividing net operating profit by total capital employed. A higher ROCE indicates more efficient capital utilization. ExxonMobil has ROCE of 14.92% for the fiscal year 2023.
5. Current Ratio: This liquidity ratio compares current assets to current liabilities, indicating the company’s ability to meet short-term obligations. A ratio greater than 1 indicates strong short-term financial health. Current ratio for ExxonMobil is 1.48 for the fiscal year 2023.
6. Reserve Replacement Ratio (RRR): This ratio compares the amount of proved reserves added to the amount produced over a specific period. A ratio above 100% indicates that the company is replacing more reserves than it is depleting, suggesting sustainable growth.
7. Cash flow from operations to debt ratio: This ratio compares cash generated from operations to total debt, providing insight into the company’s ability to service its debt obligations. ExxonMobil has a Cash Flow from Operations to Debt Ratio of 1.33 in the fiscal year 2023.
8. Net Profit margin: This ratio compares the Earnings (loss) after Income Tax earned by each segment to the Total Revenue generated by each segment. This helps the company focus its operations more towards the segment with the highest Net Profit margin.
Let’s see below the Net Profit Margin calculation of different segments.
These ratios collectively provide a comprehensive view of an oil and gas company’s financial stability, operational efficiency, and growth potential, helping investors make informed decisions.
Source data for calculation of Ratios above:
- Financial Statements in the Annual reports
- https://www.stock-analysis-on.net/NYSE/Company/Exxon-Mobil-Corp/Ratios
- Financial Information in the Annual reports disclosed below
Source: Annual Report https://investor.exxonmobil.com/sec-filings/annual-reports/content/0001193125-24-092555/0001193125-24-092555.pdf
VARIOUS RISK FACED BY AN OIL AND GAS COMPANY AND IMPACT ON THE FINANCIAL STATEMENTS
Here are some major risks faced by oil and gas companies, including ExxonMobil, based on industry standards and typical disclosures:
1. Commodity Price Volatility: Oil and gas companies are highly sensitive to fluctuations in commodity prices, which can significantly impact revenues and profitability. Prices can be influenced by various factors, including geopolitical tensions, natural disasters, changes in supply and demand, and government regulations. For instance, a sudden drop in oil prices could lead to reduced cash flow and may force companies to cut costs, delay projects, or even write down asset values.

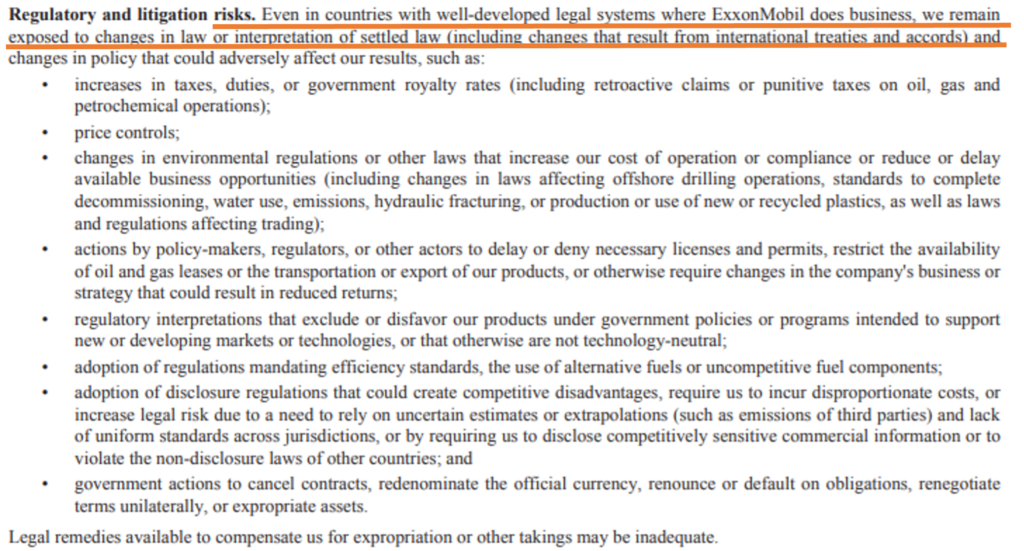
2. Regulatory and Compliance Risks: The oil and gas industry is subject to extensive regulations concerning environmental protection, health and safety, and operational standards. Changes in laws or regulatory interpretations can impose additional costs or operational constraints. Failing to comply can result in legal penalties, interruptions in operations, and harm to the company’s reputation. Companies must navigate a complex web of regulations, which can vary significantly across different countries and regions.
3. Exploration and Production Risks: The process of exploring and extracting oil and gas carries inherent uncertainties. Discovering viable reserves is not guaranteed, and the actual production rates may differ from estimates. Technical challenges, environmental conditions, and operational setbacks can lead to delays or increased costs. Moreover, investments in exploration and production are often long-term, and unfavourable outcomes can have lasting financial implications.

4. Environmental Risks: Oil and gas operations can have significant environmental impacts, including oil spills, gas leaks, and water contamination. Such incidents can lead to regulatory fines, clean-up costs, and damage claims, as well as adverse publicity that can harm a company’s reputation. Companies are increasingly held accountable for their environmental performance, and failures can result in long-term financial liabilities.

5. Operational Risks: The oil and gas industry involves complex operations that require advanced technology and skilled labour. Operational risks include equipment failures, supply chain disruptions, and accidents or incidents at production facilities. These risks can lead to production outages, increased costs, and potential harm to personnel or the environment. Companies must continuously invest in maintenance and upgrades to mitigate these risks.

6. Geopolitical or Economic Risks: Many oil and gas operations occur in politically unstable regions, exposing companies to risks related to changes in government, civil unrest, or armed conflict. Geopolitical risks can disrupt operations, affect supply chains, and lead to asset expropriations. Companies must consider the geopolitical landscape when making investment decisions and may need to develop contingency plans to address potential disruptions.

7. Cybersecurity Risks: As oil and gas companies increasingly rely on digital technologies and data systems, they become more vulnerable to cyberattacks. Cybersecurity incidents can disrupt operations, compromise sensitive information, and result in significant financial losses. Companies must invest in robust cybersecurity measures and develop response plans to protect their assets and data from cyber threats.

8. Market Competition: The oil and gas industry is highly competitive, with numerous players vying for market share. Increased competition can lead to price wars, reduced margins, and pressure on profits. Companies must continually innovate and improve operational efficiency to maintain their competitive edge in a rapidly changing market.

These risks collectively shape the operational landscape for oil and gas companies, requiring them to implement comprehensive risk management strategies to safeguard their assets and ensure sustainable growth.
(All image Source: Annual Report https://investor.exxonmobil.com/sec-filings/annual-reports/content/0001193125-24-092555/0001193125-24-092555.pdf
OIL AND GAS COMPANY REGULATION
Oil and gas company regulation refers to the oversight and enforcement of laws and standards to ensure that companies in the industry operate safely, protect the environment, and maintain financial stability. These regulations vary by country and are typically enforced by both national and regional authorities. In the U.S., the Environmental Protection Agency (EPA) and Department of Energy (DOE) regulate environmental and energy-related activities, while state-level bodies manage local oil and gas operations. Within the European Union, the European Union Emissions Trading System (EU ETS) regulates carbon emissions, while national agencies are responsible for enforcing safety and environmental regulations. The Canadian Energy Regulator (CER) oversees the industry in Canada, and in the UK, the Oil and Gas Authority (OGA) ensures regulatory compliance. Globally, organizations like the International Energy Agency (IEA) and OPEC help coordinate energy policies and international regulations. These regulatory frameworks aim to manage environmental impact, promote sustainable practices, and ensure operational safety in the oil and gas sector.


Source: Annual Report https://investor.exxonmobil.com/sec-filings/annual-reports/content/0001193125-24-092555/0001193125-24-092555.pdf
CONCLUSION
In conclusion, oil and gas financial statements of a company like ExxonMobil offer a unique perspective, reflecting the complexities and challenges inherent in the industry. Unlike typical product or service-based firms, ExxonMobil’s income statement is shaped by fluctuating commodity prices, significant exploration and production costs, and the depletion of valuable reserves. The balance sheet highlights capital-intensive assets such as oil rigs and refineries, while liabilities like asset retirement obligations underscore the company’s long-term commitments to dismantling and restoring sites. The cash flow statement further reveals the substantial investments required for continuous exploration and infrastructure. These distinct financial elements showcase the volatile, yet highly strategic nature of the oil and gas industry, providing a comprehensive view of its financial health and operational efficiency.


