
INTRODUCTION
Financial statements are vital for evaluating the financial health and operational performance of any company. However, the insurance financial statements of companies like Aviva differ significantly not only from those of typical manufacturing or service businesses but also from banks. While traditional companies focus on revenue generation through the sale of goods or services, and banks primarily generate revenue through interest income by managing financial assets and liabilities, insurance firms operate on a distinct business model centered around risk management and long-term liabilities. This unique model requires specialized classifications and metrics in their financial statements. Unlike manufacturing companies, which emphasize sales and cost of goods sold, or banks, which focus on metrics like net interest margin and regulatory capital ratios, insurance companies generate revenue primarily through premiums and investment income. They emphasize metrics such as underwriting income, reserves for future claims, and investment returns. Understanding these differences is crucial for investors, regulators, and stakeholders to effectively analyze and evaluate the financial performance and risk profile of insurance companies like Aviva.
HOW IS THE BALANCE SHEET OF AN INSURANCE COMPANY DIFFERENT FROM OTHER COMPANIES?
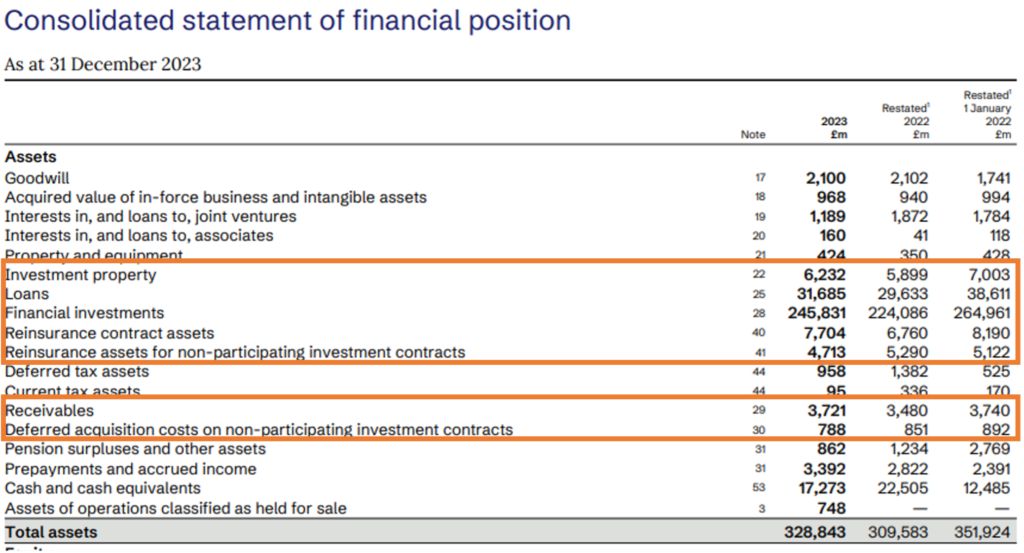
The balance sheet of an insurance company stands apart from those of other businesses due to its unique focus on managing and reserving for future liabilities. Unlike traditional companies, where the balance sheet primarily reflects assets like inventory and equipment against liabilities such as loans and accounts payable, an insurance company’s balance sheet is dominated by its insurance liabilities. For instance, Aviva Insurance’s balance sheet features large reserves for future policyholder benefits, essential for meeting long-term obligations. It also shows significant investment portfolios, as premiums are invested until claims arise, resulting in a high proportion of investment assets. The liability section is outlined with actuarial assumptions and discount rates, highlighting the complexity of future claims. This emphasis on reserves and investments highlights the company’s focus on financial stability and long-term risk management.
Let us study the Consolidated Balance Sheet of one of the famous insurance companies in the world Aviva. Below is the Consolidated Balance Sheet of the Insurance Company.
Source: Annual Report file:///C:/Users/user/Downloads/aviva-plc-annual-report-and-accounts-2023.pdf
The key balance sheet items of an Insurance company balance sheet include a range of assets, liabilities, and equity items that reflect the Insurance company’s financial position. Here are the main components:
Assets Section of Insurance Financial Statements
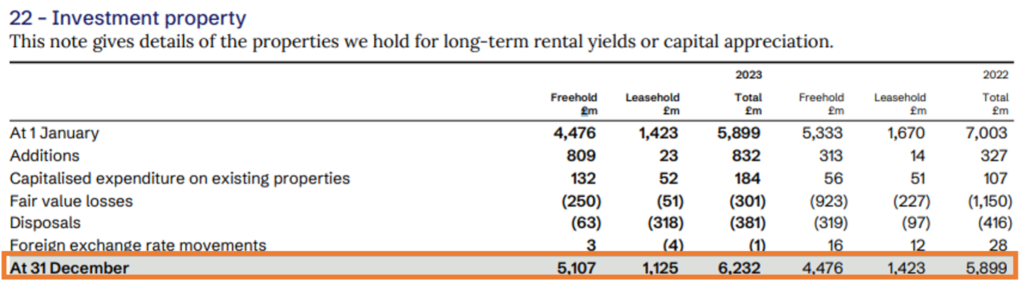
- Investment property: Investment property on an insurance company’s balance sheet refers to real estate assets held to generate rental income or for capital appreciation, rather than for operational use. These properties could include office buildings, retail spaces, or residential complexes. For insurance companies, such investments help diversify their asset portfolio and can offer a steady income stream, contributing to overall financial stability.
In the case of Aviva, Investment property is £6,232 million and is calculated as under:
Source: Annual Report file:///C:/Users/user/Downloads/aviva-plc-annual-report-and-accounts-2023.pdf
- Reinsurance contract assets: These represent amounts due from reinsurance companies. These assets arise when the insurance company has ceded some of its risk to reinsurers and expects to receive payments for claims or reserves covered by the reinsurance agreements. Essentially, they are funds expected to be reimbursed by reinsurers, helping to offset the insurance company’s own claim liabilities and support its financial health. In the case of Aviva, the Reinsurance contract assets are £7,704 million.
- Reinsurance assets for non-participating investment contracts: These represent amounts that the company expects to recover from reinsurers for investment contracts where policyholders do not share in the insurer’s profits. These assets typically include the expected recovery of claims or other liabilities associated with these investment contracts. They help the insurer manage risk and maintain financial stability by offsetting potential losses from such contracts. In the case of Aviva, the Reinsurance assets for non-participating investment contracts are £4,713 million.
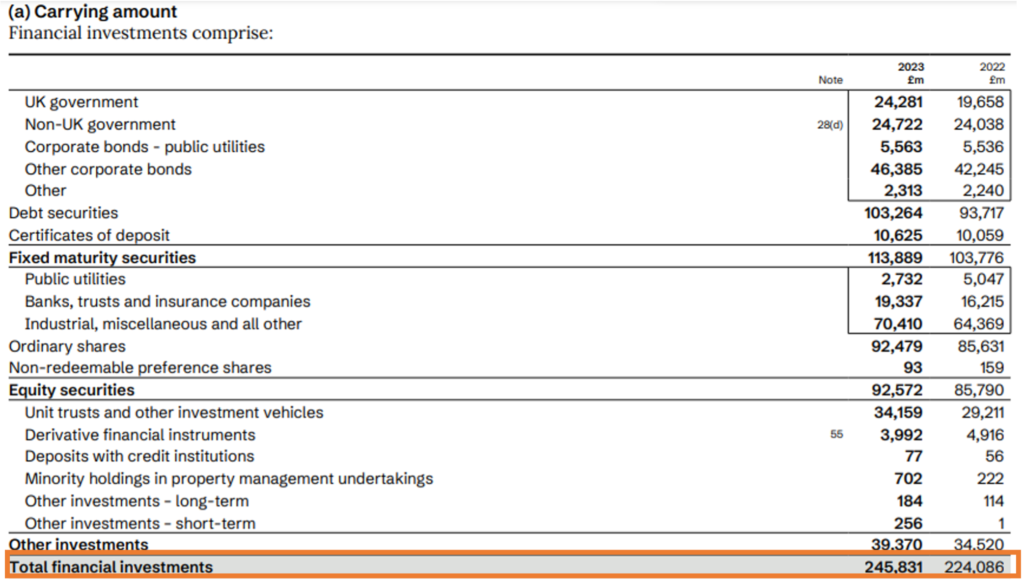
- Financial Investments: These represent the various assets the company holds to generate returns and ensure it can meet future liabilities. These investments typically include a diverse range of securities such as stocks, bonds, derivatives, and real estate. By strategically investing in these assets, the insurance company aims to grow its capital and secure a steady income stream, which is crucial for covering policyholder claims and supporting long-term financial stability. Essentially, financial investments are a key element of an insurer’s strategy, helping to balance risk and return while ensuring that the company remains financially robust and capable of meeting its obligations. In the case of Aviva, the Financial Investments are £ 245,831 million and calculated as follows:
Source: Annual report file:///C:/Users/user/Downloads/aviva-plc-annual-report-and-accounts-2023.pdf
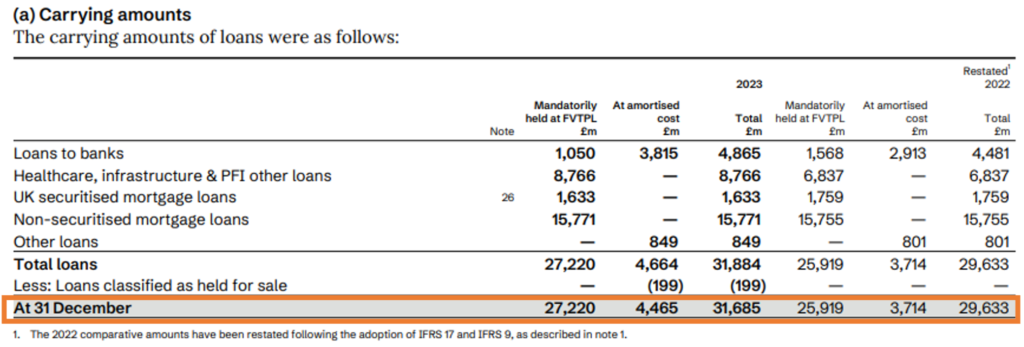
- Loans: These represent the amounts the company has extended to other parties, such as policyholders or external entities, as part of its investment strategy. These loans can include various types such as mortgages, personal loans, or business loans. The presence of a significant amount of loans is often due to their role in generating steady interest income, which helps enhance the company’s overall financial performance. Loans also contribute to risk management by diversifying the investment portfolio beyond stocks and bonds. In the case of Aviva, the Loans are £ 31,685 million and calculated as follows:
Source: Annual Report file:///C:/Users/user/Downloads/aviva-plc-annual-report-and-accounts-2023.pdf
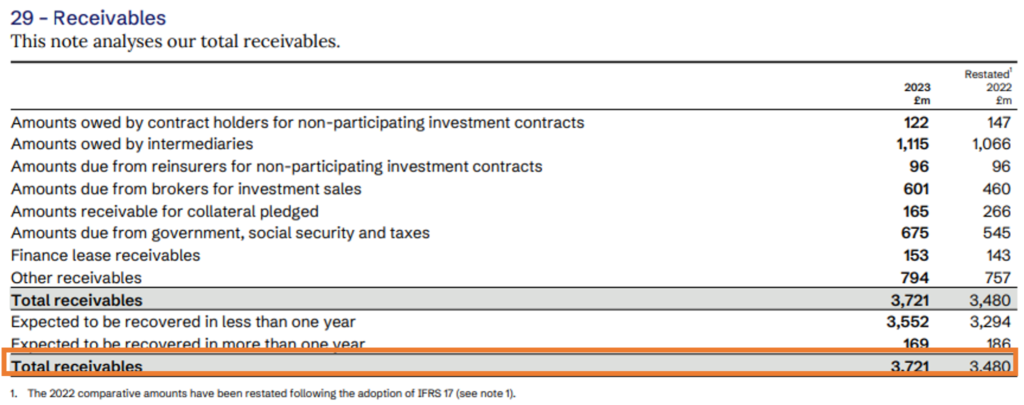
- Receivables: These represent amounts due to the company from various sources. These typically include premiums owed by policyholders, reinsurance recoverables, and other amounts expected to be collected. Essentially, receivables are the funds that the insurer is expected to receive in the future, which are crucial for maintaining liquidity and ensuring that the company can meet its financial obligations and operational expenses. In the case of Aviva, the Receivables are £ 3,721 million and calculated as under:
Source: Annual report file:///C:/Users/user/Downloads/aviva-plc-annual-report-and-accounts-2023.pdf
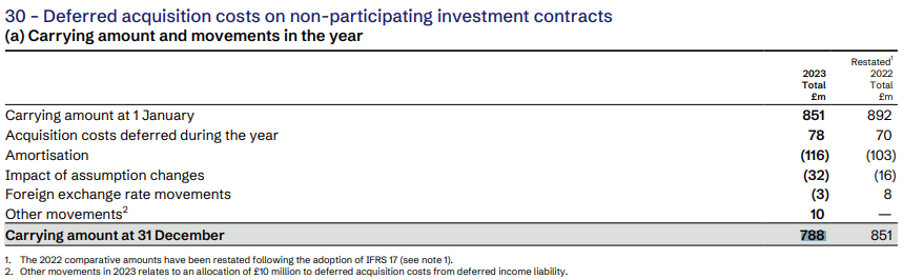
- Deferred acquisition costs (DAC): These represent the costs incurred to acquire new insurance policies, such as commissions paid to agents, which are capitalized and spread out over the life of the policies. This means the costs are recorded as an asset and amortized over the policy’s duration rather than being expensed immediately. DAC helps match the cost of acquiring policies with the revenue they generate over time. In the case of Aviva, the Deferred acquisition costs are £ 788 million and calculated as follows:
Source: Annual Report file:///C:/Users/user/Downloads/aviva-plc-annual-report-and-accounts-2023.pdf
Liabilities Section of Insurance Financial Statements
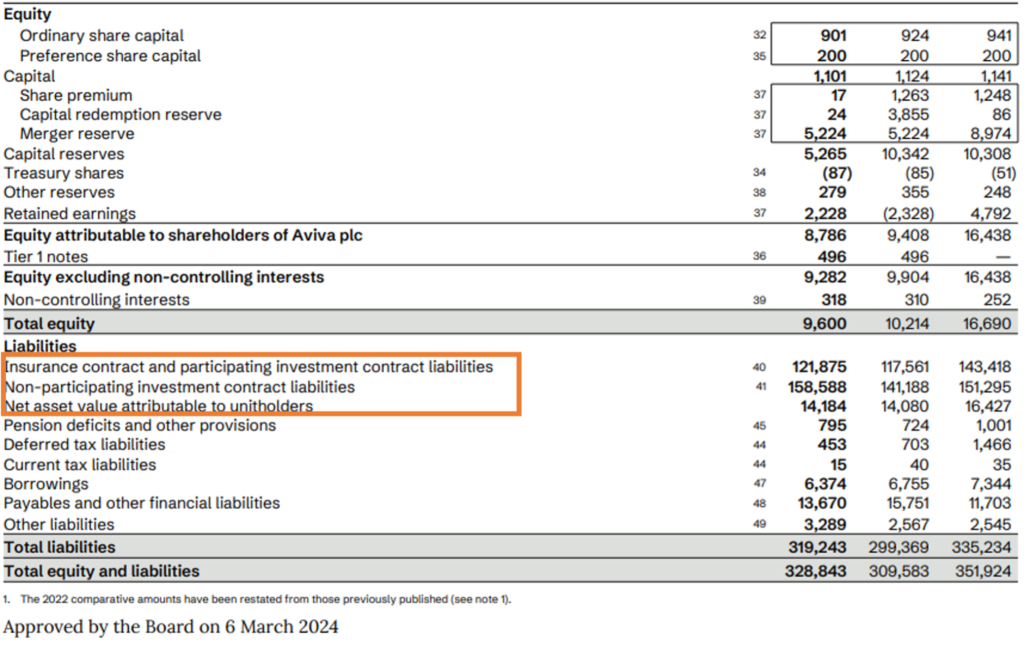
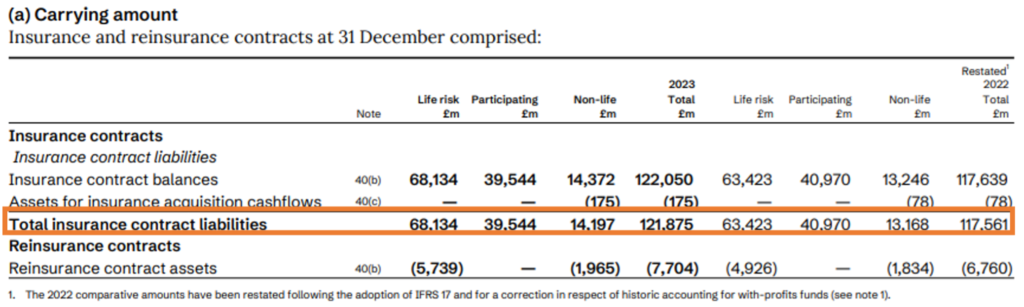
- Insurance contract and participating investment contract liabilities: Insurance contract and participating investment contract liabilities on an insurer’s balance sheet represent future obligations to policyholders. Insurance contract liabilities cover expected payouts for claims and benefits under insurance policies. Participating investment contract liabilities involve obligations under contracts where policyholders share in the insurer’s profits. These liabilities are crucial for managing financial stability and ensuring the insurer can meet its commitments to policyholders. In the case of Aviva, the Insurance contract and participating investment contract liabilities are £ 121,875 million and calculated as follows:
Source: Annual report file:///C:/Users/user/Downloads/aviva-plc-annual-report-and-accounts-2023.pdf
- Non-participating investment contract liabilities: Non-participating investment contract liabilities on an insurance company’s balance sheet represent the obligations for investment contracts where policyholders do not share in the insurer’s profits. These liabilities include the amounts the insurer expects to pay out or reserve for these contracts, which provide fixed returns and benefits. They ensure the insurer can fulfill its commitments under these contracts. In the case of Aviva, the Non-participating investment contract liabilities are £ 158,588 million.
- Net asset value attributable to unitholders: It is the value of investment assets, minus liabilities, divided by the number of units. It shows the per-unit value of investments, helping unitholders gauge the worth of their shares. In the case of Aviva, the Net asset value attributable to unitholders is £ 14,184 million.
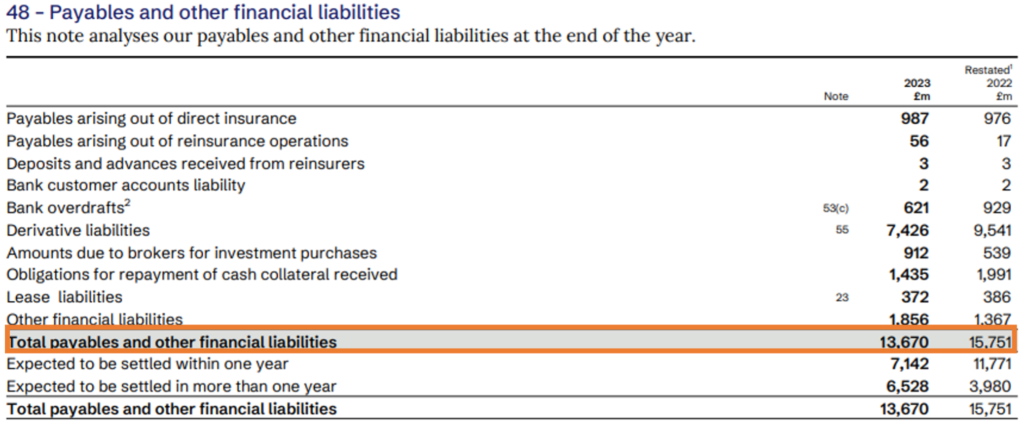
- Payables and other financial liabilities: These represent the amounts the company owes to external parties. Payables include obligations such as claims to be paid out, premiums owed to other insurers, and invoices from suppliers, reflecting the company’s short-term financial commitments. Other financial liabilities encompass a broader range of obligations, such as borrowed funds, debt instruments, and various contractual liabilities. These liabilities are essential for understanding the insurer’s financial health, as they indicate the company’s short-term and long-term financial commitments and help manage its cash flow. Proper management of these payables and liabilities is crucial for maintaining operational efficiency and ensuring the company can meet its financial obligations. In the case of Aviva, the Payables and other financial liabilities are £ 13,670 million and calculated as below:
Source: Annual Report file:///C:/Users/user/Downloads/aviva-plc-annual-report-and-accounts-2023.pdf
Equity Section of Insurance Financial Statements
- Capital: These are the funds raised from issuing shares both Ordinary and Preference shares. Aviva has £ 901 million as ordinary share capital stock and, £ 200 million as preferred share capital on the balance sheet.
- Retained Earnings: These are the Cumulative earnings retained in the company after dividends. Aviva has £ 2,228 million as retained earnings on the balance sheet.
- Capital Reserves: These are funds set aside for specific purposes to bolster financial stability. In the case of Aviva, the capital reserve includes a share premium (funds received above the nominal value of shares) of £ 17 million, capital redemption reserve (from redeeming shares) of £ 24 million, and merger reserve (surplus value from acquisitions) of £ 5,224 million. These reserves help maintain financial strength and support strategic initiatives.
- Treasury shares: These are shares that a company has repurchased and holds, which are not considered for dividends or voting rights and reduce the number of outstanding shares. Aviva has -£ 87 million as Treasury shares on the balance sheet.
These items collectively provide a comprehensive picture of an Insurance company’s financial health, liquidity, and operational stability.
HOW IS THE INCOME STATEMENT OF AN INSURANCE COMPANY DIFFERENT FROM OTHER COMPANIES?
An insurance company’s income statement differs from typical firms by focusing on revenue from premiums and investment income rather than sales. For example, Aviva’s income statement shows income from premiums and investment returns. Expenses include not only operational costs but also significant payouts for claims and benefits, which vary based on underwriting and claims. This distinct mix highlights the interplay between premium income, investment returns, and claims expenses, setting the insurance income statement apart.
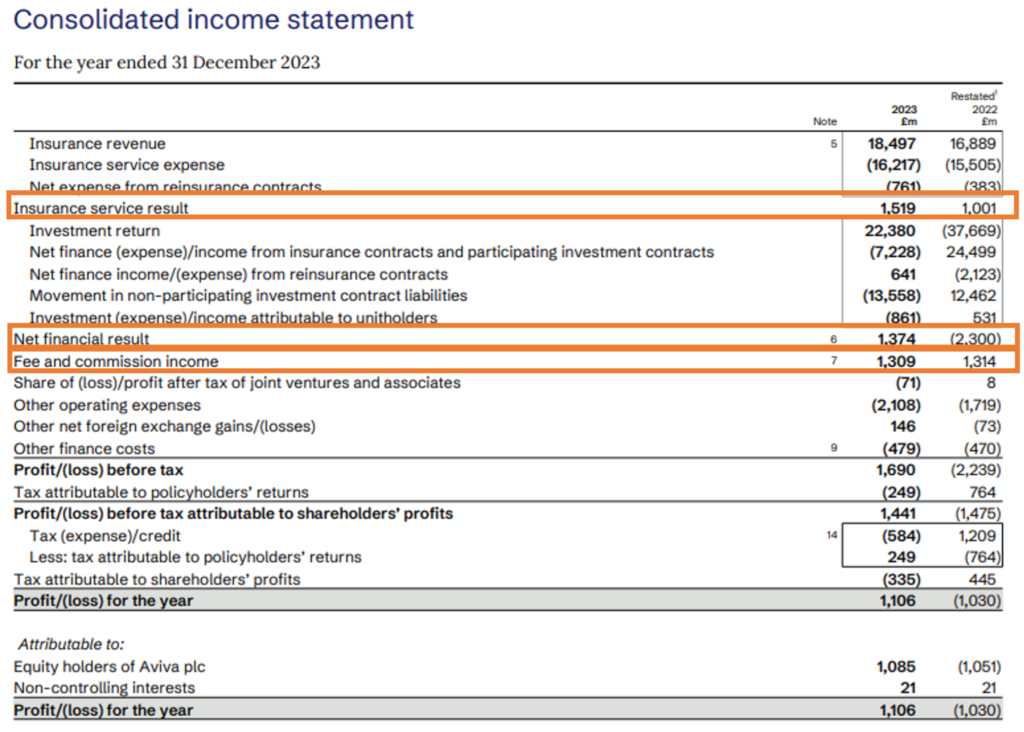
Continuing the same example of Aviva let us have a look at its Income Statement and Statement of Comprehensive Income. Below is the Income Statement for the fiscal year 2023. We can see that the company also presents the Income statement figures for the fiscal year 2022 to make year-on-year comparison easier. The income statement of an insurance company is influenced by changes in premiums earned, claims paid, investment income, underwriting expenses, and reinsurance costs. Moreover, changes in regulations can affect financial outcomes and reporting.
Source: Annual Report file:///C:/Users/user/Downloads/aviva-plc-annual-report-and-accounts-2023.pdf
Below is the Consolidated Statement of Comprehensive Income of the Insurance company:
Source: Annual Report file:///C:/Users/user/Downloads/aviva-plc-annual-report-and-accounts-2023.pdf
The key items of the income statement of an Insurance company include:
- Insurance service result: The “Insurance Service Result” in the income statement of an insurance company represents the profit or loss generated from its core insurance operations. This figure is calculated by subtracting the costs and expenses related to providing insurance services from the income earned through premiums. In the above example, Aviva has an Insurance service result of £1,519 million. Here’s a breakdown of what it generally includes:
- Insurance Revenue: “Insurance revenue” on the income statement of an insurance company refers to the money the company earns from providing insurance coverage to its customers. This revenue is primarily made up of the premiums customers pay for their insurance policies.
However, not all the premiums collected are recognized as revenue immediately. Only the portion of the premiums that correspond to the expired period of the insurance coverage (i.e., the time during which the company has already provided coverage) is recognized as “insurance revenue.”
In simpler terms, “insurance revenue” represents the income an insurance company earns by fulfilling its promise to cover risks over a specific period, reflecting the value of the coverage provided during that time.
In the case of Aviva, the Insurance revenue is £18,497 million.
- Insurance service expense: “Insurance service expenses” on the income statement of an insurance company represent the costs incurred in providing insurance coverage and handling claims. These expenses encompass several key components, including the money paid out to policyholders for claims related to incidents like car accidents, health treatments, or property damage. Additionally, these expenses account for changes in insurance liabilities, which involve adjustments to the reserves set aside to cover future claims. If the company anticipates higher future claims, it may increase these reserves, leading to an expense. Operating costs, such as salaries, administrative expenses, and the costs associated with processing claims, are also included.
In essence, “insurance service expenses” are the costs the insurance company incurs to fulfill its obligations of providing coverage, paying claims, and managing its operations, all of which are deducted from revenue to determine profitability.
In the case of Aviva, the Insurance service expense is £16,217 million.
- Net income/(expense) from reinsurance contracts: The “Net income/(expense) from reinsurance contracts” in an insurance company’s income statement reveals the financial impact of its reinsurance activities. Essentially, it reflects whether the company is gaining or losing from transferring risk to another insurer. If the recoveries from the reinsurer and any commissions received surpass the premiums paid for this coverage, the result is a positive net income—indicating a financial benefit. Conversely, if the premiums paid are higher, it results in a net expense, showing that the cost of reinsurance outweighs the gains. This figure is crucial as it highlights how well the company is managing its risk and reinsurance strategies.
In the above example, Aviva has a Net expense from reinsurance contracts of £761 million.
- Net financial result: The “Net Financial Result” in an insurance company’s income statement represents the profitability from its investment activities and financial operations outside of its core insurance business. This includes returns on investments, interest expenses, and gains or losses from financial assets. Additionally, it factors in financial risks, discounting effects, and changes in investment contract liabilities. This figure provides a clear snapshot of how effectively the company is managing its financial assets and overall investment strategy.
In the case of Aviva, the Net financial result comprises investment return, the finance income/expense on insurance and participating investment contracts that arise from discounting, changes in financial risk and changes in the fair value of underlying items, and the previously presented movement in non-participating investment contract liabilities. The total of these items is £1,374 million.
- Fee and commission income: Fee and Commission Income represents earnings from services beyond basic insurance coverage. This includes charges for policy administration, commissions earned from brokers or for placing business with other insurers, and fees from managing investments or financial products. Essentially, it’s the extra income the company makes from providing additional services like fund management, mutual fund distribution, and reinsurance commissions. This income highlights the company’s ability to generate revenue through various financial and administrative services.
In the case of Aviva, the Fee and commission income is £1,309 million.
WHAT IS INCLUDED IN THE CASH FLOW STATEMENT OF AN INSURANCE COMPANY?
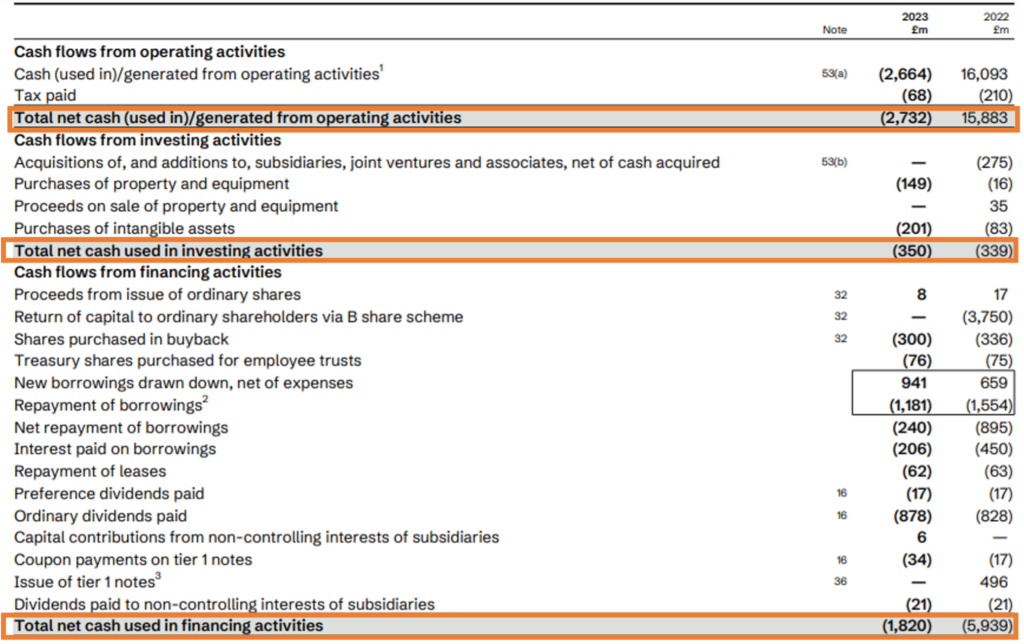
Below is the Consolidated Statement of Cash Flows.

Source: Annual Report https://www08.wellsfargomedia.com/assets/pdf/about/investor-relations/annual-reports/2023-annual-report.pdf
In an Insurance company’s cash flow statement, key factors include:
- Operating Activities: It details the cash generated and used from the company’s core insurance operations. This includes cash inflows from premiums received from policyholders and outflows for settling insurance claims and covering operating expenses. It also encompasses cash generated from investments, such as interest and dividends, which are integral to the company’s core business. The cash flow from Operating Activities for Aviva is -£ 2,732 million.
- Investing Activities: It captures cash transactions related to the acquisition and disposal of long-term assets. This includes cash used to purchase investments like bonds or real estate and cash received from selling such assets. Additionally, it covers capital expenditures for acquiring or upgrading physical assets, such as property and equipment, which support the company’s long-term growth and operations. The cash flow from Investing Activities for Aviva is -£ 350 million.
- Financing Activities: It focuses on the cash movements related to the company’s financial structure and capital management. This section includes cash inflows from issuing new stock or debt and outflows for repaying loans or other borrowings. It also covers cash used to pay dividends to shareholders, reflecting the company’s approach to rewarding investors and managing its capital base. The cash flow from Financing Activities for Aviva is -£ 1,820 million.
The cash flow statement of an insurance company summarizes how cash is generated and used across its core operations, financing activities, and investments. It provides a clear picture of the company’s financial health, revealing its ability to manage cash flows, sustain operations, and support growth.
KEY RATIOS FOR ANALYZING INSURANCE FINANCIAL STATEMENTS
When analyzing the financial statements of insurance companies, several key ratios are crucial for assessing their financial health, profitability, and operational efficiency. These ratios help stakeholders understand how well the company is managing its risks, generating returns, and maintaining solvency.
Let us now understand some of these key ratios included in Aviva’s Annual Report:
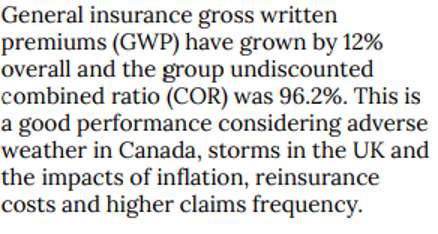
- Loss Ratio: Measures the proportion of claims paid out to policyholders relative to the premiums earned. It indicates the efficiency of the company’s underwriting process. Aviva experienced a 5% increase in gross loss ratios for its general insurance and health businesses.
- Distribution ratio: The Commission Ratio and Expense Ratio are key metrics in evaluating an insurance company’s cost efficiency. The Commission Ratio measures the proportion of premiums paid to agents and brokers, while the Expense Ratio reflects the percentage of premiums used for operational costs like salaries and administration. Together, these ratios are aggregated to form the Distribution Ratio, which provides a comprehensive view of how much of the premiums are consumed by both commissions and operational expenses. A lower Distribution Ratio indicates more efficient management and distribution of insurance policies relative to the premiums earned. Aviva has reported a distribution ratio of 32.6% in the case of UK & Ireland General Insurance and 31.5% in the case of Canada General Insurance.
- Combined Ratio: This ratio, which combines the loss ratio and expense ratio, reveals the overall profitability of the company’s core insurance operations. A ratio below 100% signifies an underwriting profit. Aviva has reported a group undiscounted combined ratio (COR) of 96.2%
Source: Annual Report file:///C:/Users/user/Downloads/aviva-plc-annual-report-and-accounts-2023.pdf
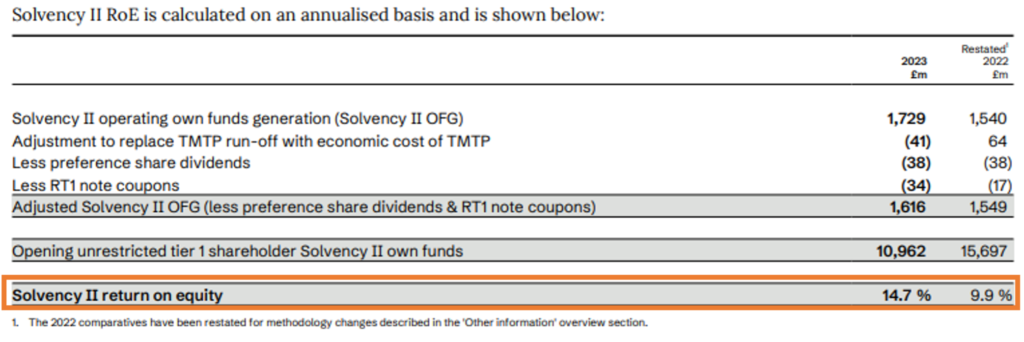
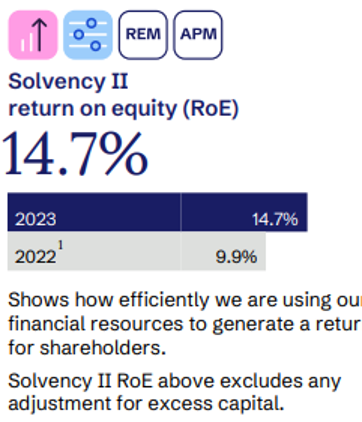
- Solvency II return on equity (RoE): Solvency II Return on Equity (RoE) is a metric used by European insurance companies under the Solvency II regulatory framework to measure the profitability of an insurer relative to its equity. It reflects how effectively the company generates profits from the capital provided by shareholders, taking into account the stringent capital and risk management requirements of Solvency II.
Unlike traditional RoE, Solvency II RoE considers the economic balance sheet approach, where assets and liabilities are valued at market-consistent levels. This means it reflects the insurer’s ability to generate returns under a regulatory environment that emphasizes risk-adjusted capital management. A higher Solvency II RoE indicates that the insurer is efficiently using its capital to generate profits while adhering to regulatory standards.
Solvency II return on equity (RoE) reported by Aviva is 14.7% in the year 2023 as compared to 9.9% in the year 2022.
Source: Annual report file:///C:/Users/user/Downloads/aviva-plc-annual-report-and-accounts-2023.pdf
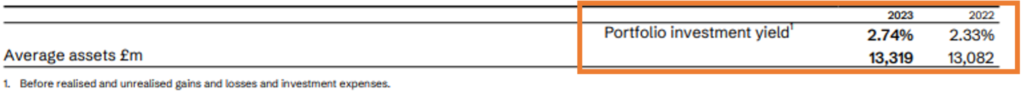
- Investment Yield: Measures the return on the company’s investment portfolio, highlighting the effectiveness of its investment strategy. Aviva has reported an Investment yield of 2.74% in the year 2023 as compared to 2.33% in the year 2022.
Source: Annual report file:///C:/Users/user/Downloads/aviva-plc-annual-report-and-accounts-2023.pdf
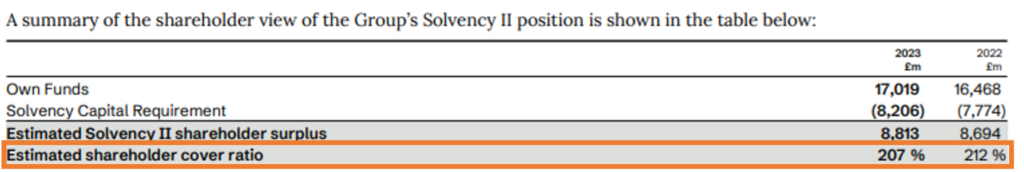
- Solvency II shareholder cover ratio: The Solvency II Shareholder Cover Ratio is a key metric under the European Union’s Solvency II regulatory framework for insurance companies, assessing the capital available to protect shareholders relative to the required capital (Solvency Capital Requirement or SCR). A ratio above 100% indicates that the insurer is well-capitalized, with sufficient funds to absorb potential losses, offering greater security for shareholders. Conversely, a ratio below 100% suggests undercapitalization, which could expose shareholders to higher risks. This ratio provides a clear snapshot of an insurer’s financial health and resilience from a shareholder’s perspective. Solvency II Shareholder Cover Ratio reported by Aviva is 207% at the end of the year 2023.
Source: Annual report file:///C:/Users/user/Downloads/aviva-plc-annual-report-and-accounts-2023.pdf
- Cost Asset Ratio: The Cost Asset Ratio gauges an insurance company’s efficiency in handling operating expenses compared to its total assets. It is calculated by dividing operating expenses by total assets. A lower ratio indicates efficient asset management, while a higher ratio suggests that a greater share of assets is being used for operating costs, which could indicate inefficiency. This metric provides insight into how well the company controls costs in relation to its asset base. Following is the Cost Asset ratio reported by Aviva.
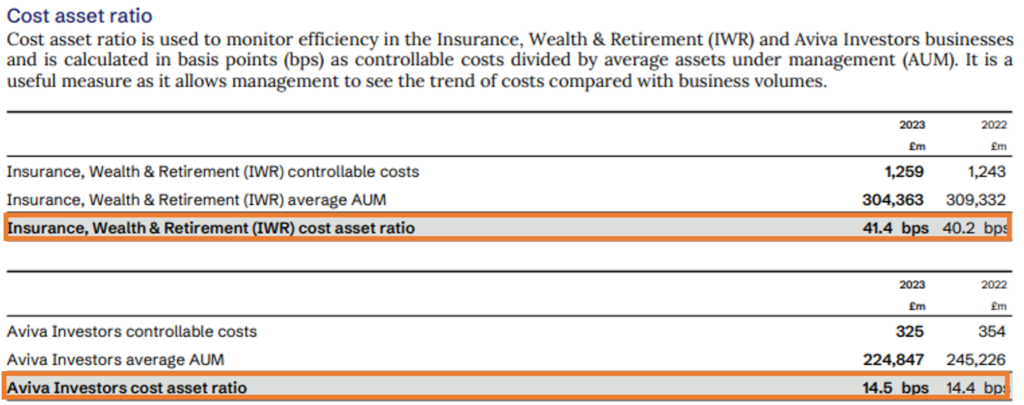
Source: Annual report file:///C:/Users/user/Downloads/aviva-plc-annual-report-and-accounts-2023.pdf
These ratios provide valuable insights into different aspects of an Insurance company’s financial performance and stability, helping investors and analysts make informed decisions about investing in or lending to the institution.
VARIOUS RISK FACED BY INSURANCE COMPANIES AND IMPACT ON THE FINANCIAL STATEMENTS
Some of the common risks faced by Insurance companies, in general, are as follows with their impact on the financial statements.
UNDERWRITING RISK
Underwriting risk arises when the premiums charged by the insurance company are insufficient to cover the claims and expenses associated with the policies. This risk can lead to increased claims expenses on the income statement and potentially lower net income if the losses exceed expectations. Over time, poor underwriting can erode the company’s profitability and capital reserves, reflected in a weaker balance sheet.
Aviva mentions its underwriting risk in its Annual Report as below.
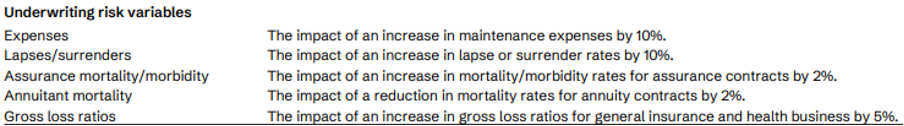
Source: Annual Report file:///C:/Users/user/Downloads/aviva-plc-annual-report-and-accounts-2023.pdf
MARKET RISK
Market risk involves the potential for losses due to changes in market variables like interest rates, equity prices, property prices, or currency exchange rates. This risk can impact the company’s investment income and the value of its investment portfolio, causing fluctuations in net income on the income statement and in asset values on the balance sheet. Significant market volatility can result in reduced capital adequacy, impacting the company’s solvency.
Aviva mentions Market Risk in its Annual Report as below.
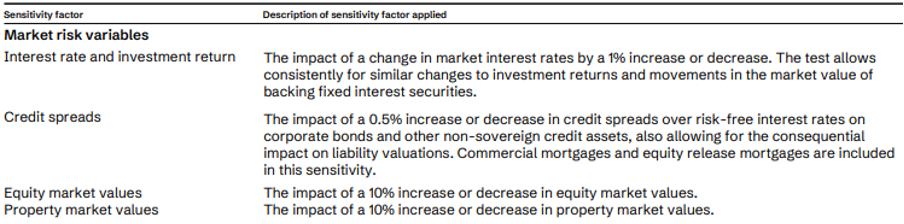
Source: Annual Report file:///C:/Users/user/Downloads/aviva-plc-annual-report-and-accounts-2023.pdf
CREDIT RISK
Credit risk is the risk of loss if a counterparty, such as a reinsurer or bond issuer, fails to meet its obligations. This can lead to increased bad debt expenses and impairments, which would reduce net income. On the balance sheet, it can lead to a reduction in the value of reinsurance recoverable or investment assets, weakening the company’s financial position and potentially leading to liquidity issues. Aviva mentions its credit risk as below.
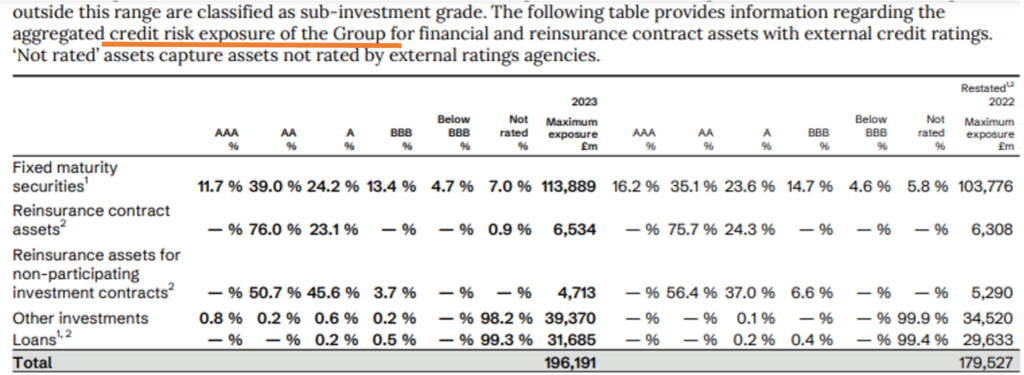
Source: Annual report file:///C:/Users/user/Downloads/aviva-plc-annual-report-and-accounts-2023.pdf
LIQUIDITY RISK
Liquidity risk arises when the insurance company is unable to meet its short-term financial obligations due to a lack of liquid assets. This can result in the need to sell assets at unfavorable prices, leading to losses reflected on the income statement. The company might also face challenges in paying out claims, impacting cash flow and leading to a strained liquidity position on the balance sheet, which could raise concerns about the company’s ability to operate effectively.

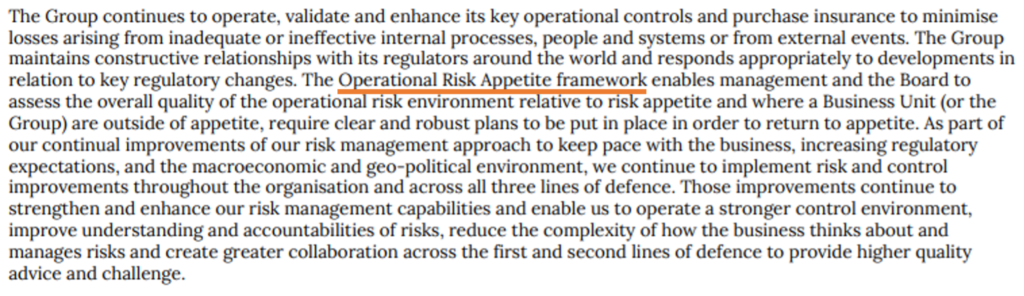
OPERATIONAL RISK
Operational risk refers to the potential for loss due to failures in internal processes, and systems, or from external events, such as cyber-attacks or fraud. This can lead to unexpected expenses or losses, impacting operating expenses on the income statement. Additionally, significant operational failures can damage the company’s reputation, potentially reducing future revenue and leading to increased reserves for potential claims, affecting both the income statement and the balance sheet. Aviva mentions its operational risk in the annual report below:
INSURANCE COMPANY REGULATION
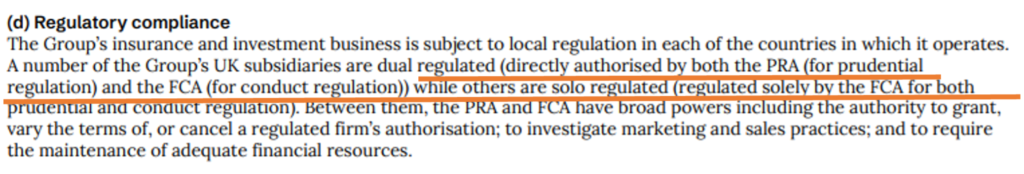
Insurance company regulation refers to the oversight and enforcement of rules and standards designed to ensure that insurance companies operate safely, maintain financial stability, and protect policyholders. This regulation varies by region and is managed by different authorities around the world. In the U.S., insurance is regulated at the state level, with coordination by the National Association of Insurance Commissioners (NAIC). In the EU, the European Insurance and Occupational Pensions Authority (EIOPA) oversees the industry, while the Prudential Regulation Authority (PRA) and Financial Conduct Authority (FCA) regulate in the UK. Canada’s Office of the Superintendent of Financial Institutions (OSFI) and Australia’s Australian Prudential Regulation Authority (APRA) are key regulators. In India, the Insurance Regulatory and Development Authority of India (IRDAI) is the primary authority. The International Association of Insurance Supervisors (IAIS) promotes effective supervision worldwide across various jurisdictions.
Below are the snapshots from the annual report of the company mentioning how the PRA regulates the Insurance company.
Source: Annual Report file:///C:/Users/user/Downloads/aviva-plc-annual-report-and-accounts-2023.pdf
CONCLUSION
A comprehensive understanding of the insurance financial statements is important since it shows how well these companies manage risks and handle their finances. They help us see if the company is good at making smart investments and keeping enough money set aside to pay future claims. By looking at these statements, we can understand if the insurer is strong and reliable, and if they are on track to keep their promises to policyholders while growing their business.

