INTRODUCTION
In the intricate landscape of corporate finance, two profitability ratios stand out as pivotal tools for assessing a company’s performance: Return on Invested Capital (ROIC) and Return on Capital Employed (ROCE). At first glance, these financial ratios may appear to serve similar purposes, each aiming to gauge how effectively a company generates profits from its capital. However, delving deeper reveals nuanced differences that can unlock critical insights into a company’s financial health, investment potential, and overall efficiency. Understanding these distinctions is essential for investors, managers, and analysts seeking to make informed decisions in the ever-evolving business environment.
We will try to understand the concept of ROIC and ROCE calculation with the help of a real-life example of Apple Inc. in the article.
| Ratios | 2023 | 2022 |
| ROIC | 105% | 112% |
| ROCE | 47% | 49% |
The ROIC and ROCE for Apple Inc. have huge differences. Let’s delve deeper to understand both the concepts and what makes these similar-sounding ratios so different.
WHAT IS ROCE?
Return on Capital Employed (ROCE) is a vital profitability ratio that measures a company’s efficiency in generating profits from its total capital employed, which includes both equity and debt. ROCE offers a comprehensive view of how effectively a company uses all its available capital to generate post-tax Earnings before interest and tax(EBIT). The formula for calculating ROCE is:
ROCE = Post-tax Earnings Before Interest and Tax (EBIT)/ Capital Employed
= EBIT (1-tax)/ Capital Employed
where Post Tax EBIT (Earnings Before Interest and Taxes) represents the company’s operating profit, reflecting its core business operations without the impact of financing costs. Capital Employed is Total Equity and Total Debt (both long-term and short-term). Let’s see how we arrive at the ROCE of Apple Inc. for the fiscal year 2022 and 2023.
| Particulars | 2023 | 2022 |
| EBIT | 1,14,301 | 1,19,437 |
| Effective tax rate | 14.7% | 16.2% |
| Post-tax EBIT (A) | 97,499 | 1,00,088 |
| Capital Employed | ||
| Equity | 62,146 | 50,672 |
| Non-Current Term Debt | 95,281 | 98,959 |
| Current Term Debt | 9,822 | 11,128 |
| Commercial paper | 5,985 | 9,982 |
| Other non-current liabilities( excluding long-term taxes payable) | 34,391 | 32,485 |
| Total Capital Employed (B) | 2,07,625 | 2,03,226 |
| ROCE (A/B) | 47% | 49% |
Source data: Annual Report https://s2.q4cdn.com/470004039/files/doc_earnings/2023/q4/filing/_10-K-Q4-2023-As-Filed.pdf
This means the company generates a return of 47 cents for every dollar of capital employed in 2023 and a return of 49 cents for every dollar of capital employed in 2022, highlighting its efficiency in using all available resources to produce profit.
WHAT IS ROIC?
Return on Invested Capital (ROIC), on the other hand, focuses specifically on the return generated from all invested capital. It’s a spotlight on how well a company turns its total investments into returns. The formula for ROIC is:
ROIC = Net Operating Profit After Taxes (NOPAT)/ Total Invested Capital
= EBIT (1-tax rate)/Total Invested Capital
NOPAT is the post-tax operating profit, showing true operational efficiency, while Total Invested Capital is the capital invested in the operating business of the company (calculated from the asset side of the balance sheet) used to generate this profit. It is calculated by adding Fixed Assets (Net property, plant, & equipment), Net Operating Working Capital (Operating current assets less operating current liabilities), and Other Operating Assets (like Operating Leases). For ROIC including Goodwill and Intangibles, Acquired Intangible Assets and Goodwill are also included in the Invested Capital.Let’s see how we arrive at the ROIC of Apple Inc. for the fiscal year 2022 and 2023.
| Particulars | 2023 | 2022 |
| NOPAT Calculation | ||
| Operating Income | 1,14,301 | 1,19,437 |
| Provision for income taxes | 16,741 | 19,300 |
| Effective tax rate | 14.7% | 16.2% |
| NOPAT Calculation (A) | 97,499 | 1,00,088 |
| Invested Capital Calculation | ||
| Operating current assets | ||
| Accounts receivable, net | 29,508 | 28,184 |
| Vendor non-trade receivables | 31,477 | 32,748 |
| Inventories | 6,331 | 4,946 |
| Other Current Assets | 14,695 | 21,223 |
| 82,011 | 87,101 | |
| Less: Operating current liabilities | ||
| Accounts payable | 62,611 | 64,115 |
| Income Tax Payable | 8,819 | 6,552 |
| Deferred Revenue | 8,061 | 7,912 |
| Net Operating Working Capital (i) | 2,520 | 8,522 |
| Fixed Assets (Property, plant, and equipment) (ii) | 43,715 | 42,117 |
| Other Operating Assets (Other Noncurrent assets) (iii) | 46,906 | 39,053 |
| Total Invested Capital (i+ii+iii=B) | 93,141 | 89,692 |
| ROIC (A/B) | 105% | 112% |
Source data: Annual Report https://s2.q4cdn.com/470004039/files/doc_earnings/2023/q4/filing/_10-K-Q4-2023-As-Filed.pdf
This ROIC indicates that for every dollar invested, the company delivers 105 cents of profit in 2023 and 112 cents of profit in 2022, reflecting its ability to efficiently convert invested capital into meaningful returns.
ROIC COULD BE A SUBSET OF ROCE
ROIC could be a subset of ROCE because it focuses exclusively on the returns generated from the capital specifically invested in the operating business of the company to generate operating profits, while ROCE includes a wider range of capital sources available in the business. Essentially, ROIC narrows down the evaluation to long-term investments made in the business, providing insight into how well these specific funds are being utilized to generate post-tax returns. The key to estimating invested capital is to account for all the assets required for the company’s operations. In contrast, ROCE encompasses the total capital employed, giving a more comprehensive view of the company’s efficiency in generating post-tax operating returns from all available capital.
ROIC is a subset of ROCE is also proved in the above example. In the case of Apple Inc. ROIC is greater than ROCE. The numerator for both ratios comes out to be the same. When calculating the denominator for ROCE, we include all the capital used in the business. In contrast, for ROIC, we only consider the capital deployed in assets required to operate the business. Since the denominator of ROCE is greater than the denominator of ROIC, the resultant ratio for ROIC is greater than the ratio of ROCE.
DIFFERENCE BETWEEN ROIC AND ROCE
The table below shows the comparison between ROIC and ROCE.
| Aspect | ROIC (Return on Invested Capital) | ROCE (Return on Capital Employed) |
| Purpose | Helps determine the efficiency of the total capital invested | Measures the efficiency of the company’s business operations and the profits generated with the capital employed |
| Formula | ROIC=EBIT×(1−tax rate)/ Invested Capital | ROCE=EBIT (1-tax rate)/ Capital Employed |
| Numerator | Earnings before interest and tax (EBIT) * (1 – tax rate) | Earnings before interest and tax (EBIT)* (1-tax rate) |
| Denominator | Invested Capital | Capital Employed (Equity +Total Debt) |
| Components of Denominator | Fixed Assets (Net property, plant, & equipment), Net Operating Working Capital (Operating current assets less operating current liabilities), and Other Operating Assets (like Operating Leases). For ROIC including Goodwill and Intangibles, Acquired Intangible Assets and Goodwill are also included in the Invested Capital. | All the capital that is part of the business(Equity+ Long-term debt and short-term debt) |
| Relevance | Investors and managers assessing the efficiency of invested capital | Investors and analysts assessing overall financial health and efficiency |
| Use Case | Assessing the performance of specific investments and operational management | Evaluating the overall financial health and efficiency of the company |
This table highlights the differences in the purpose, calculation, and application of ROIC and ROCE, providing a clear understanding of how each metric is used in financial analysis.
WHAT IS AN IDEAL ROCE AND ROIC RATIO?
For a company to demonstrate financial health and effective capital utilization, its ROCE (Return on Capital Employed) must exceed its WACC (Weighted Average Cost of Capital). This indicates that the returns generated from its capital are higher than the cost incurred to obtain that capital, signaling value creation for shareholders and overall profitability. When ROCE is greater than WACC, it reassures investors that the company is making wise investment decisions and efficiently using its resources to generate profits, which is crucial for sustaining growth and maintaining a competitive edge in the industry.
Similarly, a company’s ROIC (Return on Invested Capital) should be greater than WACC to confirm that it is generating positive returns from its invested capital. A positive ROIC reflects operational efficiency and the company’s ability to manage and allocate its capital towards profitable ventures. This not only showcases the company’s capacity to earn more than its costs but also makes it an attractive option for investors.
In contrast, if ROCE or ROIC is below WACC or is negative, it indicates poor profitability and capital utilization, signaling inefficiencies and potential financial distress.
- FACTORS INFLUENCING ROCE AND ROIC
- Industry Norms: Different industries have different capital structures and profitability norms. For example, technology companies may have higher ROIC and ROCE due to lower capital requirements, whereas utility companies may have lower figures due to high capital intensity.
- Economic Conditions: During economic booms, companies may achieve higher ROIC and ROCE, while during recessions, these metrics may decline.
- Company’s Life Cycle: Mature companies might have stable and high ROIC and ROCE, while growing companies may have fluctuating figures as they invest heavily in expansion.
PROS AND CONS OF ROIC AND ROCE
Here is a table outlining the pros and cons of ROIC and ROCE:
| Metric | Pros | Cons |
| ROIC (Return on Invested Capital) | -Focuses on core operations, offering a clear view of efficiency in using invested capital. – Helps in assessing the effectiveness of new investments and projects. – Indicates value creation by comparing ROIC with the company’s cost of capital. | – Complex calculation due to the need for accurate NOPAT and invested capital figures. – Focuses only on the operating business and hence could overlook the efficiency of total capital employed in the business. |
| ROCE (Return on Capital Employed) | – Provides a comprehensive view of efficiency in using all capital resources – helpful for comparing efficiency of companies within the same industry. | – Broad scope can mask specific investment performance. – Calculated from the liabilities side of the balance sheet and hence does not give a true picture of capital deployed in operating business vs non-operating assets. |
This table highlights each metric’s key strengths and limitations, helping to understand their utility and the contexts in which they are most effective.
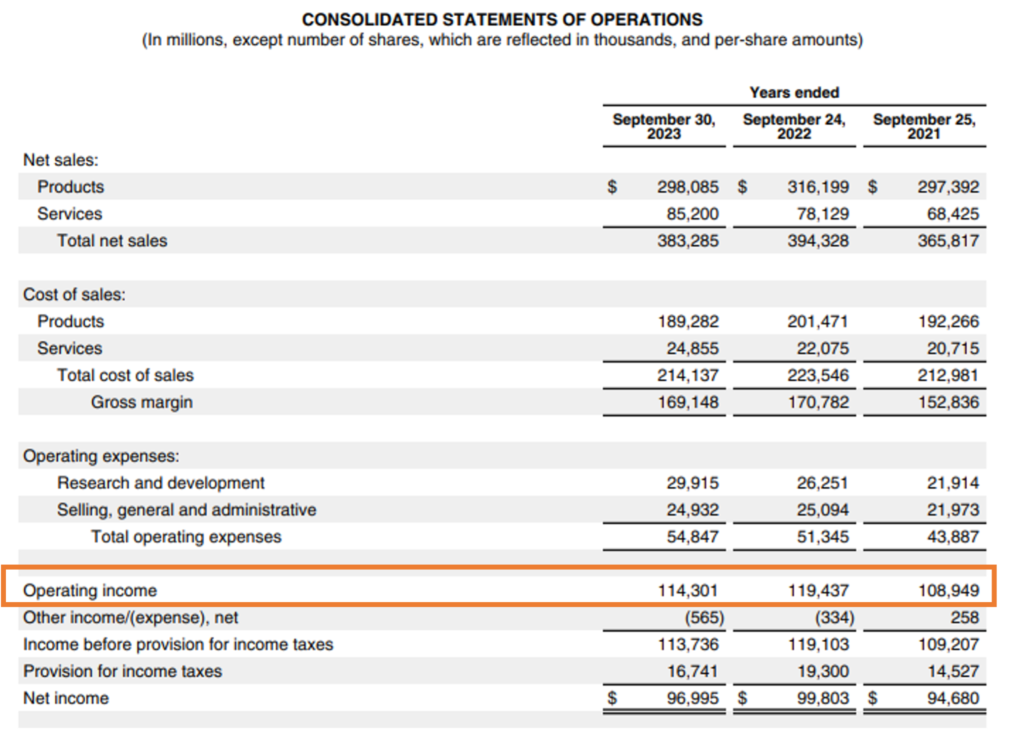
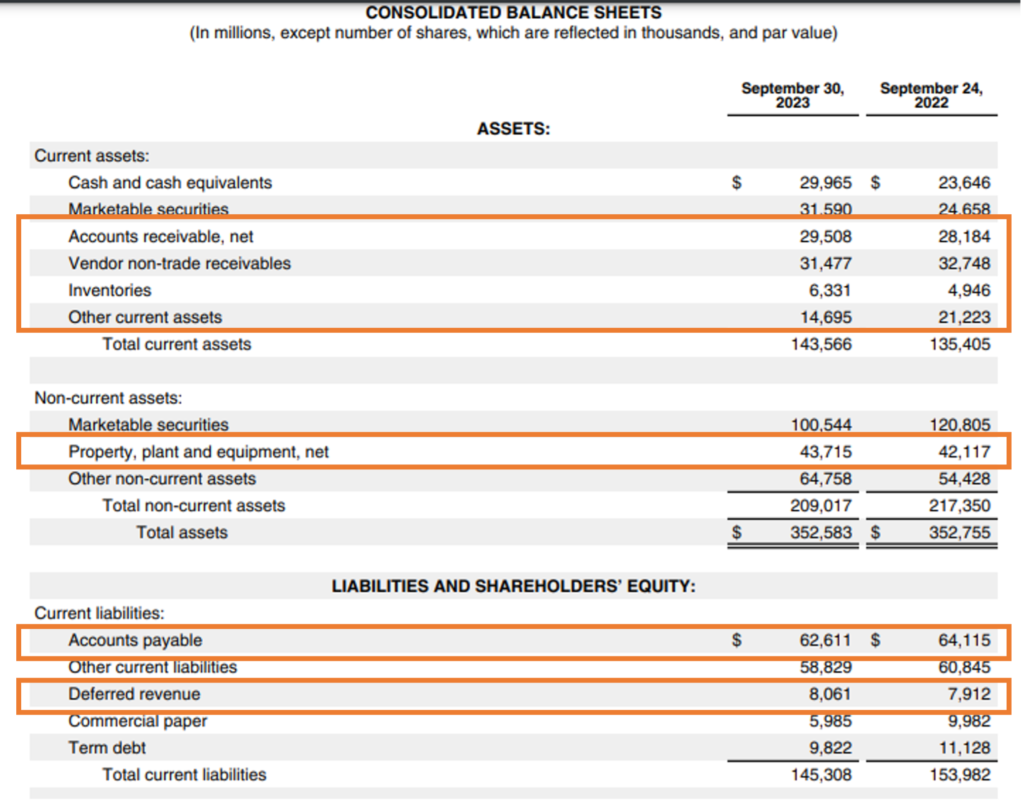
BALANCE SHEET AND INCOME STATEMENT OF APPLE INC. FOR REFERENCE

Source: Annual Report https://s2.q4cdn.com/470004039/files/doc_earnings/2023/q4/filing/_10-K-Q4-2023-As-Filed.pdf


Source: Annual Report https://s2.q4cdn.com/470004039/files/doc_earnings/2023/q4/filing/_10-K-Q4-2023-As-Filed.pdf
CONCLUSION
Both ROIC and ROCE are valuable metrics for assessing a company’s financial performance and efficiency in using its capital. While they are related, they provide different insights that can be complementary. ROIC offers a closer look at the returns generated from the capital invested in the operating business, aligning closely with shareholder value creation. On the other hand, ROCE provides a broader view of how well a company uses all its available capital to generate profits.
Understanding the nuances of these metrics allows investors and analysts to make more informed decisions, ensuring they can accurately gauge a company’s ability to create value and sustain profitability.


