
Zomato, a leading food delivery and restaurant discovery platform, has been making significant strides in India’s digital economy. In addition to its online food delivery, hyperpure (B2B business), Quick Commerce (BlinkIt) and Going out business, Zomato has expanded its services by acquiring Paytm’s movie and event ticketing businesses. These developments have bolstered investor confidence, with analysts maintaining a positive outlook on the company’s growth trajectory.
Given these advancements, understanding intrinsic value using Zomato DCF Valuation becomes crucial for investors aiming to make informed decisions. The Discounted Cash Flow (DCF) method offers a comprehensive approach to assess the company’s financial potential by projecting future cash flows and discounting them to their present value. Let’s delve into the steps involved in valuing Zomato using DCF.
You can download the Zomato DCF Valuation model and follow the steps outlined below:
STEPS FOR ZOMATO DCF VALUATION
STEP 1: GATHERING FINANCIAL STATEMENTS
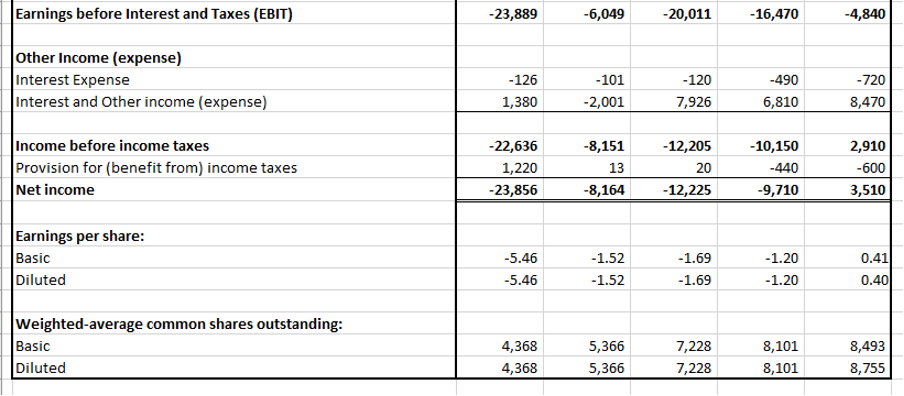
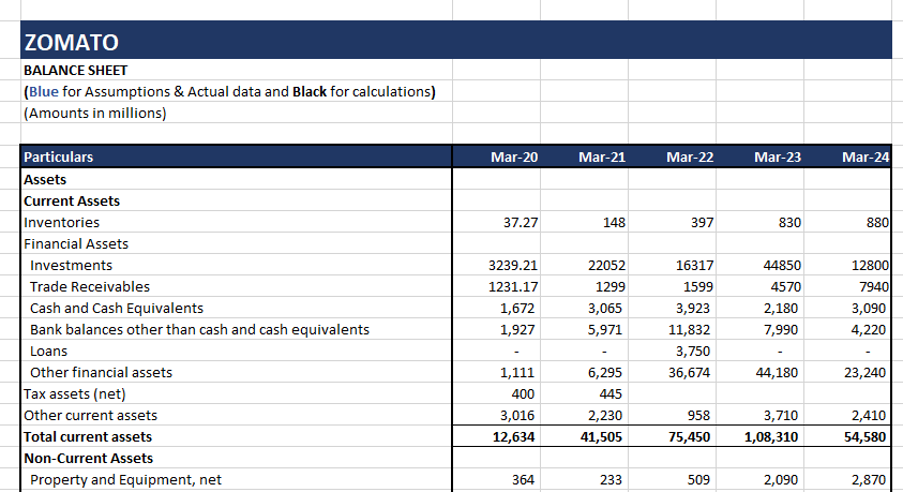
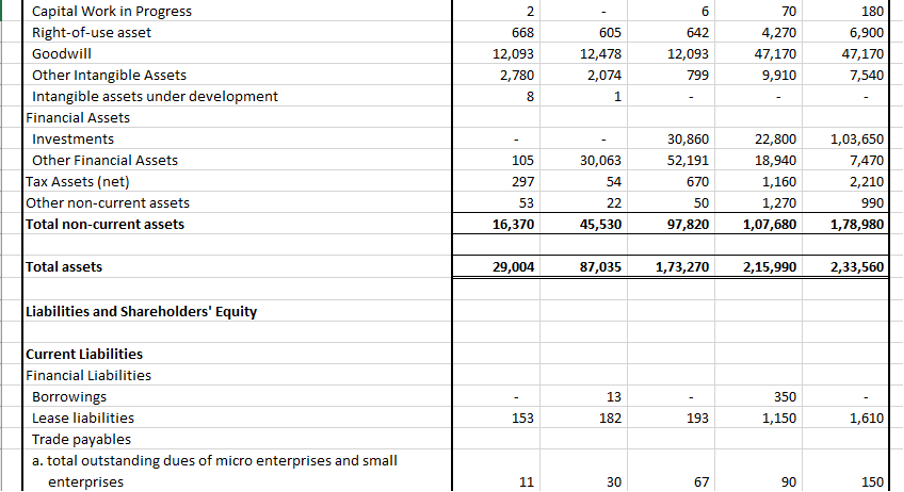
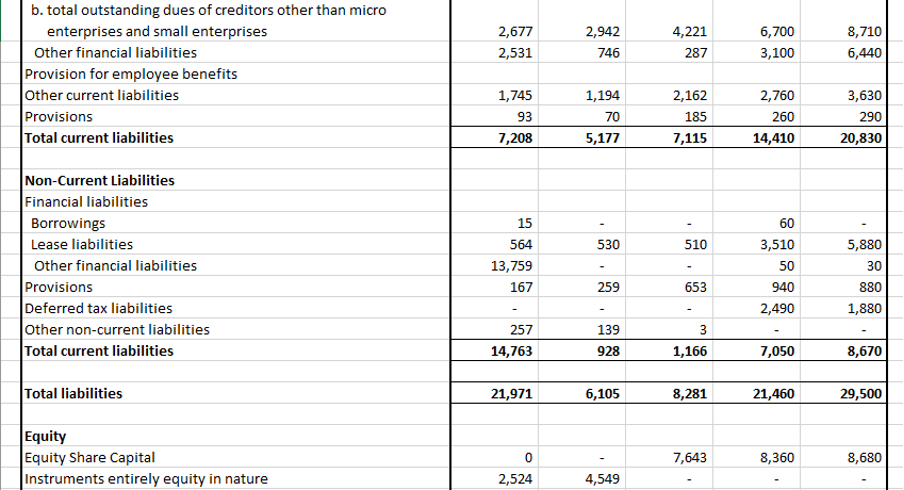
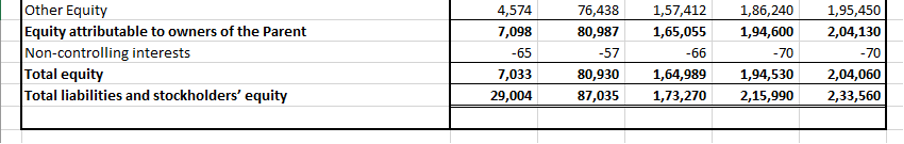
The first step in the DCF model is collecting Zomato’s historical financial statements, including the income statement and the balance sheet. This data provides insights into revenue trends, cost structures, and profitability, forming the basis for future projections. We have collected historical data for 5 years from the year 2020 to 2024 from the annual reports of the company available in the Financials section of the company (https://www.zomato.com/investor-relations/financials).
Below is the historical Income Statement and Balance Sheet of the company.

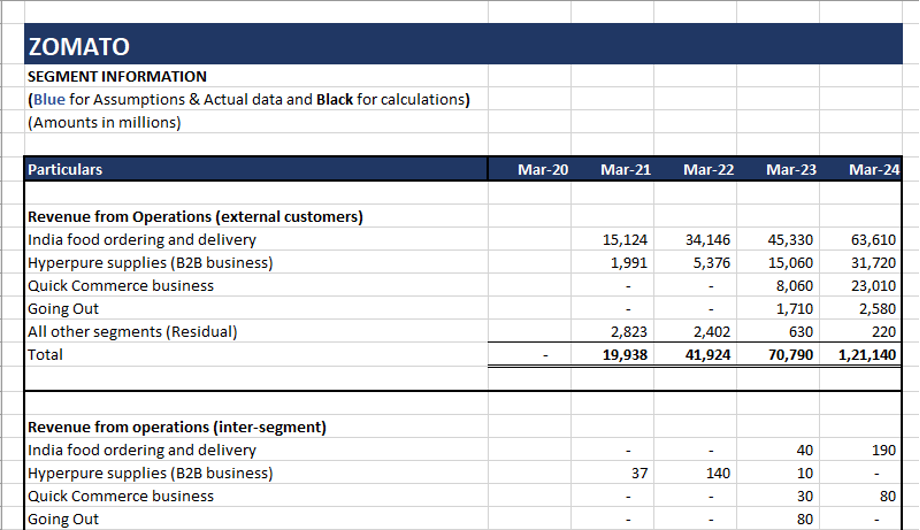
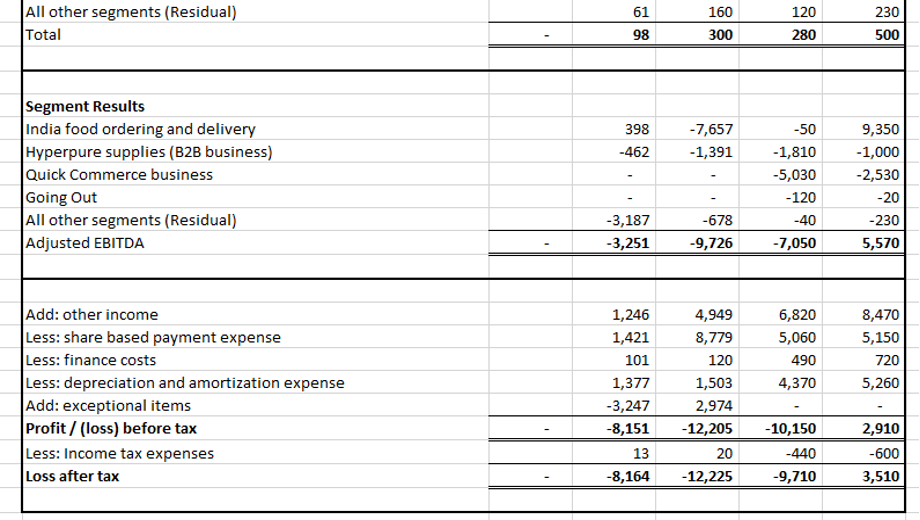
We can also gather segment level information for the business being valued so as to better understand which business is driving maximum profit to the business and helps to better forecast the financials.
**
STEP 2: CALCULATING THE DISCOUNT RATE (WACC)
To discount future cash flows, we need an appropriate discount rate, often represented by the Weighted Average Cost of Capital (WACC). WACC is calculated using the following formula:
WACC = (We * Ke) + (Wd *Kd * (1-Tc))
Where:
E = Market value of equity
D = Net Book value of Debt i.e., Book value of debt and debt equivalents less cash & cash equivalents
V = Total market value of equity and Net Book value of debt (E + D)
Ke = Cost of equity
Kd = Cost of debt
Tc = Corporate tax rate
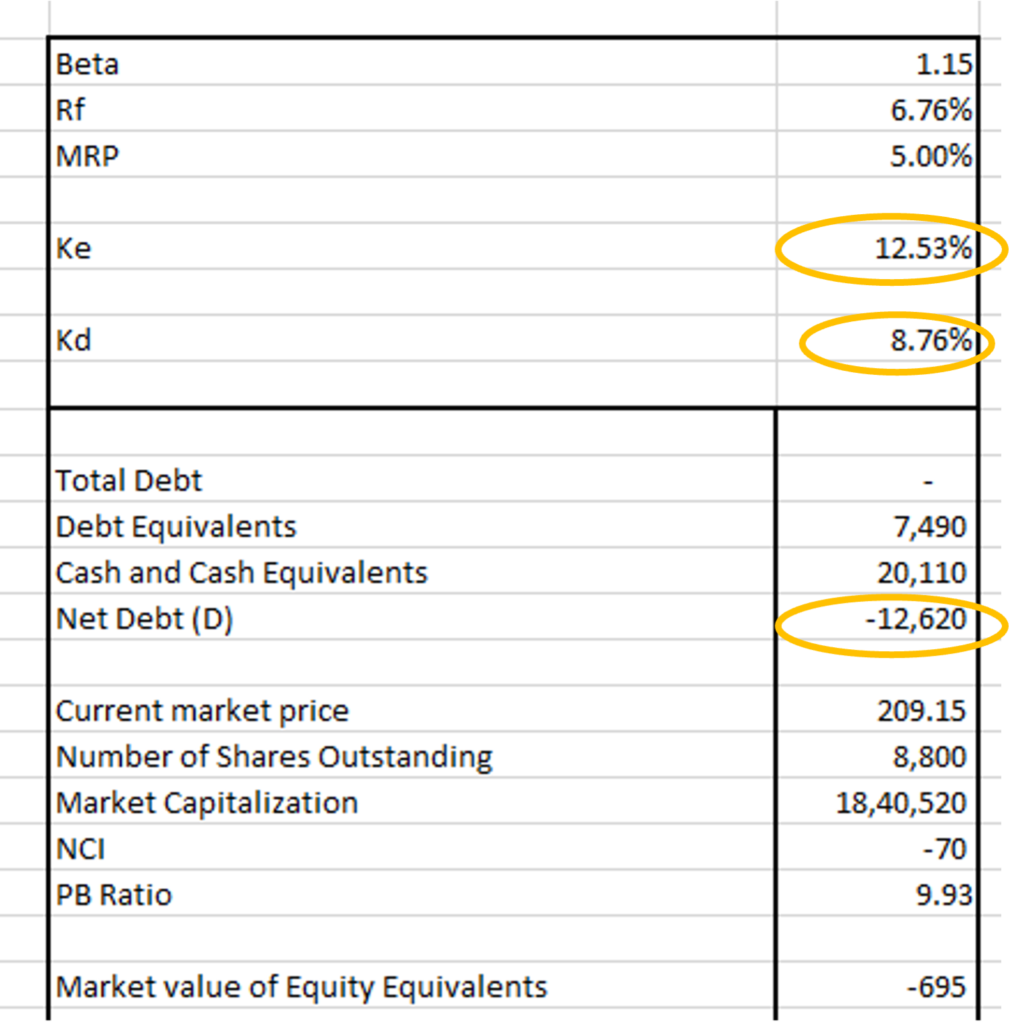
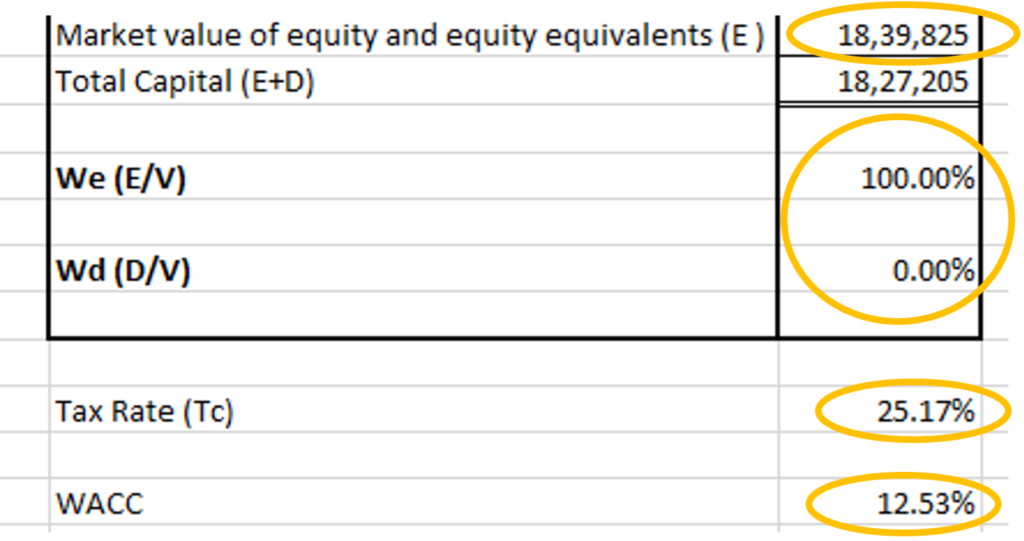
In case of Zomato, the inputs for WACC are as following:
a) E = Market Value of Equity
= Current Market price * Number of common shares outstanding + Book value of Non-controlling Interest * P/B ratio
= ₹209.15 * 8,800 mn + ₹(-70)mn * 9.93
= ₹18,40,520 mn + (-695) mn
= ₹18,39,825 mn
b) D = Book Value of Debt + Book Value of Debt Equivalents – Cash and Cash Equivalents
= ₹0 + $7,490 mn – ₹20,110 mn
= -₹12,620 mn
c) V = E+ D
= ₹18,39,825 mn + ₹12,620 mn
= ₹18,27,205 mn
d) We = Min (E/V,100%)
= Min (₹18,39,825/₹18,27,205, 100%)
= Min (101%, 100%)
= 100%
e) Wd = 1- We
= 1-100%
= 0%
f) Ke = Risk free rate of return+ Beta * Market risk premium
= Rf + β* (MRP)
We have worked out the Beta of Zomato to be 1.15 by Regression analysis. Rf is taken as the 10 year India Government bond rate which is 6.76%. MRP is assumed to be 5%.
Hence,
Ke = 6.76% + 1.15 * 5%
= 12.53%
g) Kd= Cost of Debt
= 8.76%
We have assumed cost of Debt to be 8.76% (2% higher than the risk free rate).
h) Tc = Corporate tax rate
= 25.17%
Tax rate is taken as 25.17% as mentioned in the annual report of the company.
Hence, the WACC is calculated as below
WACC= 100% * 12.53% + 0% * 8.76% *(1- 25.17%)
= 12.53% +0%
= 12.53%
Below is the working for WACC in the Excel.
**
STEP 3: PROJECTING FUTURE CASH FLOWS
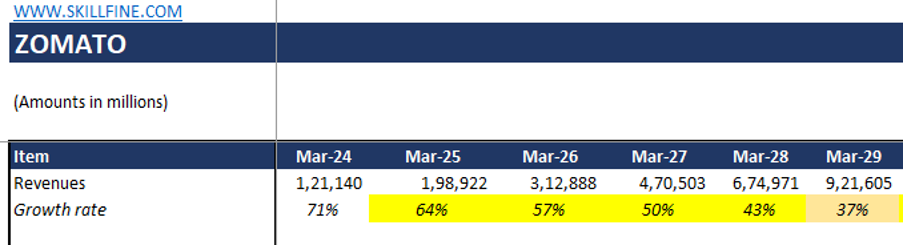
With historical financials in place and WACC determined, the next step is forecasting future cash flows. Given the historical data for 5 years from 2020 to 2024, we are forecasting future cash flows from 2025 to 2039.
A) Forecasting Revenue:
- First 5 years from 2025 to 2029: First we will start from forecasting the Revenue of Zomato. The company has a very high year on year historical growth rate due to introduction of two new segments – BlinkIt and Going Out but also faces a tough competition from companies like Swiggy and Ubereats.
Hence, given the tough competition it faces, we have assumed that the revenue growth rate will linearly decline over the first 5 years in the forecast from 2025 to 2029. We have assumed that the revenue growth rate in the year 2029 will be 37% (average of the years 2023 and 2024 revenue growth rate of food delivery segment) and hence, declined the growth rate from 71% to 37% over a period of 5 years.
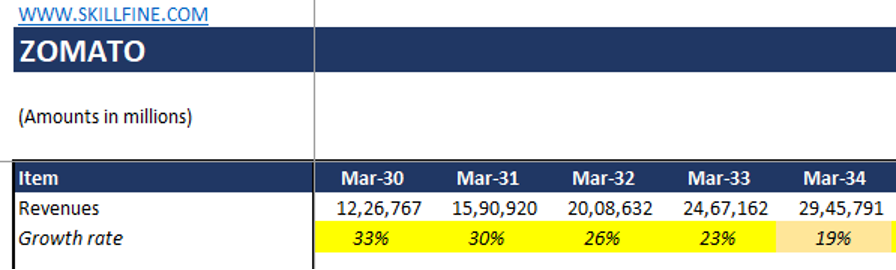
- Next 5 years from 2030 to 2034: For the next 5 years of the forecast we have assumed that the growth rate will be 2 times the GDP growth rate in the 10th year. GDP growth rate is taken as the long term India nominal GDP growth rate of 9.7%
Hence we have fixed the growth rate for 2034 as 19.7%% (2* 9.70). Keeping the growth rate of 2034 constant we have linearly declined growth rate from 37% to 19% from 2029 to 2034.
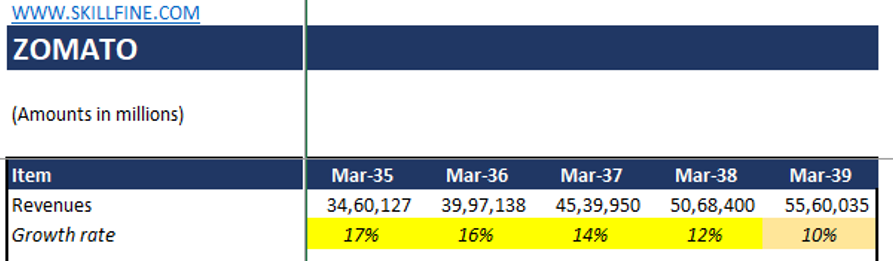
- Next 5 years from 2035 to 2039: We have further assumed that by the 15th year in our forecast the revenue growth will be equal to the GDP growth rate of 9.7%. We have assumed our terminal growth rate to be equal to the GDP growth rate since in the long run this will be the justified rate at which our revenue will grow in the competitive market. Hence we have linearly declined growth rate from 19.40% in 2034 to 9.7% in 2039.
*
B) Forecasting EBITDA margin:
Zomato’s negative EBITDA margin from 2020 to 2023 can be attributed to high operating costs, aggressive expansion strategies, and sustained discounting to capture market share. The company has invested heavily in growing its food delivery business and quick-commerce segment (Blinkit), leading to increased marketing, technology, and operational expenses. Additionally, deep discounting and incentives for customers and delivery partners have put pressure on margins. High fixed costs, including employee expenses and technological infrastructure, have further contributed to operating losses at EBITDA level. However, as economies of scale improve and operational efficiencies are realized, Zomato is expected to deliver positive EBITDA margin in the coming future. Our assumptions for the EBITDA margin are as following:
- First 5 years from 2025 to 2029: We are assuming that over the first 5 years of the forecast the EBITDA margin will linearly improve from the current 0% in the year 2024 to 8% in 2029. We are assuming that in the next 5 years Zomato EBITDA margin will stabilize and match the EBITDA margin of established retail player in India (example like DMart) around 8%.
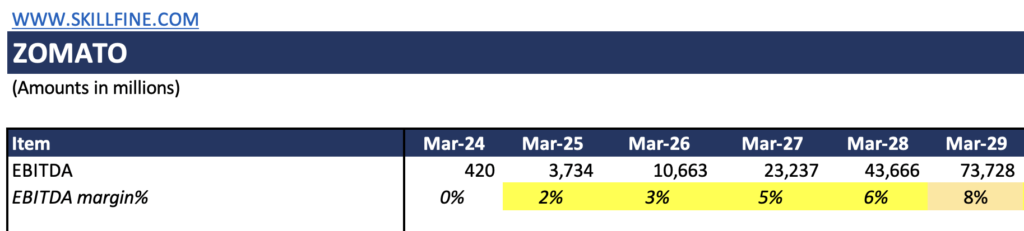
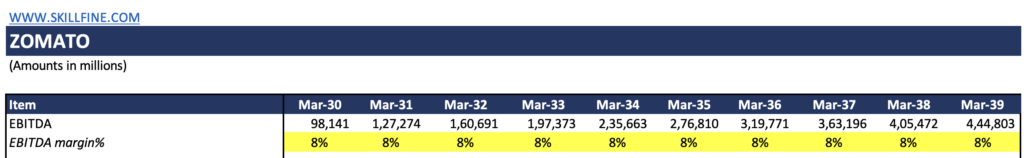
- Next 10 years from 2030 to 2039: From the 6th year of the forecast, we are assuming that Zomato will maintain a constant EBITDA margin of 8% given the tough competition in the market.
**
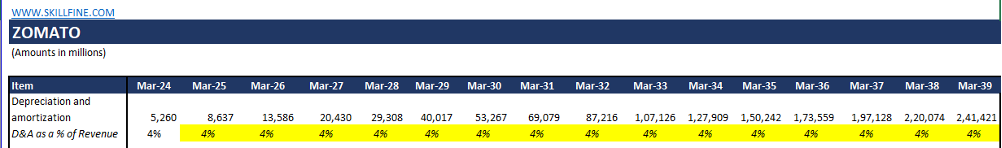
C) Forecasting Depreciation:
We have assumed that the depreciation as a percentage of revenue shall remain the same as that of the latest historical year taken in our DCF valuation. In our model the depreciation as a percentage of revenue for the year 2024 is 4% and hence we have taken a constant rate of 4% from the year 2025 – 2039 and then calculated the depreciation.
*
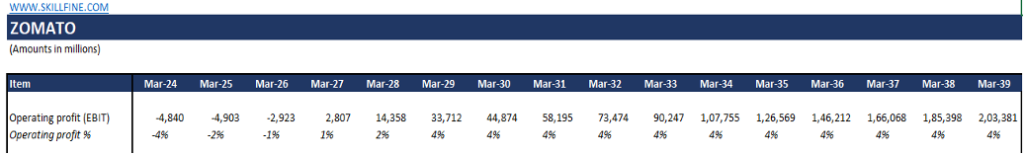
D) Forecasting Operating profit:
Operating profit is the difference between the EBITDA and depreciation calculated above. We can see that the operating profit margin of Zomato which was negative in the historical year 2024 has gradually turned positive to 4% over the first 5 years of the forecasted period (2025 to 2029). However, since we have assumed our EBITDA margin to remain constant over the next 10 years of the forecasted period (2030 to 2039), our operating profit margin remains constant at 4% over the next 10 years of the forecasted period.
*
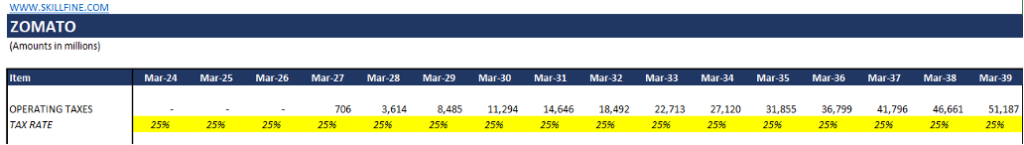
E) Forecasting Operating Taxes:
We have taken the operating taxes rate to be 25.17% as mentioned in the annual reports of the company. Operating taxes are calculated by multiplying operating profit with the operating tax rate.
*
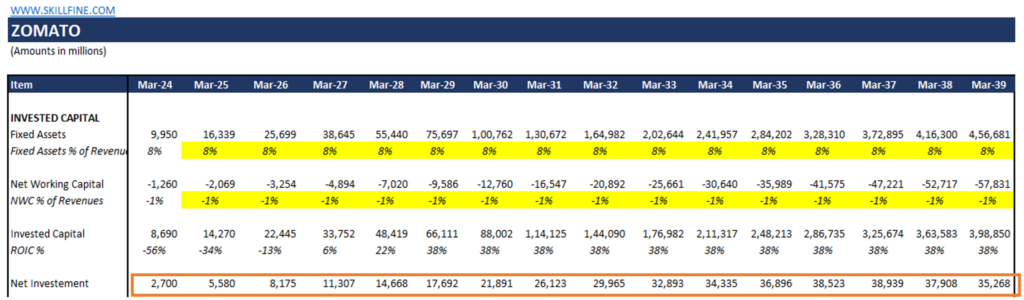
F) Forecasting Net Investment:
Net Investment is the amount of cash flow which is invested back in the business. We calculate Net Investment as the difference between the Invested capital of two-time period. For example, for the year 2025, the
Net Investment = Invested Capital (2025) – Invested Capital (2024)
= ₹14,270 – ₹8,690
= ₹5,580
Invested Capital is the sum of Investment in Fixed Assets of the company and Net working capital tied to the operations of the company.
Fixed Assets in case of Zomato is considered as the summation of Property and Equipment, Capital work in progress and Right of use assets for the historical years. The fixed assets as a percentage of revenue comes as 8% for the year 2024 and we are assuming that Zomato has maintained this percentage for the 15 years of forecasted period. Given the Fixed assets as a percentage of revenue and Revenue amount, we can easily calculate the amount of Fixed assets for the forecasted period.
Net Working Capital in case of Zomato is considered as the summation of Inventories, Trade Receivables and Other current assets less Trade payables and Other current liabilities. The Net Working Capital as a percentage of revenue comes as -1% for the year 2024 and we are assuming that Zomato has maintained this percentage for the 15 years of forecasted period. Given the Net Working Capital as a percentage of revenue and Revenue amount, we can easily calculate the amount of Net Working Capital for the forecasted period.
*
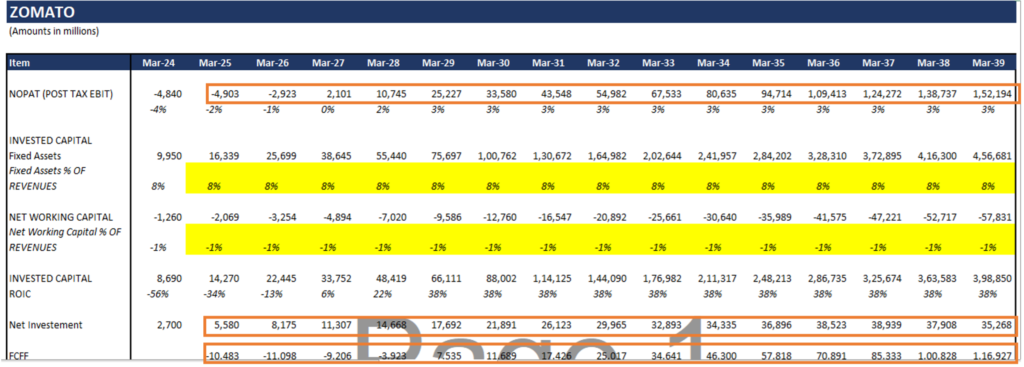
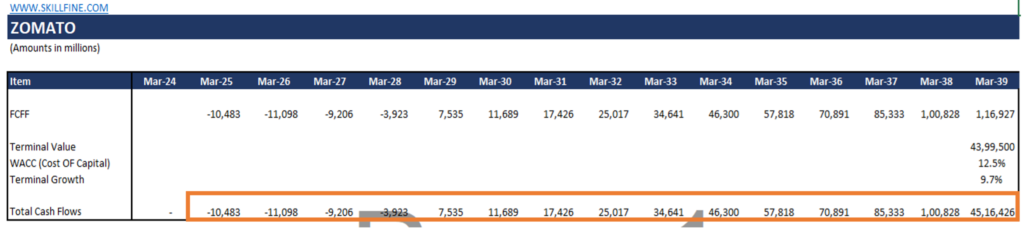
G) Forecasting Free Cash for Firm (FCFF):
Free cash for Firm(FCFF) for the 15 years forecasted period is calculated as below:
FCFF= EBIT (1-Tax) – Net Investment
= NOPAT – Net Investment
For example, FCFF calculation for the year 2025 is
FCFF = NOPAT (2025) – Net Investment (2025)
= ₹4,903 – ₹5,580
= ₹10,483
**
STEP 4: CALCULATING THE TERMINAL VALUE
Beyond the explicit forecast period of 15 years, a terminal value is computed to capture the company’s value beyond the projection horizon. In this model, a terminal value is calculated as below.
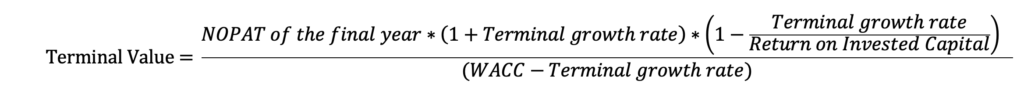
=₹1,52,194 * (1+9.7%) * (1-9.7%/38%)
(12.5% – 9.7%)
= ₹43,99,500 mn
**
STEP 5: DISCOUNTING CASH FLOWS TO PRESENT VALUE
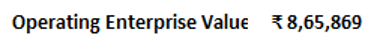
Using the WACC as the discount rate, the projected free cash flows and terminal value are discounted to their present value. The present value of free cash flows and terminal value comes to ₹8,65,869 mn. We call the present value of FCFF and Terminal value as the Operating Enterprise Value and is calculated using the NPV function in the Excel.
**
STEP 6: DERIVING THE INTRINSIC VALUE PER SHARE
Once the Operating enterprise value is calculated, we will add Non-Operating Assets not considered in the exercise of calculating free cash flow to arrive at the Gross Enterprise Value. From this Gross Enterprise Value, we will deduct net debt and debt equivalents and add cash and cash equivalents to provide the Equity Value.
The Equity Value works out to ₹10,02,969 mn, which is divided by the number of shares outstanding to give intrinsic value per share. The number of shares outstanding for Zomato is 8,755.25 million and the intrinsic value per share is ₹114.56.
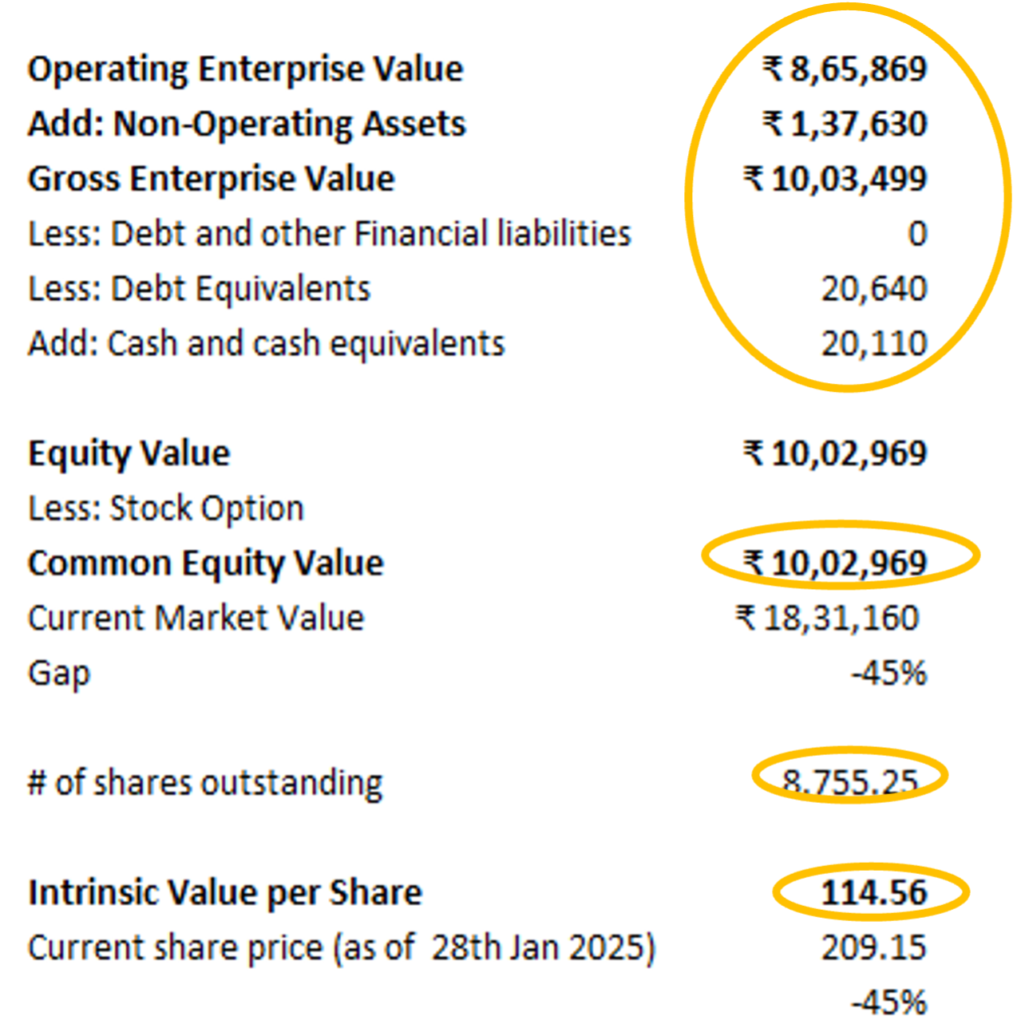
This intrinsic value per share price (114.56) is lower than the current share price (209.15) indicating
- Market is more optimistic on long term revenue and margin trajectory compared to what is assumed in this DCF model.
- If we maintain our revenue trajectory, long term EBITDA margin required to justify the current share price is 10%.
- Given high expectation built in both revenue and margin trajectory, Zomato will need to significantly outperform on both the dimensions.
CONCLUSION
The DCF valuation of Zomato provides a well-rounded perspective on its financial future and growth potential. While the company has faced operating losses due to expansion and competitive pricing strategies, its strong revenue growth and improving margins indicate a promising trajectory. From the article above we understand that Zomato’s current market price of $209.15 is higher than the intrinsic value of $114.56 (based on the DCF model), indicating investors are more optimistic about its long-term growth and profitability than what is assumed in this DCF model. With high expectations baked into both revenue and profitability, the company must deliver exceptional performance on both fronts to sustain its market valuation. However, given the dynamic nature of the food delivery and quick-commerce industries, investors should remain vigilant about evolving market conditions, competitive pressures, and macroeconomic factors.
Disclaimer: The purpose of this article above is to illustrate a systematic approach to conduct a DCF based valuation for any company and make reasonable assumptions about growth and profitability without forming any opinion on investment advice.

