
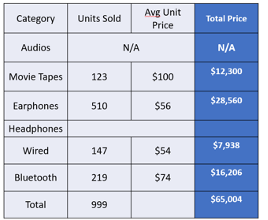
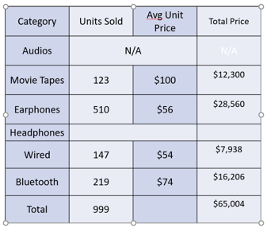
Let us begin with a simple question? Which of the following data samples is easier to understand –
| SAMPLE 1 | SAMPLE 2 |

Clearly, sample 2 is a better tabular organized data.
Using regular text to create your slides is usually adequate. However, for more structured content, consider using a table. This approach allows you to organize your text in columns and rows rather than lines or paragraphs. Tables are essential for creating visually appealing and well-organized presentations.
Whether you are preparing a business report, academic presentation, or any other type of visual content, knowing how to effectively utilize tables can significantly enhance your communication.
This guide will walk you through the steps to insert and format tables in PowerPoint, ensuring your presentations are professional and impactful.
Why do we need tables in PowerPoint?
- Clarity and Organization: Tables allow you to present data systematically, making it easier for your audience to understand and interpret information.
- Comparisons: Tables enable side-by-side comparisons of data points. This is particularly useful for highlighting differences and similarities, trends, and patterns within your data.
- Efficiency: Tables can condense large amounts of data into a small space, making it easier to display comprehensive information without overwhelming the audience.
- Professional Appearance: Well-designed tables add a professional touch to your presentation, making it look more polished and credible.
- Accessibility: Tables make data accessible at a glance, allowing your audience to quickly grasp the essential points without having to read through lengthy paragraphs.
How to create a Table in PowerPoint?
- Go to the Insert tab.
2. Click the table command.
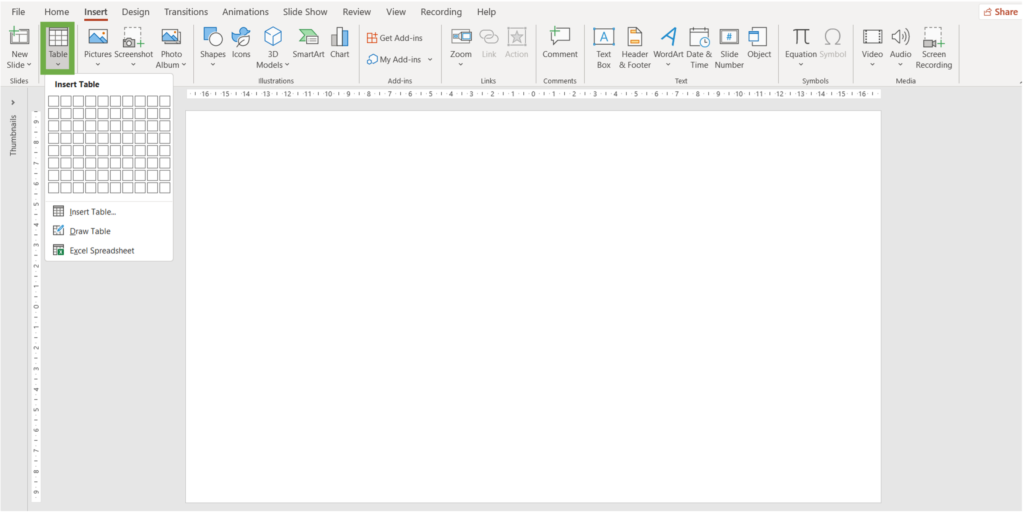
3. Hover your mouse over the grid to select the number of cells you want.
4. To move your table, place your cursor on its edge and drag it to your desired position.
5. To change the size, use the sizing handles.
6. To insert text, simply click on the desired cell and type.
Pro tip: Use Arrow Keys and Tab key to make navigating easier
***
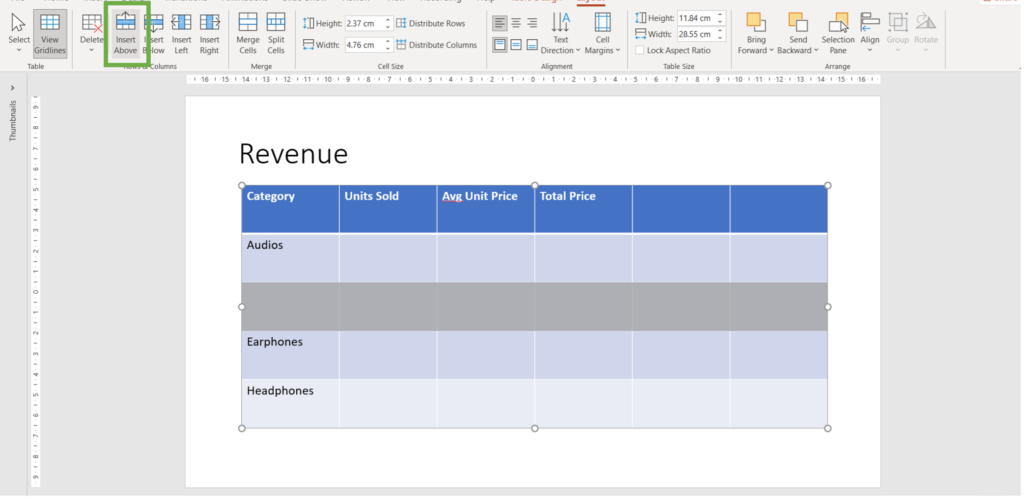
How do you insert columns and rows in a table?
- Select the table and go to the Layout tab
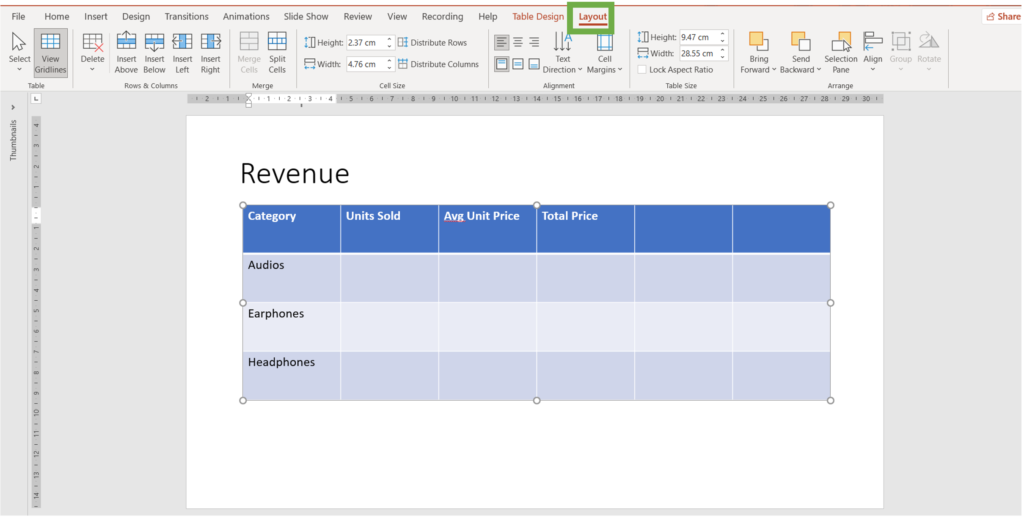
2. Navigate to the Rows & Columns Group
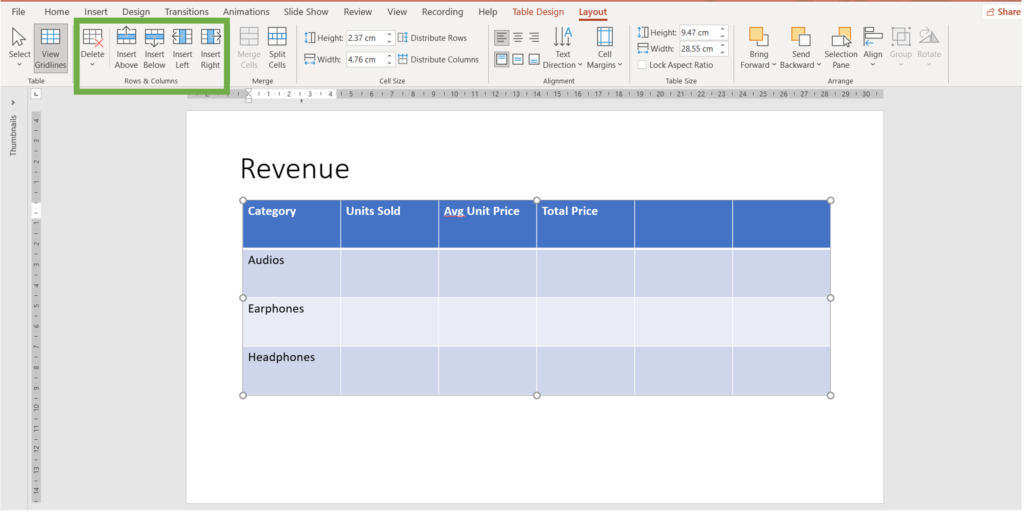
3. Select the cell above/beside which you wish to insert a row/column and click on the one you desire.
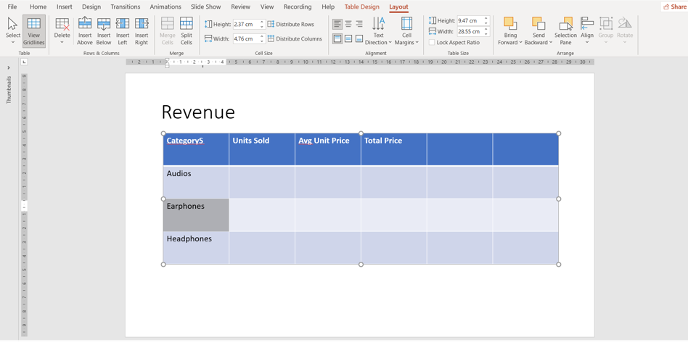
4. In the given example we chose “insert above”.
5. Watch the video below to understand the steps in detail:
***
How to delete columns and rows in a table in PowerPoint?
- Place your cursor on the row/column you desire to delete and navigate to the Layout Tab.
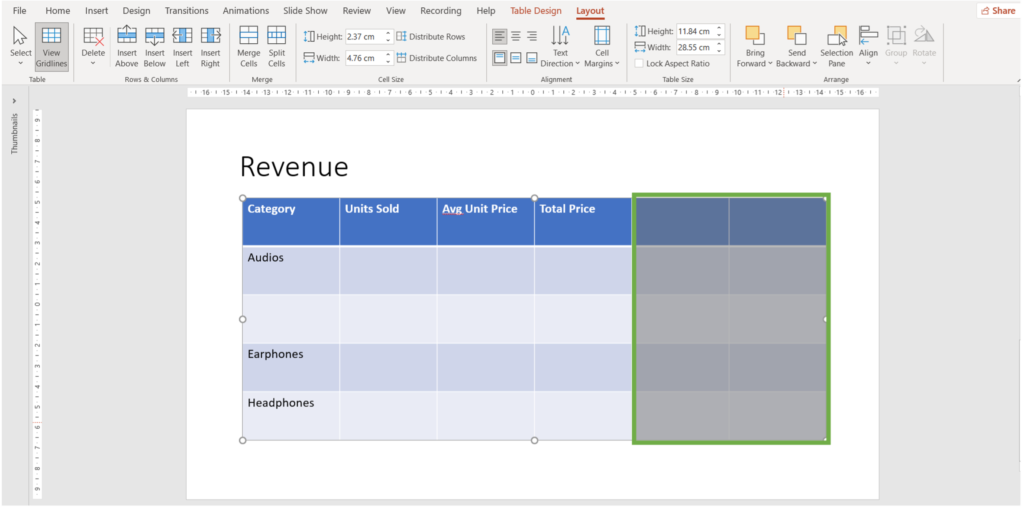
2. Navigate to the Rows & Columns group
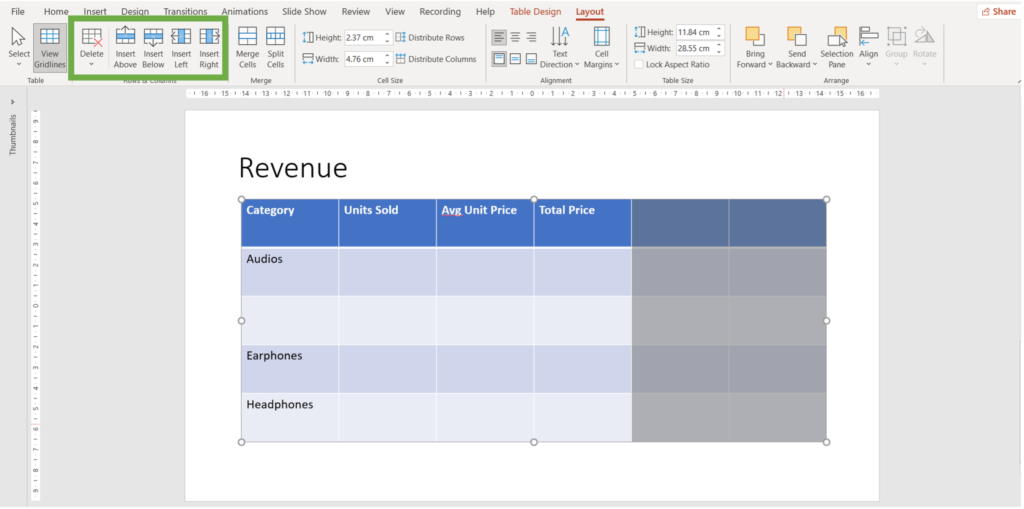
3. Click on delete and click on delete columns/rows.
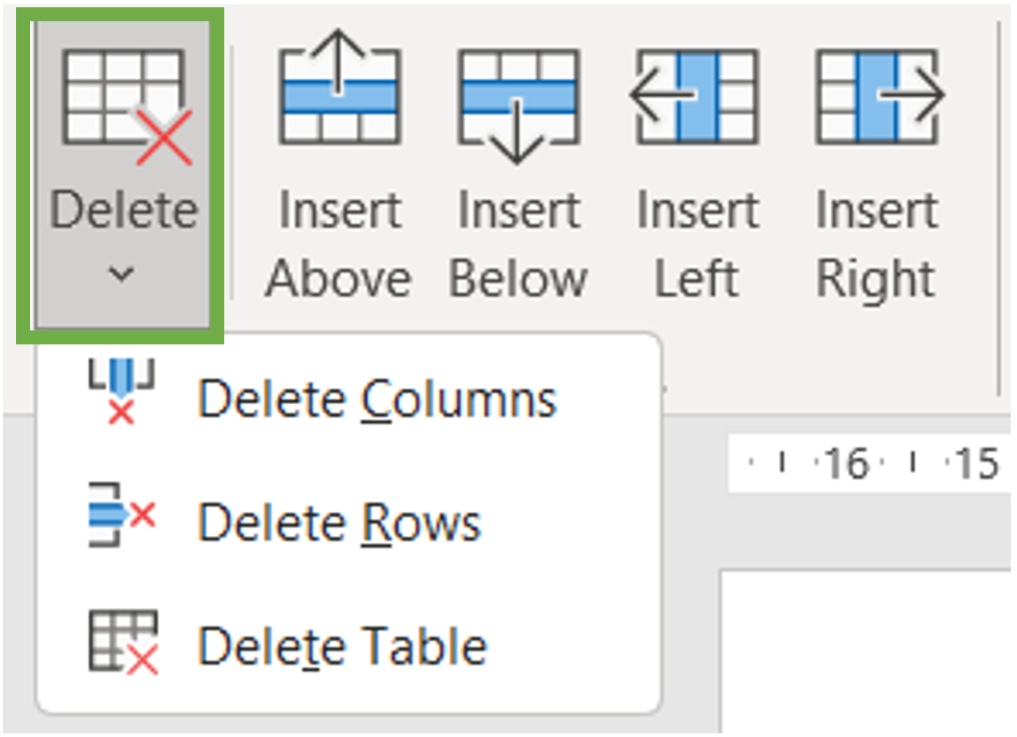
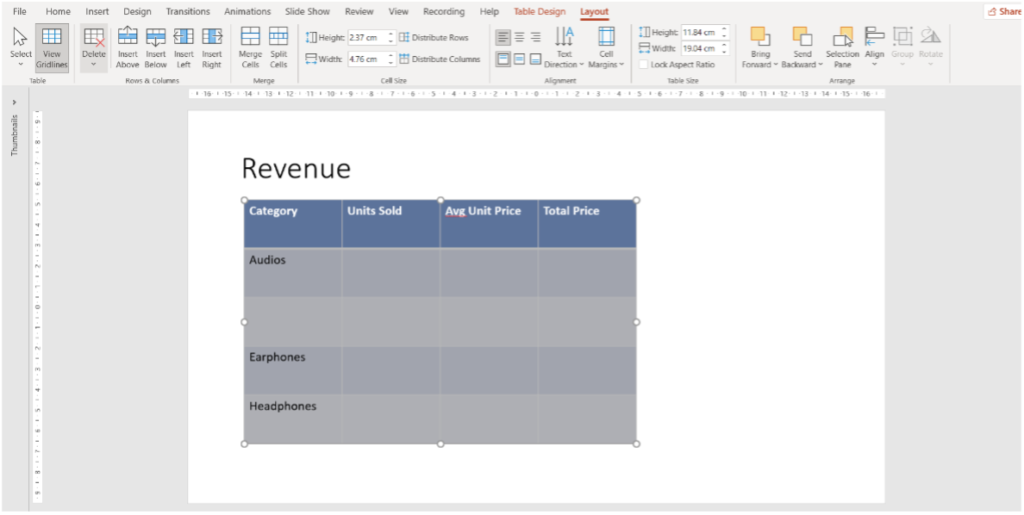
4. In the given example we chose “delete columns”.
5. Get a replay of the above steps in this video:
***
Sizing your tables in PowerPoint
- Cell Size
Cell size refers to the dimensions of individual cells within a table, including their height and width. Adjusting cell size can help you control how content fits within each cell and can improve the table’s readability and appearance.
To adjust the height or width of individual cells, click on the cell or select multiple cells, then drag the cell borders to resize them.
Alternatively, you can use the Layout tab on the Ribbon to manually enter specific height and width values in the Cell Size group.
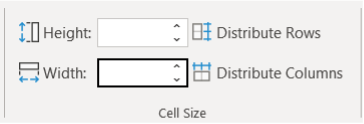
Add the desired size in height and width boxes as show below:
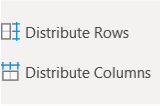
Distribute rows and columns
The Distribute feature ensures that all rows within a selected table are of equal height and width. This is particularly useful when you want a neat and uniform appearance.
Select the Table, go to the Layout Tab navigate to the Cell Size group, and click on the Distribute Rows/Columns button. Watch the video below to understand the steps one by one:
2. Table size
Table size refers to the overall dimensions of the entire table, including all its cells, rows, and columns. Adjusting table size can help you fit the table within your slide and ensure it aligns well with other content.
- To adjust the overall size of the table, click on the table to select it, then drag the table handles at the corners or edges to resize the entire table.
- You can also use the Layout tab to adjust the table size by specifying dimensions in the Table Size group.

Pro tip: Select Lock Aspect Ratio to maintain the overall proportions of the table while resizing.
***
Splitting and Merging Table Cells
Splitting and merging cells in PowerPoint tables allow you to customize the layout and structure of your data, giving you greater flexibility in how you present information.
Splitting Cells
Splitting cells involves dividing a single cell into multiple cells, either horizontally, vertically, or both. This is useful when you need to add more detailed information within a single cell’s space.
How to Split Cells:
- Click on the cell you want to split.
- Go to the Layout Tab

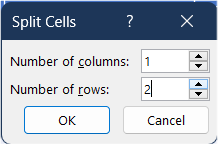
3. In the Merge group, click the Split Cells button. A dialog box will appear.

4. In the dialog box, enter the number of columns and rows you want to split the cell into, then click OK.
Merging Cells
Merging cells involves combining two or more adjacent cells into a single cell. This is useful when you want to create a header that spans multiple columns, or when you need a single cell to cover a larger area.
How to Merge Cells?
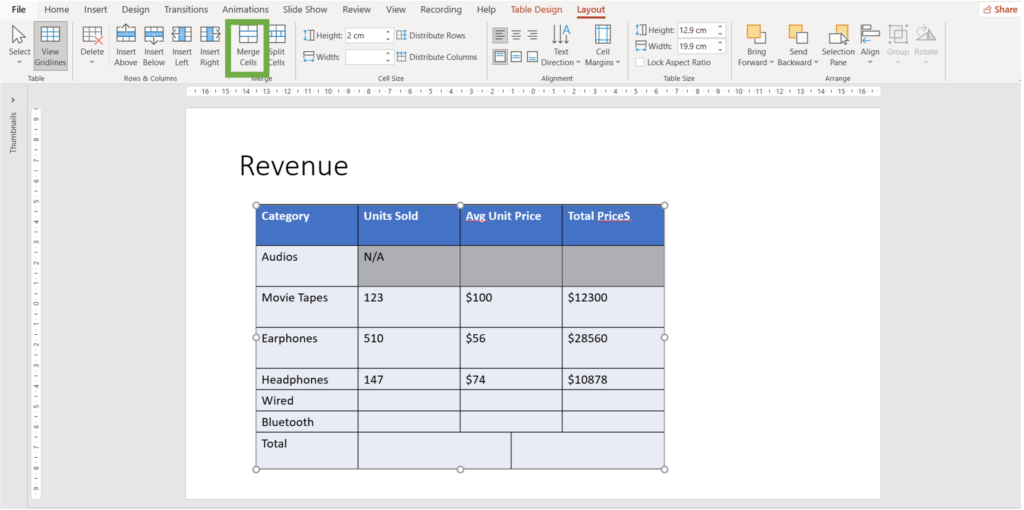
- Click and drag to select the cells you want to merge. The cells must be adjacent.
- Go to the Layout Tab

3. In the Merge group, click the Merge Cells button. The selected cells will combine into a single cell.
4. Check the video below and see how the cells will merge into 1 by following the above steps:
***
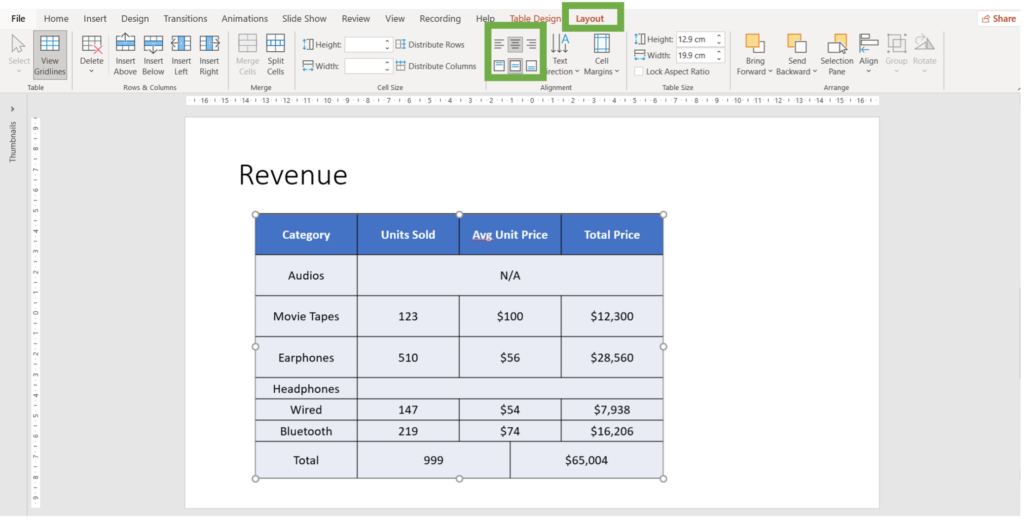
Alignment in Table
Aligning content in PowerPoint tables ensures that your data is presented in a clear, organized, and visually appealing manner. Proper alignment in PowerPoint helps improve readability and enhances the overall professional look of your tables.
How to Align Content in Table Cells
- Click on the cell or drag to select multiple cells where you want to align the content. (You can also select the whole table)
- Go to the Layout Tab
- In the Alignment group, click the appropriate button for left, center, right, top, middle, or bottom alignment.
4. Watch the video for a more detailed instruction:
***
Table Design
- Table style options
PowerPoint offers a variety of table style options to enhance the visual appeal and clarity of your tables. These styles provide predefined formatting choices that can be applied quickly and easily, saving you time and ensuring a professional look.
- Select the Table
- Click the Table Design tab. Navigate to table style options. Let us discuss them one by one below.
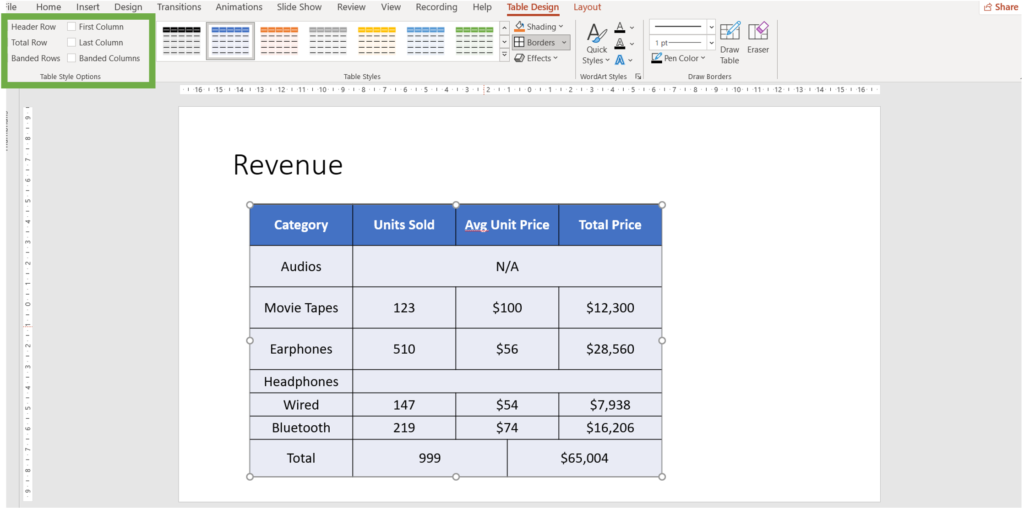
-> Header Row: Highlights the first row of the table, typically used for headers. Enables bold text and distinctive background color.
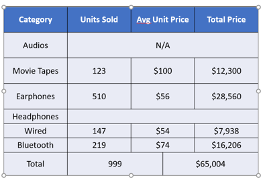
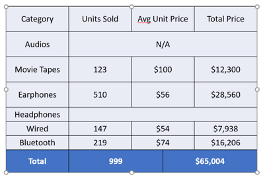
->Total Row: Highlights the last row of the table, often used for totals or summaries.
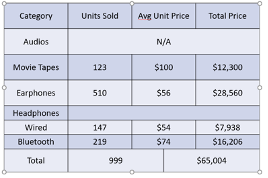
-> Banded Rows: Applies alternating row colors to improve readability, especially in tables with many rows.
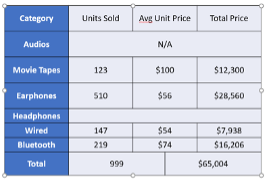
-> First Column: Highlights the first column, useful for emphasizing labels or key data.
-> Last Column: Highlights the last column, often used for totals or important figures.
-> Banded Columns: Applies alternating column colors to enhance the table’s visual structure.
2. Table Styles
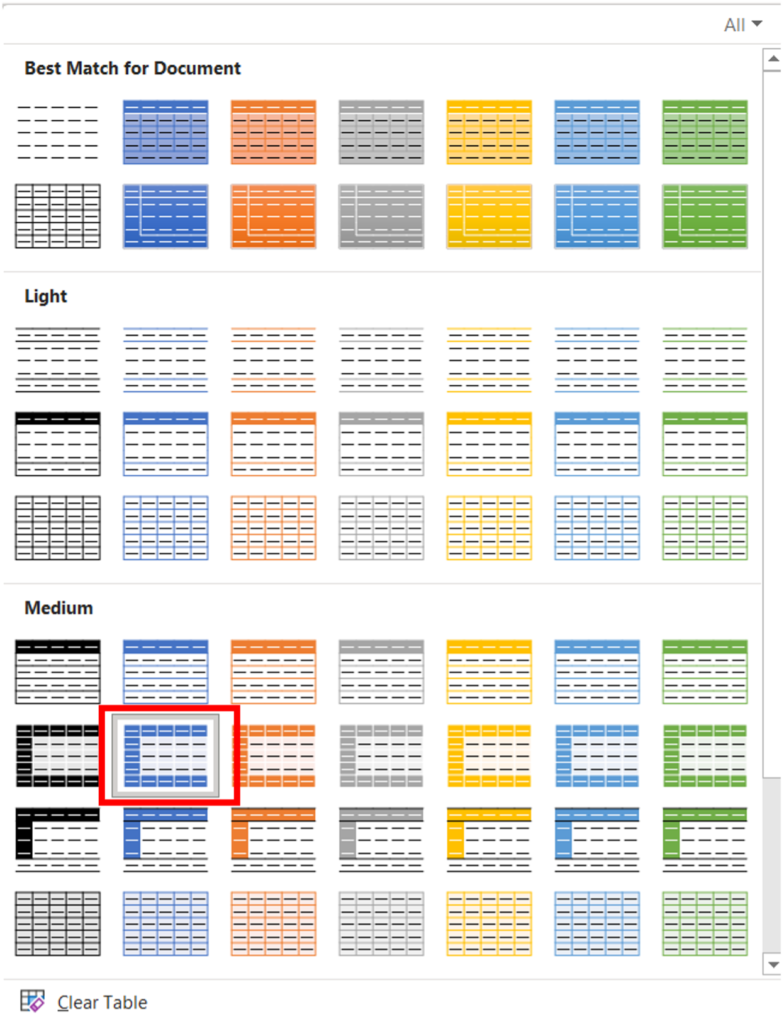
- Predefined Styles: PowerPoint offers a variety of predefined table styles categorized into Light, Medium, and Dark. These styles include different combinations of colors, shading, and borders.
-> Light Styles: Subtle colors suitable for tables on light backgrounds.
-> Medium Styles: Balanced styles with moderate color intensity.
-> Dark Styles: Bold styles with strong colors, ideal for tables on dark backgrounds.
- Select the table and navigate to the table design tab
- Navigate to the table styles group and you will see predefined styles
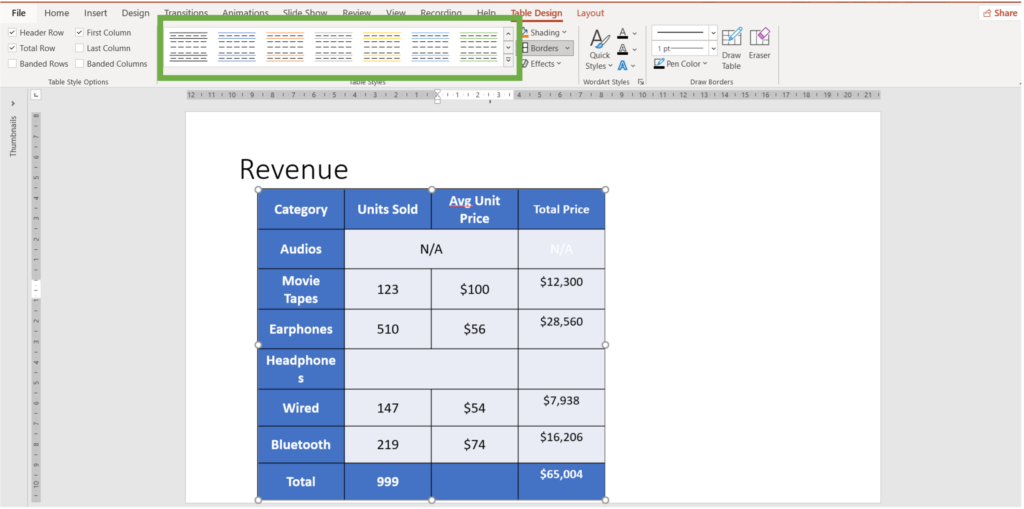
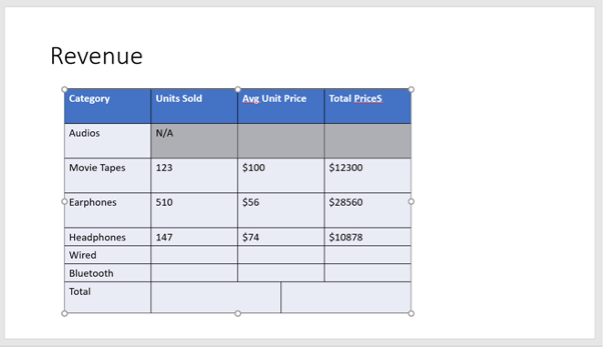
3. For the above design, we chose the below design block (highlighted in red) from the medium table design panel
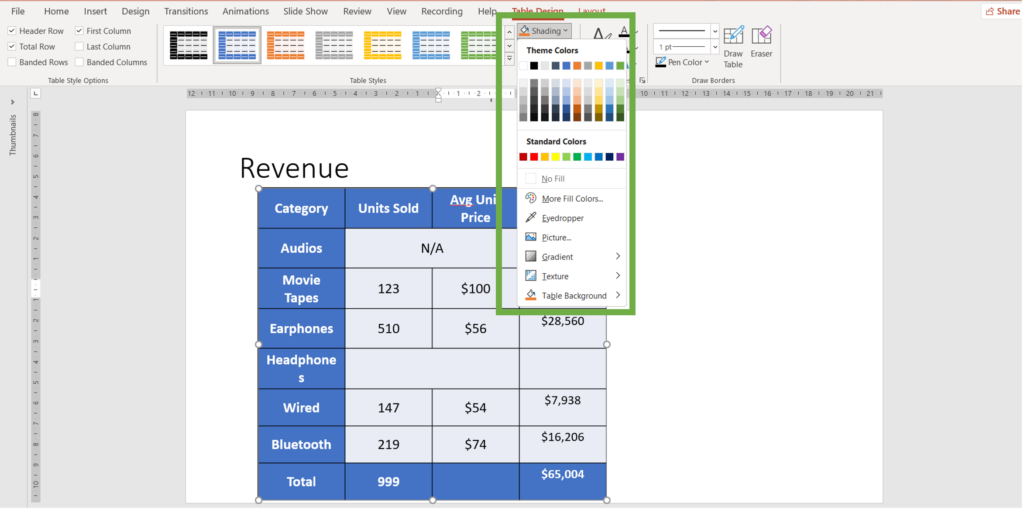
-> Shading: Change the background color of cells, rows, or columns. Click on the Shading button in the Table Design tab and choose a color from the palette.
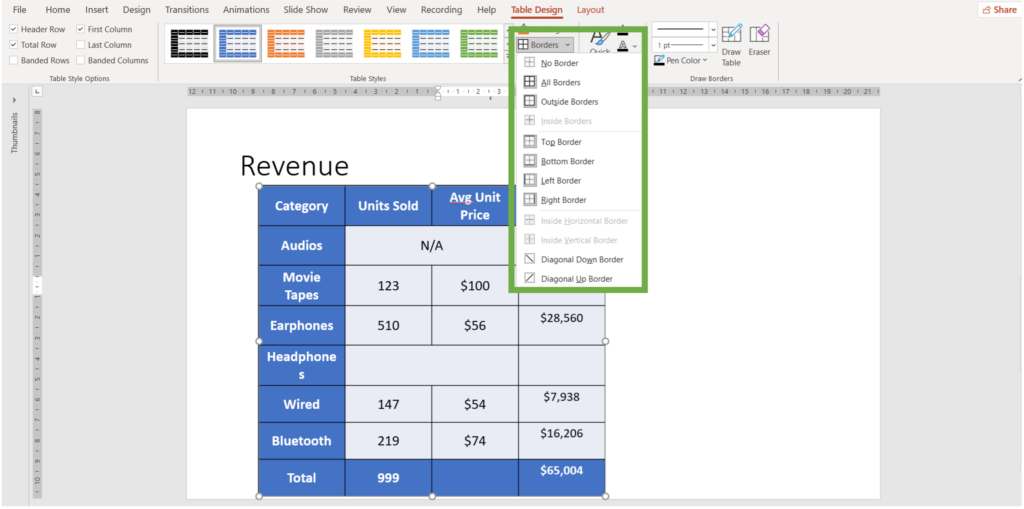
-> Borders: Customize the borders of the table. Use the Borders button in the Table Design tab to add or remove borders and to change border styles and colors.
To customize the style, color, and thickness of borders. Navigate to draw borders group
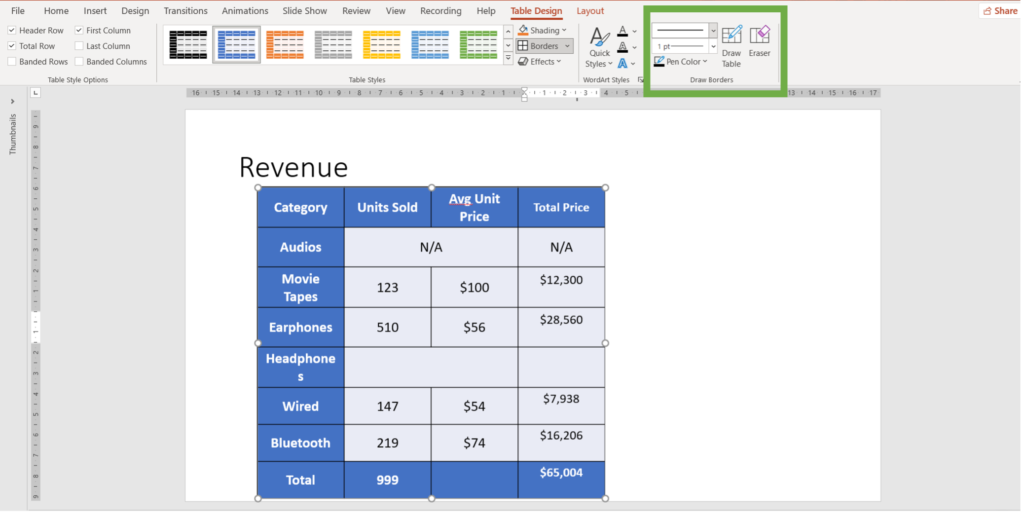
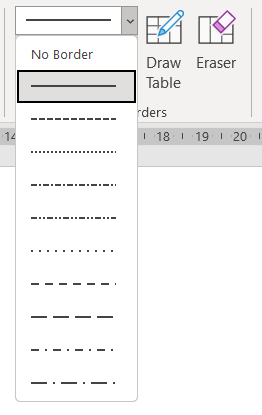
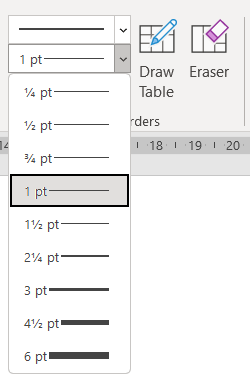
-> Line Style: Choose from various line styles such as solid, dashed, or dotted.
-> Line Weight: Select the thickness of the border lines.
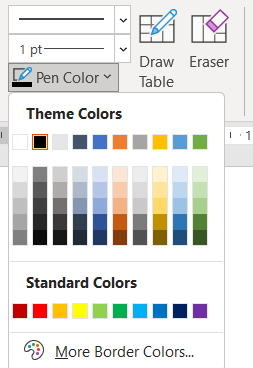
-> Pen Color: Choose a color for the borders.
When you’re ready, click the drop-down arrow next to the Borders command and choose.
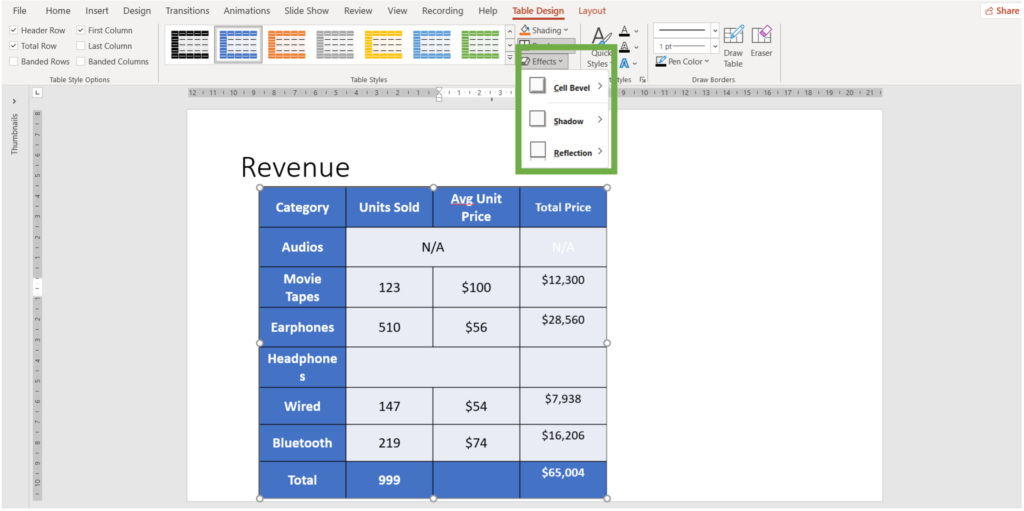
-> Effects: Add special effects like shadows and reflections to your table. Click on the Effects button in the Table Design tab to apply these effects.
***
Excel tables in PowerPoint
Method 1: Copy and Paste
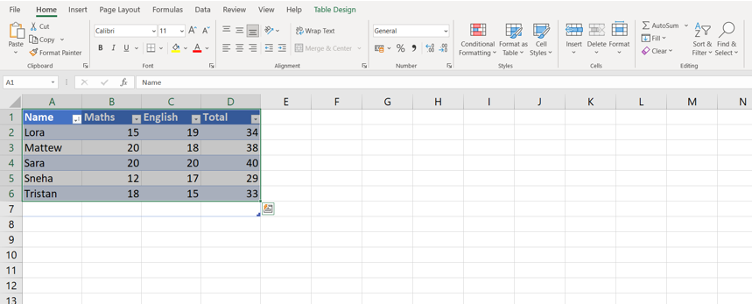
- In Excel, select the table or the range of cells you want to copy. Right-click on the selected range and choose Copy (or press Ctrl+C).
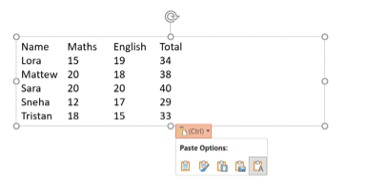
2. Switch to PowerPoint and right-click on the slide and choose Paste (or press Ctrl+V). Depending on how you want the table to appear, you can choose different paste options:
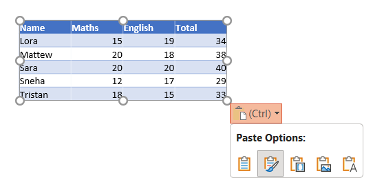
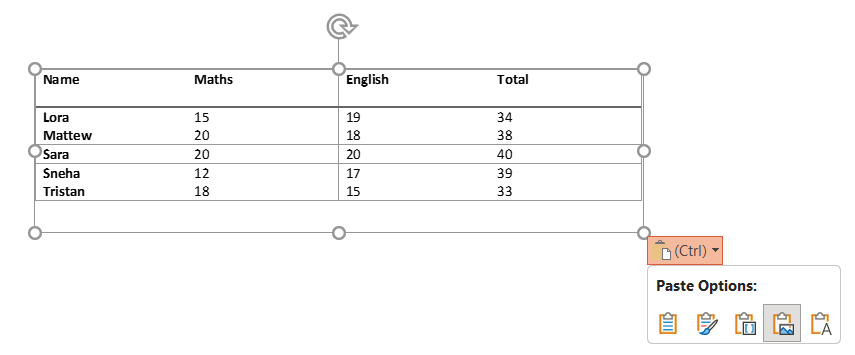
- Keep Source Formatting: Maintains the original Excel formatting.
2. Use Destination Styles: Adapt the table to match the PowerPoint theme.
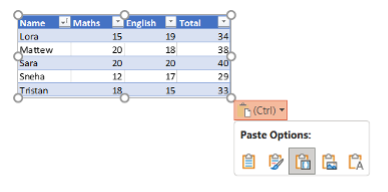
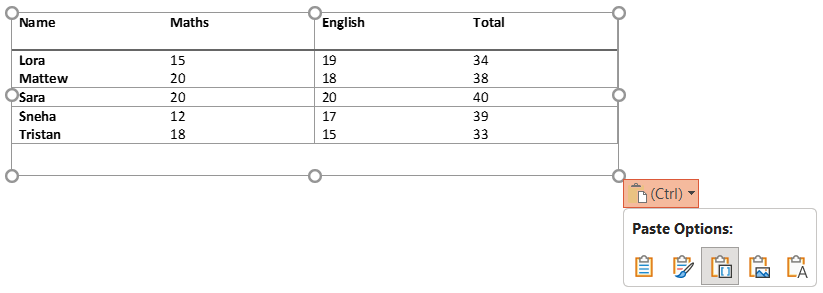
3. Embed: Embeds the Excel table in PowerPoint, allowing for future edits in Excel.
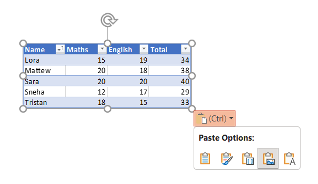
4. Picture: Pastes the table as a picture, which is not editable.
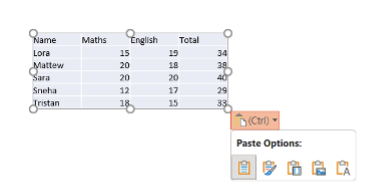
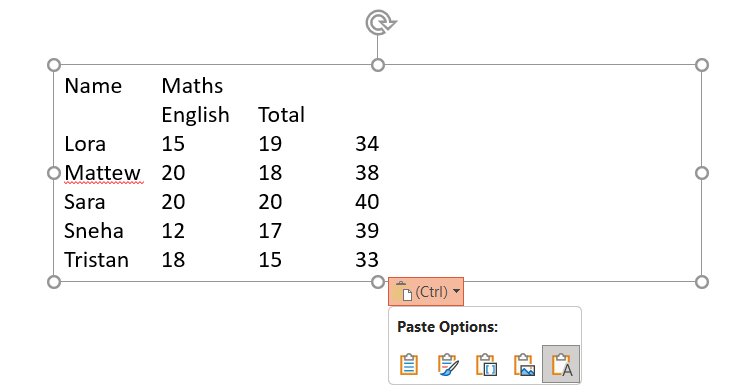
5. Keep text only: ensure that only the text from the Excel cells is transferred, and all original formatting (such as cell borders, colors, fonts, and cell sizes) is removed.
Method 2: Insert Object
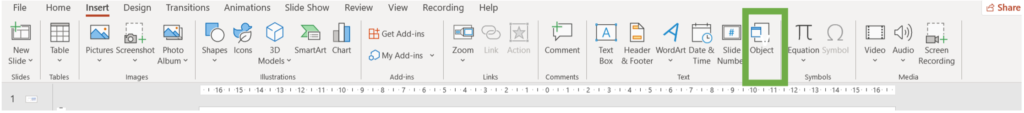
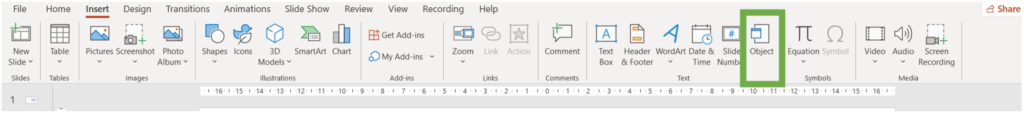
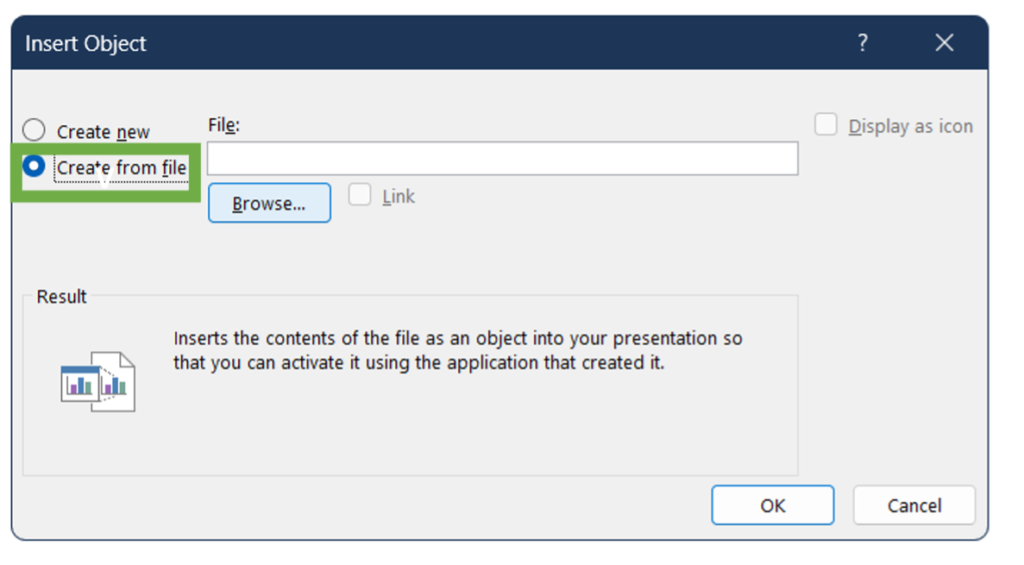
- Navigate to the insert tab, and click on Object in the Textgroup.
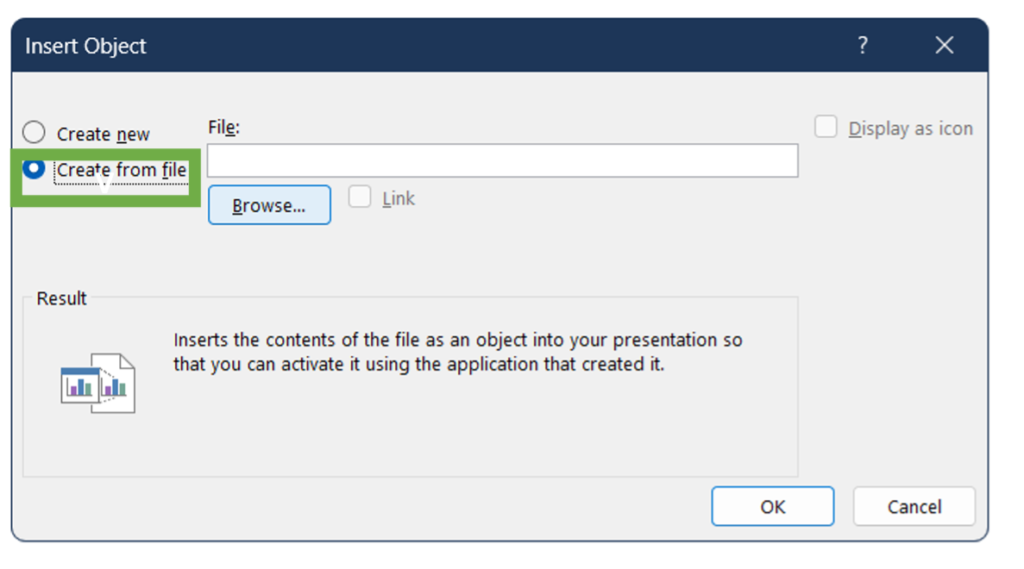
2. In the Insert Object dialog box, select Create from file.
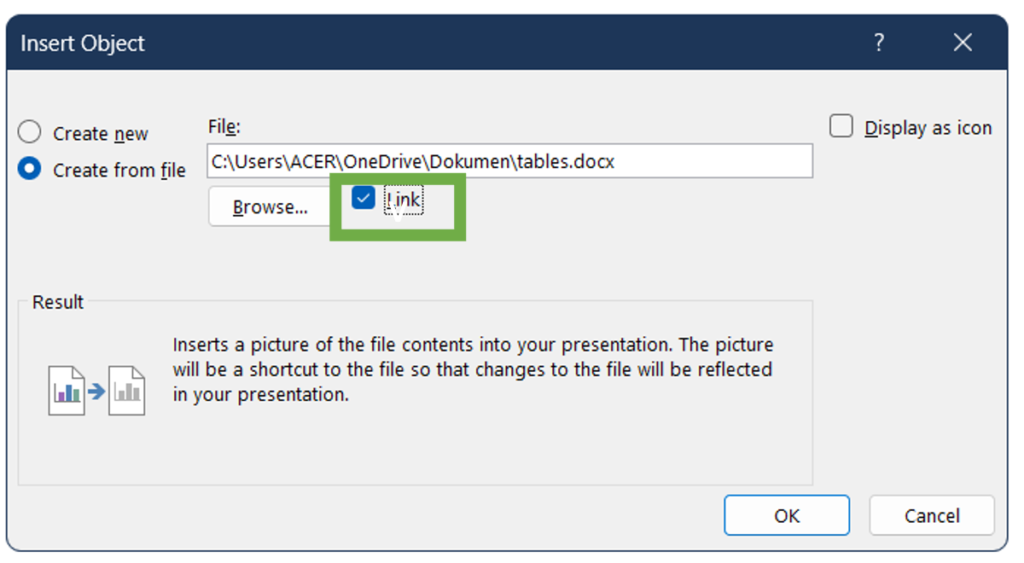
3. Click Browse and locate the Excel file containing the table, select the file and click Insert
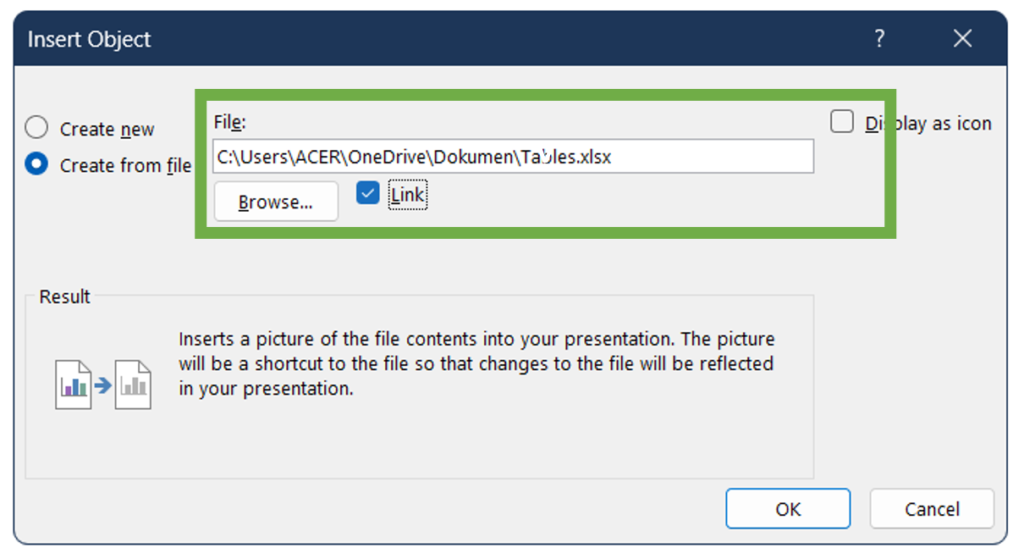
(Check Link if you want the table to be updated automatically when the Excel file is updated).
4. Watch the full video to do the same.
Pro tip: PowerPoint will insert the entire worksheet as an object. You should double-click the object to open it in Excel and adjust the view to show the specific table you want.
***
Word tables in PowerPoint
Method 1: Copy and Paste A Table
- In Word, select the table you want to copy, Right-click on the selected table and choose Copy (or press Ctrl+C).
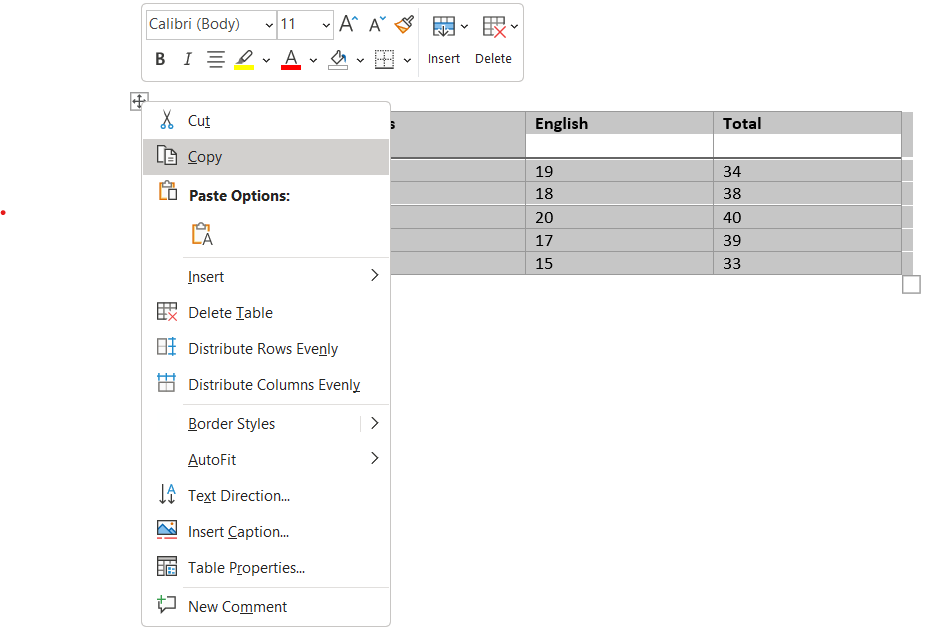
- Switch to PowerPoint and Right-click on the slide and choose Paste (or press Ctrl+V). Choose the paste option that suits your needs:
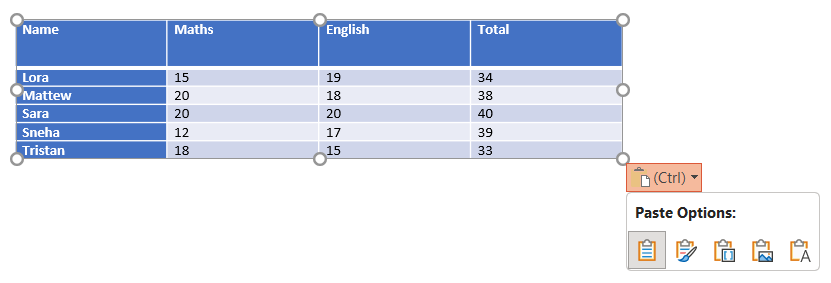
a) Keep Source Formatting: Maintains the original Word table formatting.
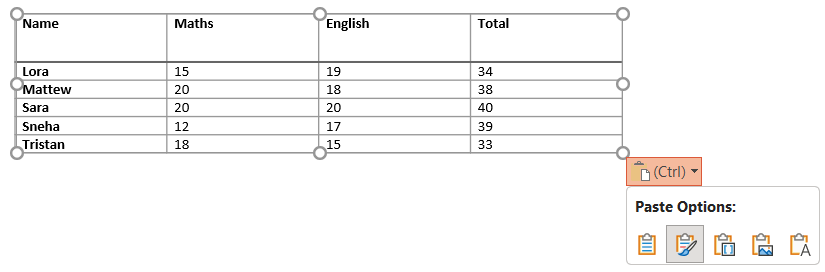
b) Use Destination Styles: Adapt the table to match the PowerPoint theme.
c) Picture: Pastes the table as an image, which is not editable.
d) Embed: Embeds the Word table in PowerPoint, allowing for future edits in Word.
e) Keep Text Only: Only paste the text, without table formatting. You can then manually format it into a table in PowerPoint.
Method 2: Insert a Table as an Object
- Navigate to the Insert tab. Click on Object in the Text group.
2. In the Insert Object dialog box, select Create from file.
3. Click Browse and locate the Word file containing the table, select the file and click Insert. (Check Link if you want the table to be updated automatically when the Word file is updated)
4. Watch the video below to reflect on the above steps.
Pro tip: PowerPoint will insert the entire document as an object. You should double-click the object to open it in Word and adjust the view to show the specific table you want.
Conclusion
By utilizing the tools and options available in the Table Design and Layout tabs, you can customize tables to fit your specific needs and ensure they align seamlessly with the rest of your presentation. From adjusting cell and table sizes to merging and splitting cells, applying styles, and adding effects, the possibilities for creating professional and visually appealing tables are vast. By leveraging these features in PowerPoint, you can create tables that are not only functional but also visually appealing, enhancing the overall effectiveness of your presentations.

