
INTRODUCTION
In today’s digital age, the Software as a Service (SaaS) model has redefined how businesses offer software solutions, moving from traditional one-time purchases to subscription-based ones. Unlike the old system where customers bought software once and waited for updates, SaaS allows continuous access to software through the cloud, with regular updates and seamless scalability. Major players like Adobe and Microsoft have transitioned from selling boxed software to thriving on subscription services like Adobe Creative Cloud and Microsoft 365, ensuring consistent revenue while enhancing customer experience. This shift requires a completely different financial approach, focusing on metrics like recurring revenue and customer retention to drive profitability. Given the unique nature, a SaaS financial model needs to built accordingly as described later in the article.
WHAT DO WE MEAN BY SAAS FINANCIAL MODEL?
A SaaS financial model means creating a financial model for a company which has SaaS as its key business. It helps companies like Salesforce, Zoom, and Microsoft (Office 365) map out their future growth and profitability. It’s more than just an Excel spreadsheet—it forecasts financial performance by looking at key metrics like Monthly Recurring Revenue (MRR), Customer Acquisition Cost (CAC), and churn rates. This model pulls together a company’s past performance and future assumptions to create essential financial statements interlinkages, such as the income statement, balance sheet, and cash flow statement. By focusing on recurring revenue and customer retention, the model helps businesses understand their financial health, growth potential, and value, making it a critical tool for smart decision-making.
WHAT ARE THE KEY CHARACTERISTICS OF THE SAAS INDUSTRY?
The Software as a Service (SaaS) industry has several key characteristics that set it apart from traditional software models:
- Subscription-Based Model: SaaS companies typically operate on a subscription model where customers pay recurring fees (monthly or annually) instead of a one-time purchase.
- Cloud-Based Delivery: SaaS products are delivered over the Internet, eliminating the need for local installations or hardware, and enabling users to access the service from any device with an Internet connection.
- Scalability: SaaS solutions can easily scale with business growth. Users can increase or decrease their usage, adjusting the subscription accordingly.
- Automatic Updates: SaaS providers handle software updates and maintenance, ensuring users have access to the latest features and security patches without manual installations.
- Lower Upfront Costs: Since there’s no need for expensive hardware or installations, SaaS solutions typically require lower upfront costs, making them accessible to a broader range of customers.
- Multi-Tenancy Architecture: SaaS platforms often run on a shared infrastructure where multiple customers (tenants) use the same instance of the software, although data is kept separate.
- Customer Retention Focus: SaaS companies focus heavily on customer retention through user satisfaction, customer support, and constant feature improvements, as switching costs are lower for users compared to traditional software.
- Metrics-Driven Growth: Key metrics like Customer Acquisition Cost (CAC), Customer Lifetime Value (CLTV), Monthly Recurring Revenue (MRR), and churn rates are crucial for assessing performance and guiding business strategy.
STEP-BY-STEP GUIDE TO BUILDING A SAAS FINANCIAL MODEL
Building a SaaS financial model involves organizing key financial metrics, forecasting revenue and expenses, and creating comprehensive financial statements that provide insights into future performance. Below is a step-by-step guide to building a robust SaaS financial model:
STEP 1: DEFINE KEY ASSUMPTIONS
Begin by defining the core assumptions that will drive your model. These assumptions are based on historical data and growth forecasts. Key assumptions include:
- Customer Growth Rate: Expected monthly or annual rate of new customer acquisition.
- Churn Rate: The percentage of customers who cancel their subscriptions over a period.
- Pricing: The subscription pricing for different plans and tiers (e.g., basic, premium).
- Upsell/Cross-sell Revenue: Extra income generated by encouraging current customers to upgrade their subscriptions or by offering related products that complement their existing purchases.
STEP 2: FORECAST REVENUE
In any SaaS financial model, the revenue forecast serves as the backbone, driving the company’s financial future. Unlike traditional businesses that rely on one-time sales, SaaS companies thrive on subscription-based revenue, creating a steady stream of income that builds over time. This predictability allows businesses to focus on growth strategies and retention while maintaining a reliable source of revenue. Let’s understand the components that help in calculating the total revenue forecast.
- Monthly Recurring Revenue (MRR): At the heart of the SaaS revenue forecast is Monthly Recurring Revenue (MRR)—the lifeblood of the business. MRR represents the consistent, predictable revenue generated each month from customer subscriptions. It captures both new sales (customers joining the platform) and renewals (existing customers continuing their subscriptions). This predictable cash flow allows SaaS companies to plan with confidence, as they can count on MRR to fund ongoing operations, expansion, and product development.
- Annual Recurring Revenue (ARR): While MRR provides a monthly snapshot, Annual Recurring Revenue (ARR) offers a broader, long-term view of revenue generation. ARR is essentially the yearly version of MRR, and it reflects the total value of recurring subscriptions over the course of a year. ARR is especially important for forecasting annual performance, assessing long-term contracts, and attracting investors who want to understand the stability of the company’s revenue streams over time.
- Revenue Growth Rate: The revenue growth rate is the pulse of the SaaS company. It measures how fast the company’s revenue is expanding month over month or year over year. This percentage-based metric gives insight into the company’s scalability and future income streams. A high growth rate often indicates that the company is acquiring new customers at a rapid pace or that existing customers are upgrading their plans. It is a critical indicator of overall business momentum and market demand.
- Upselling and Cross-Selling: Finally, a significant revenue opportunity lies in upselling and cross-selling. Upselling refers to encouraging existing customers to move to a higher-priced plan or purchase additional features, while cross-selling involves offering complementary products or services. These strategies are essential for boosting revenue without having to acquire new customers, which can be costlier. By nurturing current customer relationships and providing added value, SaaS companies can increase Average Revenue Per User (ARPU) and drive significant growth.
For instance, a SaaS company might offer advanced analytics tools as an upsell to its basic software package or sell cloud storage as a cross-sell, adding additional streams of revenue without needing to increase customer acquisition costs.
- Churn Revenue: Not all revenue stays on the books forever. Churn revenue refers to the portion of recurring revenue lost when customers cancel their subscriptions. Understanding churn is critical because even with strong sales growth, high churn rates can erode overall revenue. Monitoring and managing churn helps SaaS businesses identify areas for improvement, such as customer support or product features, and develop strategies to reduce cancellations.
CALCULATING MRR OR ARR
The MRR is calculated by taking the price and number of customers and adjusting it for new sales, churn, and upsells or cross-sells. Here’s the formula:
MRR = Monthly Price * Existing customers + Monthly price * New customers – Monthly price * Churn customers + Upsell price * Number of customers upselling
ARR is calculated by multiplying the MRR by 12 months.
STEP 3: CALCULATE COST OF REVENUE
Cost of Revenue: Direct costs for delivering the service, such as hosting, server costs, and customer support.
STEP 4: MODEL OPERATING EXPENSES
- Sales and Marketing: Costs associated with acquiring and retaining customers.
- Customer Acquisition Cost (CAC): Determine the amount you invest to acquire each new customer. This includes marketing, sales team salaries, and related expenses.
- Total customer acquisition expense: Multiply the CAC by the number of new customers to forecast total acquisition expense.
- CAC Recovery Time: Calculate how long it takes to recover CAC by dividing CAC by MRR from a new customer.
- General and Administrative (G&A): Overhead costs such as salaries, rent, and office expenses.
- Research and Development (R&D): Expenses related to improving and developing new software features.
Use historical data or industry benchmarks to estimate these expenses as a percentage of revenue or as fixed monthly costs.
STEP 5: BUILD FINANCIAL STATEMENTS
Next, build the three key financial statements: Income Statement, Balance Sheet, and Cash Flow Statement.
Start with the Income Statement, which captures the company’s performance over time by reflecting revenue, expenses, and net profit. Calculate your Total Revenue using Monthly or Annual Recurring Revenue (MRR/ARR). From there, subtract the Cost of Goods Sold (COGS) to reveal your gross profit. Next, deduct operating expenses such as marketing, R&D, and G&A to determine Operating Income. Lastly, factor in taxes, interest, and other expenses to determine your Net Profit, which represents your overall earnings.
The Balance Sheet provides a snapshot of your financial standing at a particular point. It highlights key components such as Assets—cash, accounts receivable, and long-term investments—and Liabilities like accounts payable, debt, and deferred revenue. Equity, representing shareholders’ ownership and retained earnings, completes the picture.
Finally, the Cash Flow Statement tracks liquidity by outlining the company’s cash inflows and outflows. Operating Cash Flow reflects revenue minus operating expenses while Investing Cash Flow includes capital spent on equipment or software. Financing Cash Flow covers equity funding, debt repayments, and dividend payouts, offering insight into how the company funds its operations.
STEP 6: CALCULATE KEY SAAS METRICS
After building your financial statements, it’s crucial to calculate key SaaS metrics that will help you analyze your business performance. These metrics provide insight into customer value, growth, profitability, and overall efficiency, guiding strategic decisions.
- Customer Lifetime Value (CLTV): CLTV estimates the total revenue a customer will generate during their subscription period. It helps measure the long-term value of customers, critical for understanding the return on acquisition costs. The formula is:
CLTV = (Average Revenue per User (ARPU) × Gross Margin) ÷ Churn Rate
By multiplying ARPU by the gross margin, you determine the profit earned from each customer. Dividing this by the Churn Rate—the percentage of customers lost—provides an estimate of the revenue a customer will bring in over their lifetime. A higher CLTV suggests strong customer value, allowing for greater investment in growth strategies.
- CAC to LTV Ratio: This ratio compares Customer Acquisition Cost (CAC) to Customer Lifetime Value (LTV). A common benchmark is 3:1, meaning the revenue generated from a customer should be three times higher than the cost of acquiring them. A lower ratio suggests inefficient acquisition efforts, while a higher ratio means you’re acquiring customers at a very low cost, which may signal that you’re underspending on growth. This ratio is essential for refining your customer acquisition strategies.
- Churn Rate: The churn rate measures the percentage of customers who cancel their subscriptions in a given period. High churn signals poor retention, which can hurt long-term revenue growth. The formula is:
Churn Rate = (Number of customers lost during a specific period ÷ Total customers at the beginning of that period) × 100.
Reducing churn is critical to improving your CLTV and sustaining revenue growth. Strategies like improving customer satisfaction and enhancing product offerings are often employed to reduce churn.
- Net Revenue Retention (NRR): NRR measures the revenue retained from existing customers, including the impact of upsells, downgrades, and churn. An NRR above 100% means that your company is not only retaining customers but also generating additional revenue from them. The formula is:
NRR = (Revenue from existing customers at the end of a period ÷ Revenue from those same customers at the beginning of the period) × 100.
High NRR indicates strong customer loyalty and effective upsell strategies, critical for driving sustainable growth.
- Burn Rate: Burn Rate measures the speed at which a company is using up its cash reserves. For SaaS companies, especially startups, monitoring the burn rate is essential for ensuring the company doesn’t run out of cash before becoming profitable. It is calculated as:
Burn Rate = (Initial Cash Balance – Final Cash Balance) ÷ Number of Months.
A high burn rate means the company is consuming cash quickly, while a lower burn rate indicates better cash management. Managing burn rate is crucial for extending your financial runway and avoiding the need for additional funding.
- Rule of 40: The Rule of 40 is a popular benchmark in the SaaS industry that evaluates the balance between growth and profitability. It suggests that the sum of a SaaS company’s revenue growth rate and profit margin should be at least 40%. The formula is:
Rule of 40 = Revenue Growth Rate + Profit Margin
A company with high revenue growth but negative profitability, or one with low growth but strong profits, can still meet the Rule of 40. This metric helps investors and stakeholders assess the trade-off between growth and profitability, providing a holistic view of a company’s overall health.
These SaaS metrics collectively provide a thorough understanding of your business’s financial health and operational efficiency. They help guide decisions on customer acquisition, retention, cash flow management, and balancing growth with profitability for long-term success.
STEP 7: PERFORM SENSITIVITY AND SCENARIO ANALYSIS
It’s important to test different scenarios to understand how changes in key assumptions (such as customer growth, churn rates, or pricing) impact the financial outlook.
- Scenario Analysis: Create best-case, base-case, and worst-case scenarios for revenue, customer growth, and costs.
- Sensitivity Analysis: Test how sensitive the financial outcomes are to changes in a single assumption, such as a 10% increase in churn rate or a 5% drop in new customer acquisition.
STEP 8: BUILD A VALUATION MODEL
Lastly, estimate the valuation of the SaaS company using industry-standard methods:
- Discounted Cash Flow (DCF): This method calculates the present value of future cash flows based on a discount rate.
- Revenue Multiples: SaaS companies are often valued based on a multiple of their ARR or MRR. For example, a fast-growing SaaS company might be valued at 10× ARR.
STEP 9: REVIEW AND ITERATE
Once your model is complete, review it for accuracy and consistency. Make sure all assumptions are clearly documented and update the model regularly as new data becomes available. Continuously iterate based on real-world performance to improve accuracy and decision-making.
HYPOTHETICAL EXAMPLE TO UNDERSTAND SAAS FINANCIAL MODEL KEY METRIC CALCULATIONS
Let’s consider a hypothetical SaaS company called CloudSolutions, which provides cloud storage and collaboration tools for businesses. We’ll calculate several key SaaS metrics to illustrate how they can be applied.
Hypothetical Data for CloudSolutions for the month of Jan:
- Total Customers at the beginning: 1,000
- Price per customer per month: $100
- Gross Margin: 80%
- Churn Rate: 5% (meaning 5% of customers cancel their subscriptions each month)
- Upsell Customers: Imagine 10% of the Customers at the beginning of each month upgrade to advanced features of the application. Upsell Price is $40 per upsell customers.
- Customer Acquisition Cost (CAC): $300 (the cost to acquire a single customer)
- Monthly Other Operating Expenses: 20% of MRR
- Customer Growth Rate: 6% month on month
On the basis of the above assumptions and data we can prepare the financial model as follows.
1. Key Assumptions on customer growth rate, churn rate, price per customer, CAC, etc are first highlighted in the model as shown below:
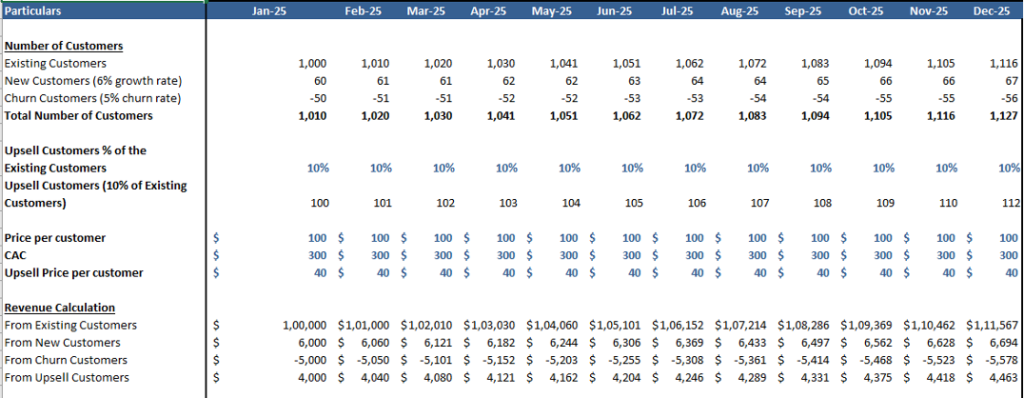
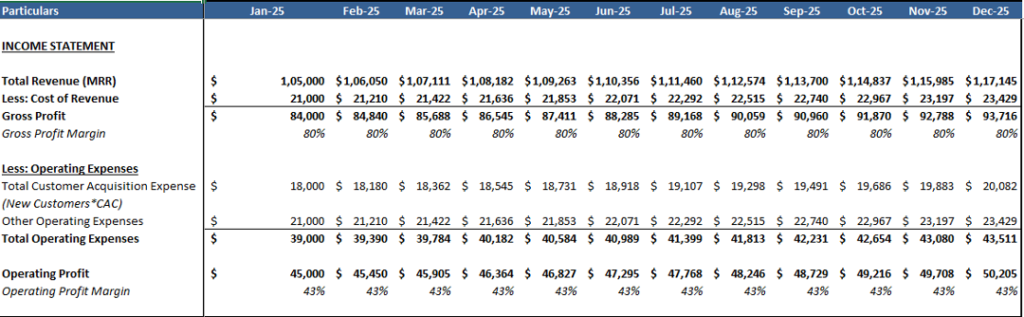
2. Key financial statement line items are then calculated based on the above assumptions. So in the screenshot below, you see the Revenues and Operating expenses calculation that provides month on month operating profit for the business
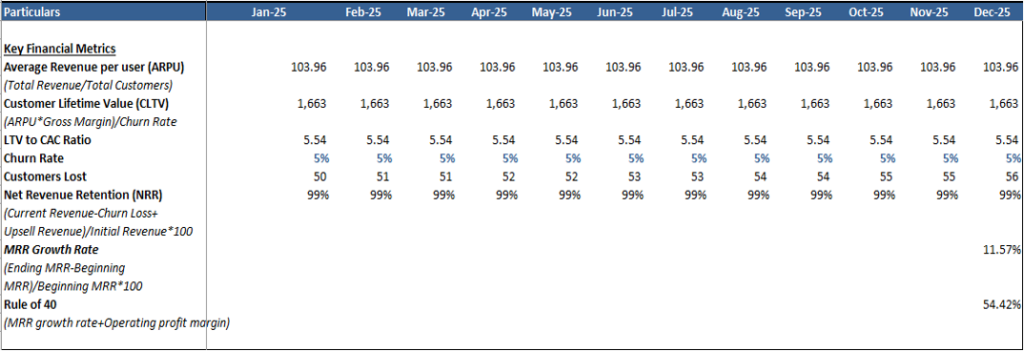
3. Finally, we can calculate some metrics like ARPU, CLTV, LTV to CAC, NRR and Rule of 40 to see how the financial performance of this business looks like:
**
CALCULATING KEY FINANCIAL METRICS FOR THE FIRST MONTH:
1. MRR= Average Monthly Price * Existing customers + Monthly price * New customers – Monthly price * Churn customers + Upsell price * Number of customers upselling
= 100*1000 + 100*60 – 100*50 +(10%*1000)*40
= 100000 + 6000 – 5000 + 4000
= 1,05,000
i.e. MRR = USD 1,05,000 based on first month calculation
2. Customer Lifetime Value (CLTV):
CLTV = (ARPU × Gross Margin) / Churn Rate
= (103.96×0.80) / 0.05
= 83.17/0.05
= 1,663
i.e, CLTV: $1,663 per customer.
3. LTV to CAC Ratio
= CLTV/CAC
= 1,663/300 = 5.54
An LTV to CAC ratio of 5.54 means that for every dollar spent to acquire a customer, the company generates $5.54 in revenue from that customer over their lifetime. This is higher than the ideal benchmark, which is typically around 3 or more, indicating that the company has a highly efficient customer acquisition strategy and strong profitability.
4. Churn Rate: This metric is already provided as 5%. If CloudSolutions starts with 1,000 customers, it would lose:
Customers Lost = 1,000×0.05 = 50 customers per month
5. Net Revenue Retention (NRR): Assuming CloudSolutions has upsell revenue equal to 10% of the existing customers, their NRR can be calculated as:
NRR = (Current Revenue − Churn Loss + Upsell Revenue) / Initial Revenue X 100
In this case, the initial revenue lost from churn and upsell revenue is:
Churn Loss = 50×100 = 5,000
Upsell Revenue = 10%*1000*40 = 100*40 = 4,000
Thus,
NRR = (100,000−5,000+ 4000)/100,000 X 100
= (99,000/100,000) X100
= 99%
NRR: An NRR of 99% is generally viewed as a warning sign that your business is losing some recurring revenue from its existing customer base. It may be time to investigate the reasons for churn and focus on improving customer satisfaction and retention strategies.
Rule of 40: Sum of the revenue growth rate and operating profit margin:
Rule of 40 = Annualized MRR Growth Rate + Operating profit margin
= 11.57% + 43%
= 54.42%
Rule of 40: 54.42%, which meets the benchmark for a healthy SaaS company.
These metrics demonstrate that CloudSolutions is effectively acquiring customers and generating long-term value while maintaining a sustainable growth trajectory, making it a strong contender in the competitive SaaS landscape.
ESSENTIAL TOOLS FOR BUILDING A WINNING SAAS FINANCIAL MODEL
Creating a robust SaaS financial model hinges on leveraging the right tools and software to enhance accuracy and streamline analysis. Microsoft Excel and Google Sheets remain staples for flexible calculations, while dedicated platforms like LivePlan and ProfitWell offer tailored solutions for subscription businesses. QuickBooks and Xero handle financial management, ensuring seamless tracking of expenses and revenues. For data visualization, Tableau and Power BI transform complex metrics into insightful dashboards. Collaboration tools like Trello and Asana help manage projects efficiently, while CRM systems such as Salesforce and HubSpot provide critical insights into customer acquisition costs. Together, these tools empower SaaS companies to build accurate financial forecasts and drive sustainable growth.
CHALLENGES AND BEST PRACTICES IN SAAS FINANCIAL MODEL
Building an effective SaaS financial model comes with challenges, including complex revenue recognition, high customer churn, and fluctuating customer acquisition costs (CAC). Inconsistent data and rapidly changing market conditions can also complicate forecasts.
To overcome these challenges, consider the following best practices:
- Accurate Revenue Recognition: Use frameworks like ASC 606 to clarify revenue reporting.
- Monitor Churn: Track churn metrics and analyze causes to improve customer retention.
- Refine CAC Models: Continuously update CAC calculations based on sales and marketing data.
- Reliable Data Sources: Invest in data management systems for accurate insights.
- Agile Updates: Regularly revise financial models to reflect market changes.
- Scenario Planning: Incorporate scenario analysis to prepare for various future outcomes.
By following these practices, SaaS companies can enhance their financial models, supporting strategic growth and informed decision-making.
CONCLUSION
In conclusion, understanding a SaaS financial model is essential for effectively managing and scaling a subscription-based business. Key components such as customer acquisition costs, lifetime value, churn rates, and revenue projections provide valuable insights into financial health and operational efficiency. By utilizing a structured approach, including assumptions, growth projections, expense tracking, and key metrics analysis, SaaS companies can make informed decisions that drive sustainable growth. This overview not only highlights the importance of financial modeling in the SaaS industry but also serves as a foundation for ongoing financial planning and performance optimization.

