
INTRODUCTION
Nvidia, the global leader in accelerated computing and artificial intelligence (AI), continues to redefine the technology landscape with its ground breaking innovations. From its market-leading GPUs powering gaming and data centres to its cutting-edge AI and autonomous vehicle technologies, Nvidia remains at the forefront of computing advancements. The surging demand for AI-driven solutions, fuelled by the rapid adoption of generative AI and cloud computing, has further heightened investor interest and excitement. Alongside its expansion into high-performance computing, automotive AI, and the Omniverse platform, Nvidia’s diverse product portfolio solidifies its position as a dominant force in the semiconductor industry.
With Nvidia’s rapid growth and evolving business model, understanding its intrinsic value becomes crucial for investors aiming to make informed decisions. The Discounted Cash Flow (DCF) method provides a structured approach to estimating Nvidia’s worth by projecting future cash flows and discounting them to their present value. Let’s explore the steps involved in Nvidia DCF method, including the impact of AI-driven demand, using the DCF approach. This article is not for investment advice. This article is intended to illustrate a systematic approach to conducting a DCF valuation and making reasonable assumptions about growth and profitability.
STEPS FOR NVIDIA DCF VALUATION
STEP 1: GATHERING HISTORICAL FINANCIAL STATEMENTS
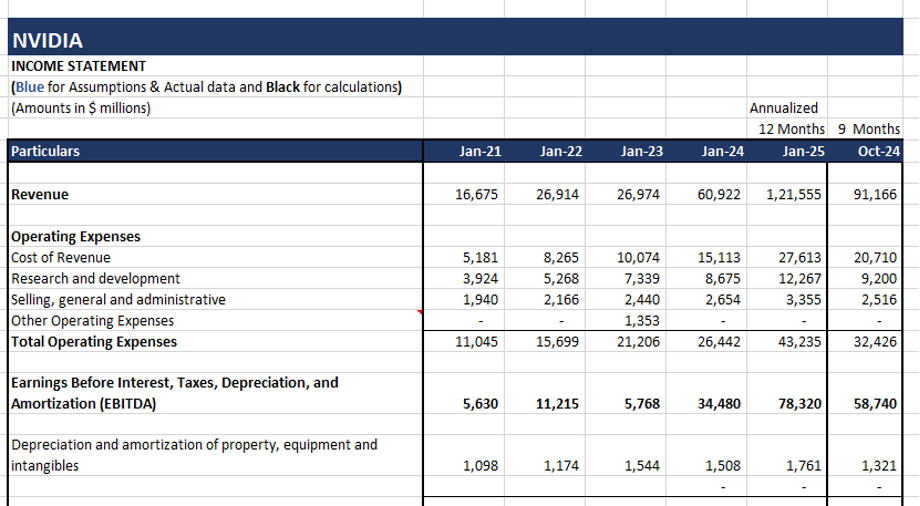
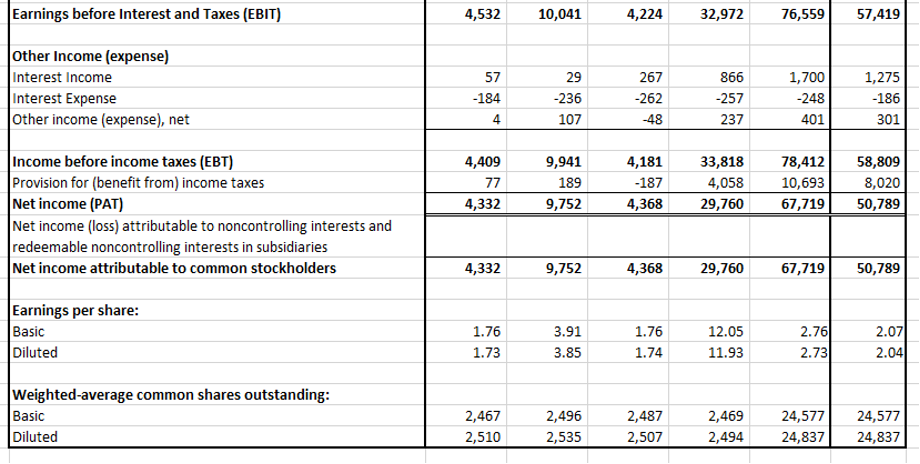
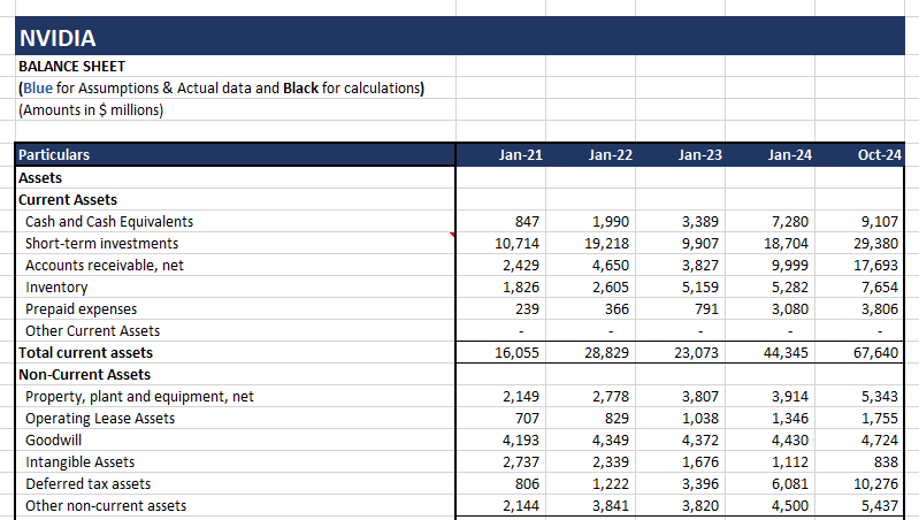
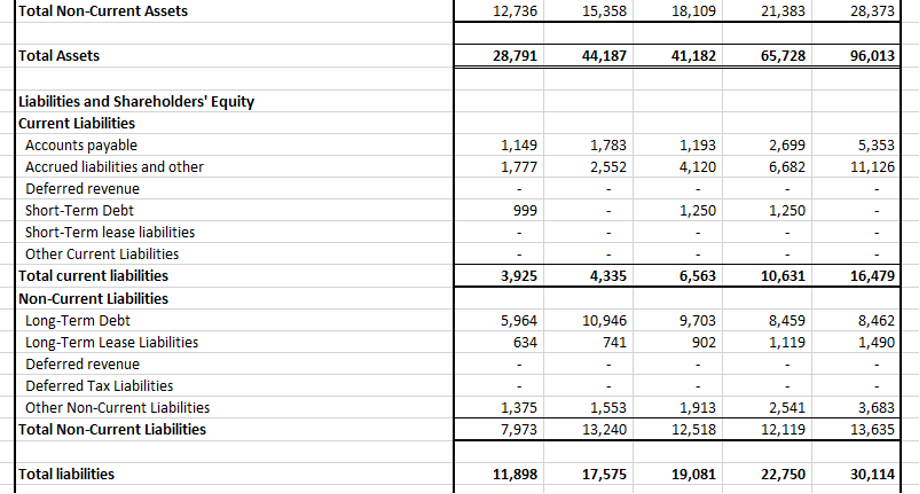
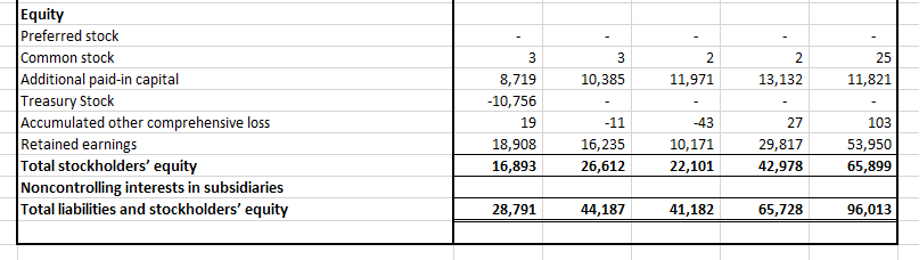
The initial step in Nvidia’s DCF valuation process is to compile its historical financial statements, such as the income statement and balance sheet. These records provide valuable insights into Nvidia’s revenue trends, cost structure, and overall profitability, forming the basis for forecasting future performance. For this assessment, we have gathered Nvidia’s financial data from the past five years from Jan 2021 to Jan 2025 using its annual reports, which are publicly accessible in the Financials section of its Investor Relations page (https://investor.nvidia.com/financial-info/financial-reports/). The Jan 2025 figures in the Income statement are annualized since actual data was available only till the Oct 2024 quarter.
Below is Nvidia’s historical Income Statement and Balance Sheet.
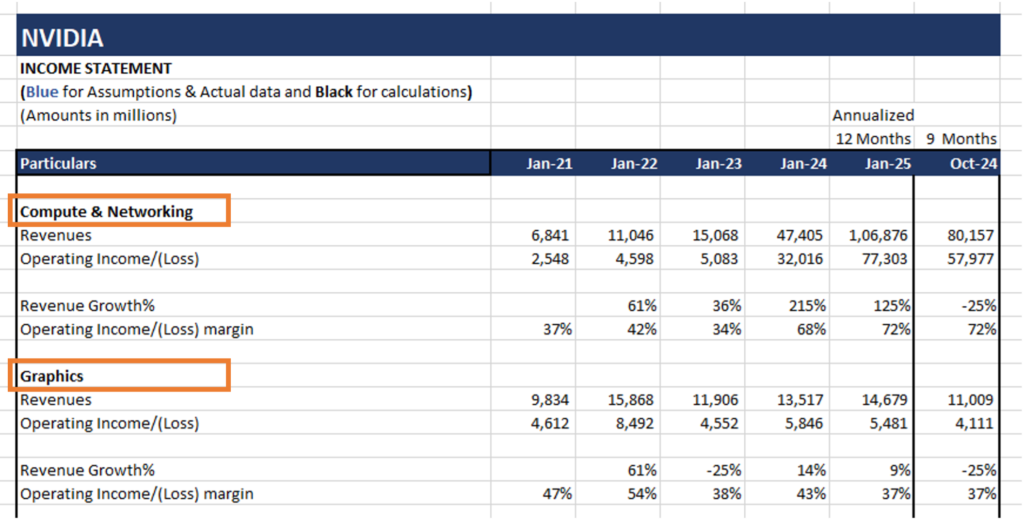
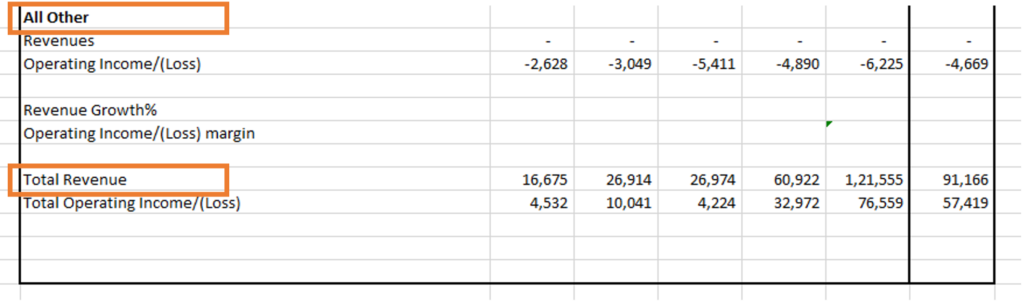
We can also gather segment-level information for the business being valued to better understand which business is driving maximum profit and to help forecast the financials better.
**
STEP 2: CALCULATING THE DISCOUNT RATE (WACC)
To discount future cash flows, we need an appropriate discount rate, often represented by the Weighted Average Cost of Capital (WACC). WACC is calculated using the following formula:
WACC = (We * Ke) + (Wd *Kd * (1-Tc))
Where:
E = Market value of equity
D = Net Book value of Debt i.e., Book value of debt and debt equivalents less cash & cash equivalents
V = Total market value of equity and Net Book value of debt (E + D)
Ke = Cost of equity
Kd = Cost of debt
Tc = Corporate tax rate
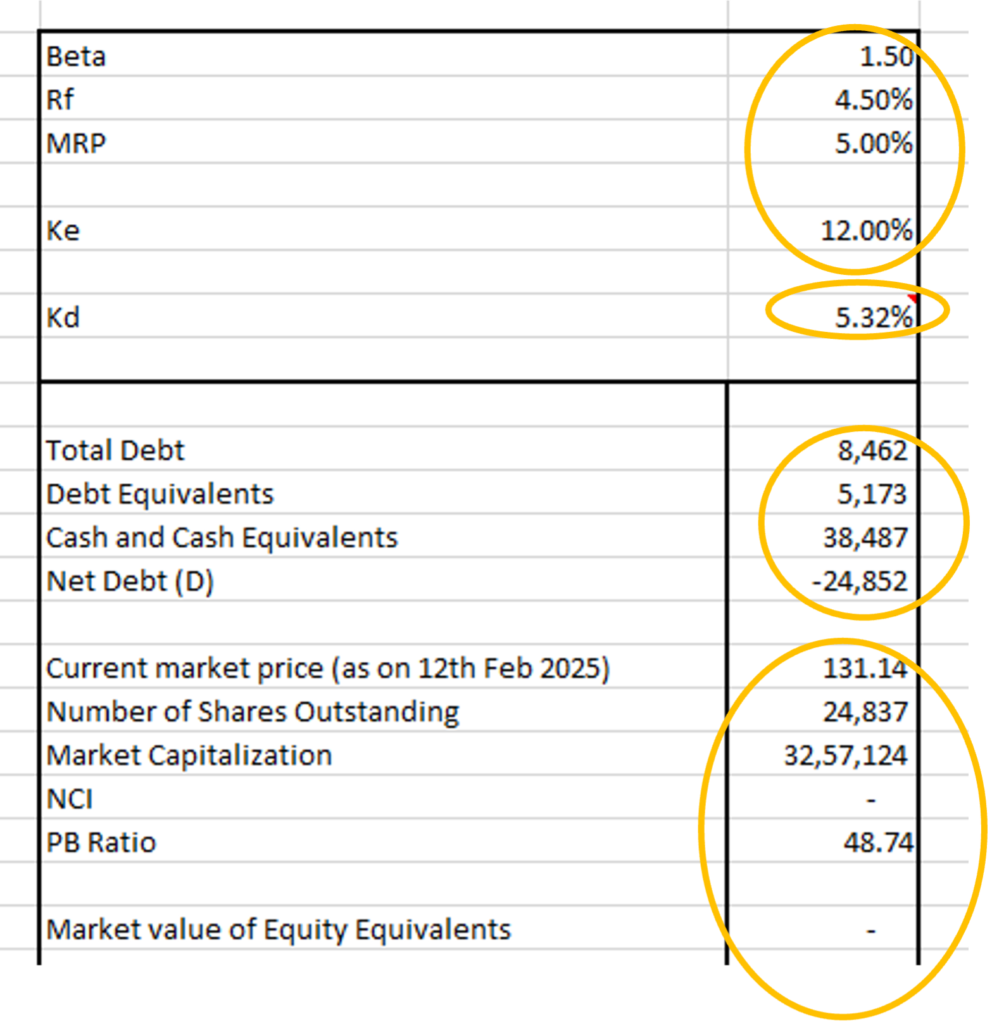
In the case of Nvidia, the inputs for WACC are as follows:
a) E = Market Value of Equity
= Current Market price * Number of common shares outstanding + Book value of Non- controlling Interest * P/B ratio
= $131.14 * 24,837 mn + $0 mn * 48.74
= $32,57,124 mn + $0 mn
= $32,57,124 mn
b) D = Book Value of Debt + Book Value of Debt Equivalents – Cash and Cash Equivalents
= $8,462 + $5,173 mn – $38,487 mn
= -$24,852 mn
c) V = E+ D
= $32,57,124 mn + (-$24,852 mn)
= $32,32,272 mn
d) We = Min (E/V,100%) = Min ($32,57,124/$32,32,272, 100%)
= Min (101%, 100%)
= 100%
e) Wd = 1- We
= 1-100%
= 0%
f) Ke = Risk free rate of return+ Beta * Market risk premium
= Rf + β* (MRP)
We have assumed the Beta of Nvidia to be 1.50 (as per the Beta list given by Aswath Damodaran https://pages.stern.nyu.edu/~adamodar/New_Home_Page/datafile/Betas.html ). Rf is taken as the 10-year US Government bond rate which is 4.5%. MRP is assumed to be 5%.
Hence, the
Ke = 4.5% + 1.50 * 5%
= 12%
g) Kd= Cost of Debt
= 5.32%
We have assumed the cost of Debt to be 5.32% (Nvidia 2050 bond YTM rate).
h) Tc = Corporate tax rate
= 21%
We have assumed the corporate tax rate as the U.S. federal statutory rate of 21%.
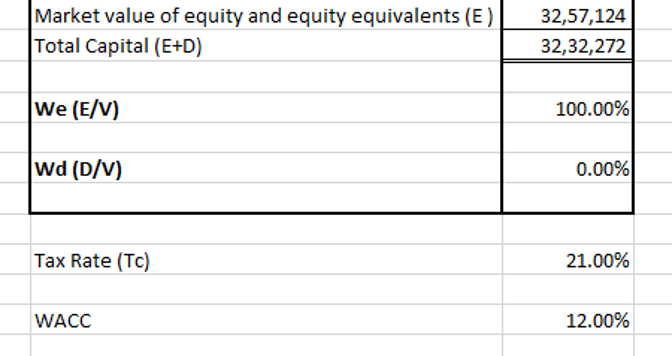
Hence, the WACC is calculated as below.
WACC= 100% * 12% + 0% * 5.32% *(1- 21%)
= 12% +0%
= 12%
Below is the working for WACC in Excel.
**
STEP 3: PROJECTING FUTURE CASH FLOWS
With historical financials in place and WACC determined, the next step is forecasting future cash flows. Given the historical data for 5 years from Jan 2021 to Jan 2025, we are forecasting future cash flows from Jan 2026 to Jan 2040.
a) Forecasting Revenue:
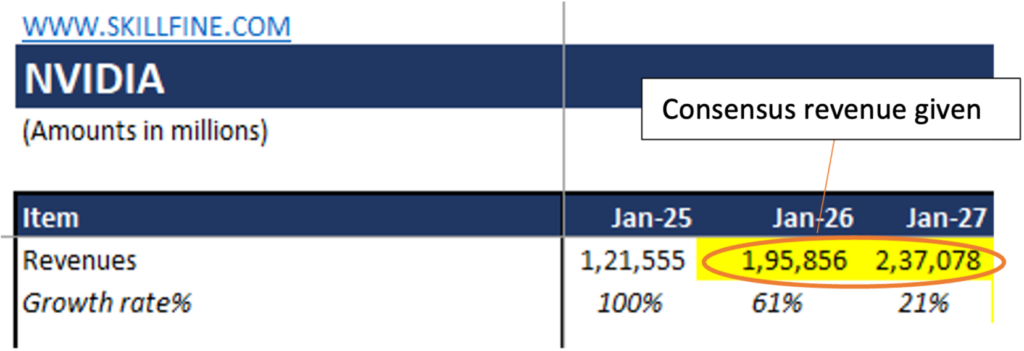
To begin forecasting Nvidia’s revenue, we analyze its impressive growth trajectory from 2021 to 2025, where revenue surged from $16.7 billion to $121.6 billion. The company experienced remarkable expansion, with a 61% increase in 2022, followed by stable revenue in 2023. However, 2024 and 2025 saw exponential growth of 126% and 100%, respectively, driven by soaring demand for AI-driven computing, data center expansion, and advancements in GPU technology.
i) First 2 years from Jan 2026 to Jan 2027: To begin with, our projection we have taken the consensus revenue estimates for Jan 2026 and Jan 2027, which amount to $195.9 billion and $237.1 billion, respectively. Based on these figures, Nvidia’s expected year-over-year growth rates stand at 61% in 2026 and 21% in 2027.
Although the revenue growth rate is expected to decelerate, Nvidia’s strong position in AI, cloud computing, and high-performance GPUs continues to fuel optimism. The ongoing expansion of its data center business, increasing adoption of AI-powered solutions, and strategic investments in emerging technologies like the Omniverse and autonomous vehicles are likely to sustain growth momentum. Despite potential headwinds such as competition and economic fluctuations, Nvidia remains well-positioned for continued dominance in the semiconductor industry.
(Source for Consensus revenue: https://in.marketscreener.com/quote/stock/NVIDIA-CORPORATION-57355629/calendar/ )
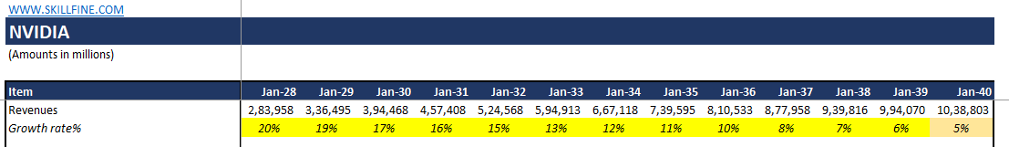
ii) Next 13 years from Jan 2028 to Jan 2040: For the next 13 years of the forecast, we have assumed that the growth rate will linearly decline from 21% in Jan 2027 to the US GDP growth rate of 4.5% in the 13th year (Jan 2040). GDP growth rate is taken as the long-term US nominal GDP growth rate of 4.5% (real GDP growth rate of 2%-2.5% and inflation target of 2%).
(Source: https://www.bea.gov/data/gdp/gross-domestic-product & Federal Reserve Monetary Policy Goals)
**
b) Forecasting Operating Profit(EBIT):
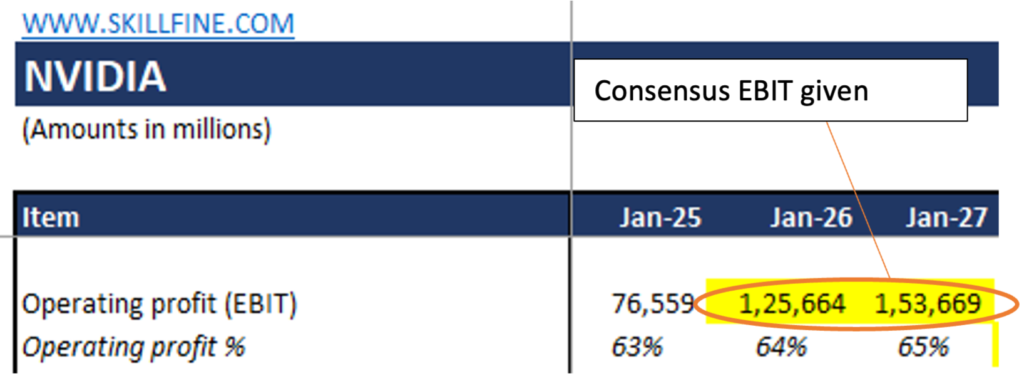
i) First 2 years from Jan 2026 to Jan 2027: We have taken the consensus Operating profit (EBIT) for the years Jan 2026 and Jan 2027 in our DCF forecast model. Given the EBIT numbers, we have calculated the EBIT margin as 64% and 65% for the years Jan 2026 and Jan 2027 respectively.
(Source for Operating Profit: https://in.marketscreener.com/quote/stock/NVIDIA-CORPORATION-57355629/calendar/ )
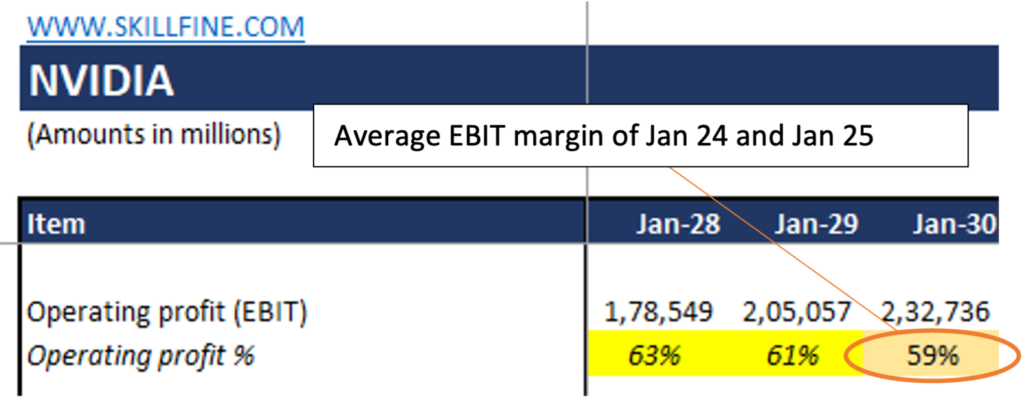
ii) Next 3 years from Jan 2028 to Jan 2030: We have assumed that in the next 3 years (from Jan 2028 to Jan 2030) the EBIT margin will be equal to the average EBIT margin of the last two historical years (Jan 2024 and Jan 2025). Hence we have fixed the EBIT margin in Jan 2030 as 59% (average EBIT margin of Jan 2024 and Jan 2025) and then linearly declined the EBIT margin from 65% in Jan 2027 to 59% in Jan 2030. Hence, given the EBIT margin we can calculate the EBIT amount (EBIT margin * Revenue).
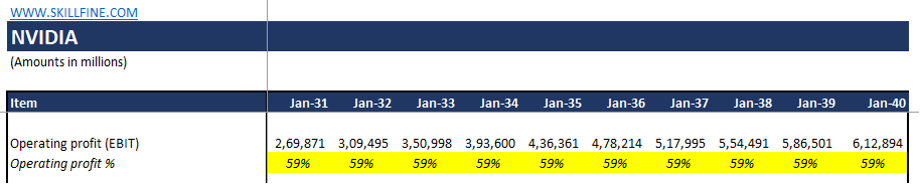
iii) Next 10 years from Jan 2031 to Jan 2040: We have assumed that the EBIT margin will remain constant at 59% for the next 10 years from Jan 2031 to Jan 2040. Hence, given the EBIT margin, we can calculate the EBIT amount (EBIT margin * Revenue).
**
c) Forecasting Depreciation and EBITDA:
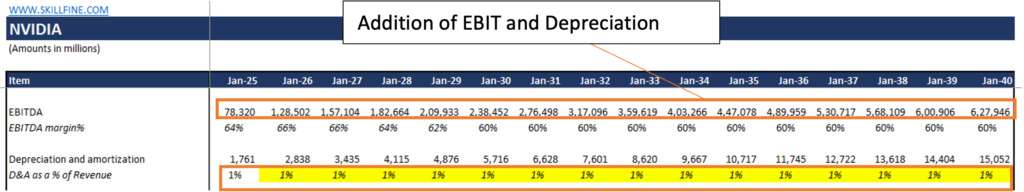
Depreciation as a percentage of the Revenue is assumed to be constant at 1% from the year Jan 2026 to the year Jan 2040. Hence, Depreciation can be easily calculated as a percentage of Revenue multiplied by the Revenue.
Once Depreciation is calculated, we can get EBITDA as an addition of EBIT and Depreciation.
**
d) Forecasting Operating Taxes:
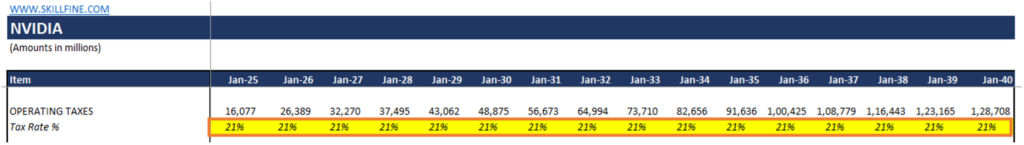
We have taken the operating taxes rate to be the U.S. federal statutory rate of 21% as constant for the entire forecast period from January 2026 to January 2040. Operating taxes are calculated by multiplying operating profit with the operating tax rate.
**
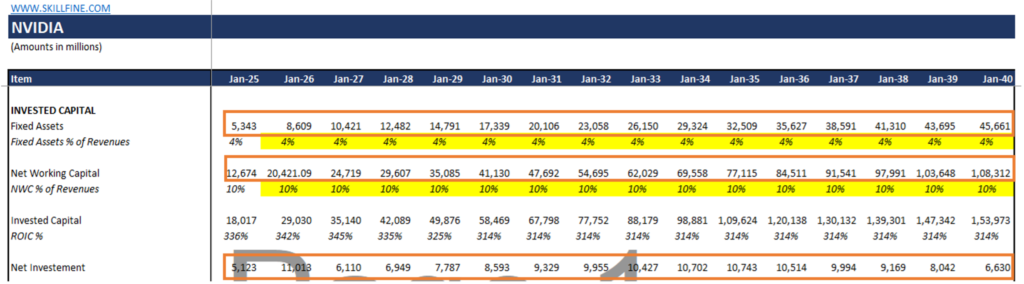
e) Forecasting Net Investment:
Net Investment is the amount of cash flow which is invested back in the business. We calculate Net Investment as the difference between the Invested capital of the two time periods. For example, for the year Jan 2026, the
Net Investment = Invested Capital (Jan 2026) – Invested Capital (Jan 2025)
= $29,030 – $18,017
= $11,013
Invested Capital is the sum of Investment in Fixed Assets of the company and Net Working Capital tied to the operations of the company.
Fixed Assets in the case of Nvidia are considered as the Property, plant, and equipment for the historical years. The fixed assets as a percentage of revenue comes as 4% for the year Jan 2025 and we are assuming that this percentage will be constant for the 15 years of the forecasted period from Jan 2026 to Jan 2040. Given the Fixed assets as a percentage of revenue and Revenue amount, we can easily calculate the amount of Fixed assets for the forecasted period.
Net Working Capital in case of Nvidia is considered as the summation of Inventories, Accounts Receivables, and Prepaid expenses, and Other current assets less Accounts payable and Accrued Liabilities. The Net Working Capital as a percentage of revenue comes as 10% for the year Jan 2025 and we are assuming that Nvidia has maintained this percentage for the 15 years of forecasted period. Given the Net Working Capital as a percentage of revenue and Revenue amount, we can easily calculate the amount of Net Working Capital for the forecasted period.
**
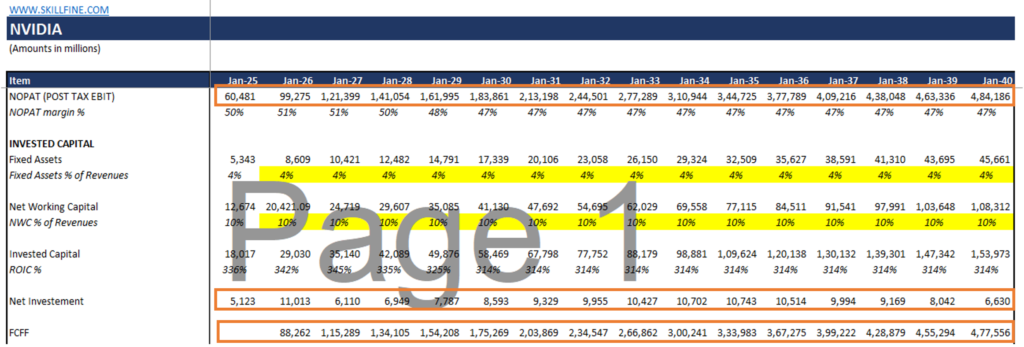
f) Forecasting Free Cash for Firm:
Free cash for the Firm(FCFF) for the 15-year forecasted period is calculated as below:
FCFF= EBIT (1-Tax) – Net Investment
= NOPAT – Net Investment
For example, FCFF calculation for the year Jan 2026 is
FCFF = NOPAT (Jan 2026) – Net Investment (Jan 2026)
= $99,275 – $11,013
= $88,262
**
STEP 4: CALCULATING THE TERMINAL VALUE
Beyond the explicit forecast period of 15 years, a terminal value is computed to capture the company’s value beyond the projection horizon. In this model, a terminal value is calculated as below.
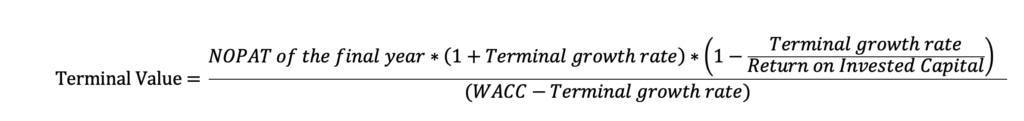
=$4,84,186 * (1+4.5%) * (1-4.5%/47%)
(12% – 4.5%)
= $66,49,787 mn
**
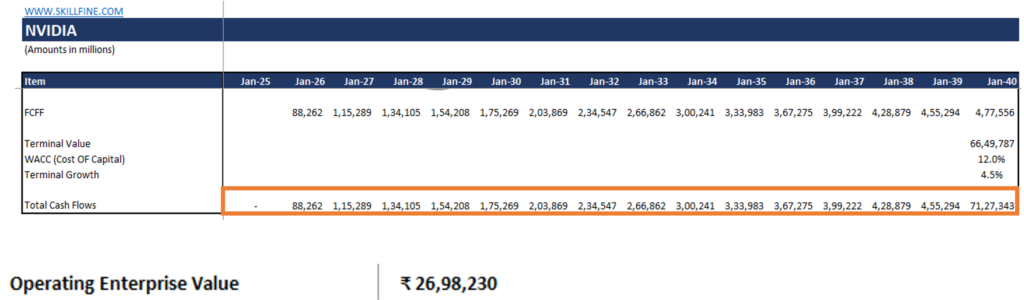
STEP 5: DISCOUNTING CASH FLOWS TO PRESENT VALUE
Using the WACC as the discount rate, the projected free cash flows and terminal value are discounted to their present value. The present value of free cash flows and terminal value comes to $26,98,230 mn. We call the present value of FCFF and the Terminal value as the Operating Enterprise Value, and it is calculated using the NPV function in Excel.
**
STEP 6: DERIVING THE INTRINSIC VALUE PER SHARE
Once the Operating enterprise value is calculated, we will add Non-Operating Assets not considered in the exercise of calculating free cash flow to arrive at the Gross Enterprise Value. From this Gross Enterprise Value, we will deduct net debt and debt equivalents and add cash and cash equivalents to provide the Equity Value.
The Equity Value works out to ₹27,41,388 mn, which is divided by the number of shares outstanding to give intrinsic value per share. The number of shares outstanding for Nvidia is 24,837 million and the intrinsic value per share is $110.38.
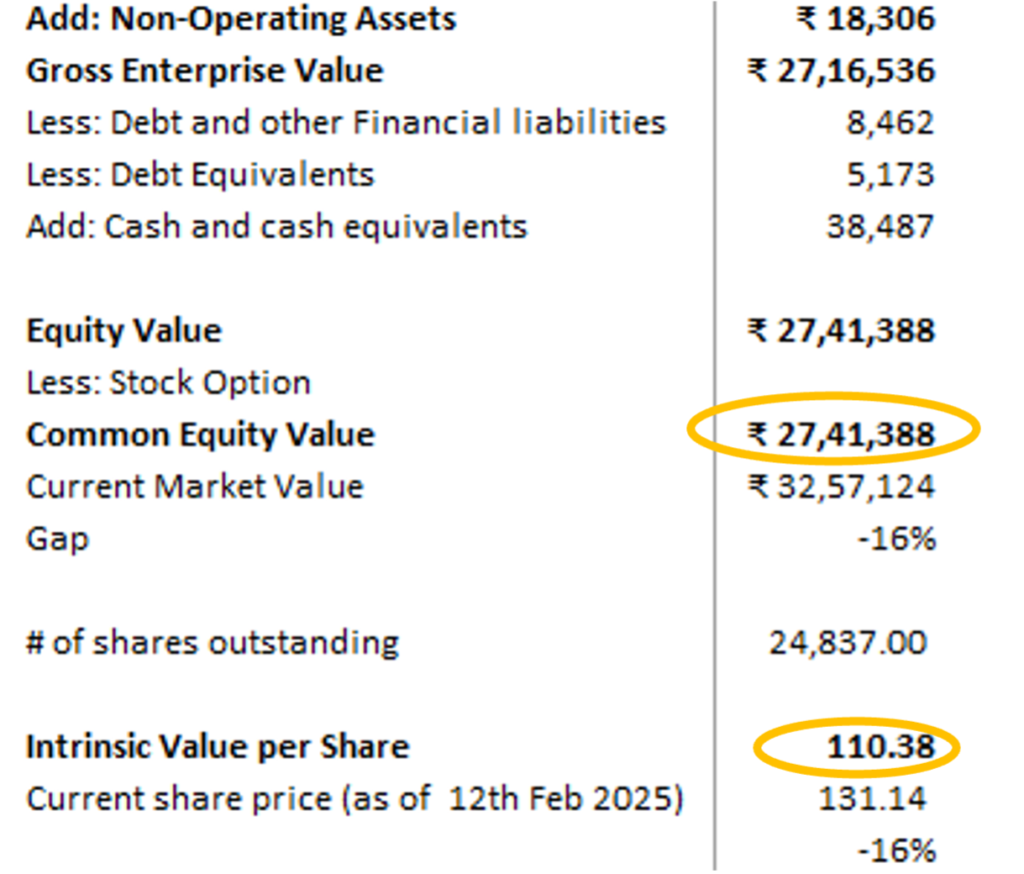
This intrinsic value per share price ($110.38) is slightly lower than the current share price ($131.14), indicating
- Market is more optimistic on long term revenue and margin trajectory compared to what is assumed in this DCF model.
- Given high expectation built in the margin trajectory, Nvidia must continuously maintain its operating margin.
CONCLUSION
The DCF valuation of Nvidia provides a detailed insight into its financial outlook and growth potential. As a leader in AI and semiconductor technology, Nvidia has revolutionized the industry with its cutting-edge innovations. However, the valuation reveals a notable difference between its intrinsic value of $110.38 and its current market price of $131.14. This indicates that investors are factoring in Nvidia’s future growth prospects, driven by its dominance in GPUs, expansion into AI computing, and advancements in data center technology. To justify Nvidia DCF valuation, it must continue delivering strong revenue growth, enhance operational efficiencies, and sustain its technological edge in an increasingly competitive market. Given the rapidly evolving industry landscape, investors should closely monitor Nvidia’s ability to maintain its leadership and translate innovation into long-term financial performance.
Disclaimer: This article is not for investment advice. This article is intended to illustrate a systematic approach to conducting a Nvidia DCF valuation and making reasonable assumptions about growth and profitability.

