Understanding net income is essential for anyone involved in finance or running a business. It serves as a fundamental measure of a company’s profitability and financial health. Net income, often referred to as the bottom line or net profit, is the amount left over after deducting all operating and non-operating expenses from total revenues within a specified period. In simpler terms, it’s what a company earns after paying all its bills. Calculating net income involves subtracting expenses from revenues, providing a clear picture of a company’s financial performance.
In this post, we will look at the nuances of net income, including its derivation and components. We’ll also look at net income margins, how Apple calculates net income, compare year-over-year income statements, and the difference between net income and cash flow. By the end of this article, you should have a thorough understanding of net income and its financial analysis.
What is Net Income?
Net income, also known as the bottom line or net profit or net earnings, is the amount left after subtracting operating and non-operating expenses from total revenues within a specified period.
Calculating net income is simple and involves subtracting expenses from revenues.
Net Income = Total Revenues – Total Expenses
Net income can be positive or negative. When a company has excessive revenue over expenses, we have a positive net income and when a business incurred more expenses than generating revenue during a specified period, we get a negative net income. A positive net income represents profit, a negative net income represents that the business incurred loss during the period and a zero net income shows that the business is at a break-even stage, i.e. no profit no loss.
Components in the calculation of net income include:
- Total Revenue – Inflow of income in a business is generally from two sources. First, income generated from the normal course of business also termed as Revenue from Operations. Second source of income is referred to as other incomes consists of miscellaneous incomes like dividend and interest income.
- Cost of Goods Sold – Cost of Goods Sold (COGS) are the direct cost of operation. It includes labour cost, raw material cost & direct overheads. These expenses are deducted from revenue to generate gross income earned by the business.
- Selling, General & Administrative (SG&A) Expenses – SG&A expenses are the cost of doing business as they are not related to production of goods or services. SG&A expenses is a combination of 3 major costs: a) Selling Expense: Expenses related to the sales activities. These types of expenses include: sales expense, marketing, advertisement & Travel expense. b) General Expense: These are the cost incurred to run a business. It includes rent, utilities, office equipment cost, insurance & supplies. c) Administrative Expenses: These are largely the cost of personnel. The personnel can be the internal staff members or the external suppliers of services. It includes salaries, consulting fees and more.
- Research & Development Expenses – Research and development (R&D) expenses are associated directly with the research and development of a company’s goods or services and any intellectual property generated in the process. A company generally incurs R&D expenses in the process of finding and creating new products or services.
- Interest – Interest is the monetary charge for borrowing money—generally expressed as a percentage. It is the amount of money a lender or financial institution receives for lending out money. It is calculated on the principal amount at a certain or variable rate.
- Taxes – Taxes are mandatory contributions levied on individuals or corporations by the government.
Real Life Calculation of Net Income of Companies
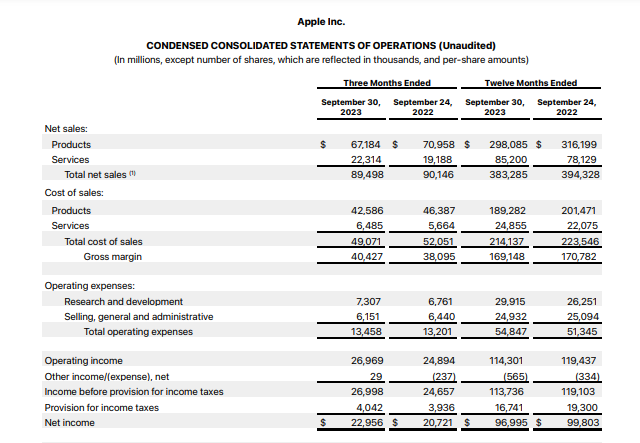
Let’s compute Apple Inc.’s net income for the year ending September 30, 2023 results.:

Source: https://www.apple.com/newsroom/pdfs/fy2023-q4/FY23_Q4_Consolidated_Financial_Statements.pdf
To calculate Apple’s Net Income, start with the company’s total net sales of $383,285 million.
The corporation incurred COGS of $214,137 million for both items and services. To calculate Gross Margins, we subtract Total Net Sales from Total COGS, yielding Gross Income of $169,148 million.
| Gross Income | = Total Net Sale – Total COGS |
| = 383,285 – 214,137 | |
| Gross Income | = $169,148 million |
The corporation also incurred operational expenses of $54,842 million. The operational income is $114,301 million.
| Operating Income | = Gross Income – Operating Expenses |
| = 169,148 – 54,842 | |
| Operating Income | = $114,301 million |
Subtracting Net Other Expenses of $565 million and Income Tax of $16,741 million from operating income yields Net Income of $96,995 million.
| Net Income | = Operating Income – (Net Other Expenses + Tax) |
| = 114,301- (565 + 16,741) | |
| Net Income | = $96,995 million |
Thus, Apple’s net income for FY 2023 was $96,995 million.
Net Income Margins
Net income margin percentage indicates a company’s profitability compared to its revenues. The formula to calculate Net Income Margins is:
Net Income Margin = (Net Income / Total Revenues) *100
The net income margin ratio is an important financial metric that evaluates a company’s profitability and operational efficiency. It represents the percentage of sales revenue that translates into profits after accounting for all the expenses, including taxes and interest payments.
The ideal net income margin ratio varies across different industries, but generally, a higher ratio indicates that the company is utilizing its resources effectively and generating stronger profits. Hence, it is a crucial factor that investors and stakeholders consider when evaluating a company’s financial health and future growth prospects.
Let’s compare the Net Income margins of Apple and Microsoft:
Apple Incorporations:
| Net Profit Margins | = (Net Income/ Total Revenue) *100 |
| = (96,995/383,285) *100 | |
| Net Profit Margins | 25.37% |
Microsoft Corporations:
| Net Profit Margins | = (Net Income/ Total Revenue) *100 |
| = (72,361/211,915) *100 | |
| Net Profit Margins | = 34.14% |
Source of Microsoft Data: https://www.microsoft.com/investor/reports/ar23/index.html Pg-44
Year on Year Comparison of Apple’s Net Income
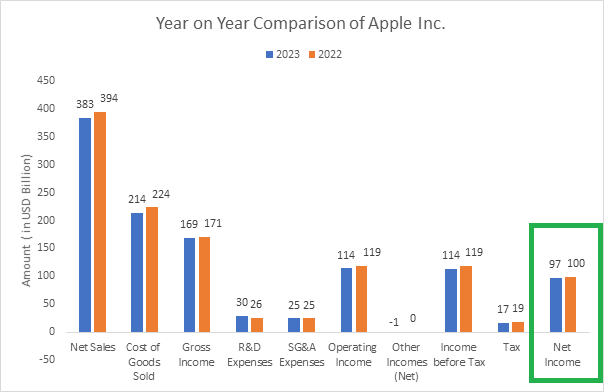
Lets look at the year on year comparison for Apple for FY 2022 and FY 2023.

- Apple’s total net sales in 2023 are down $11 billion from those in 2022.
- Cost of Goods Sold has also decreased by $9.4 billion. It is worth noting that the cost of sales of products declined from 2022 to 2023, but the cost of sales of services increased due to high service expenses.
- Research and development spending have increased by $3.6 billion.
- SG&A expenses will fall to $24,932 million in 2023 from $25,094 million in 2022.
- Operating income is down by 5.1 billion.
- Net income in 2023 has dropped by 2.8 billion compared to 2022 net income.
Difference between Net Income & Cash Flow
Profit and cash flow are crucial financial indicators for businesses. Nonetheless, it happens frequently for people who are unfamiliar with accounting and finance mix up these two concepts. It is critical to distinguish between cash flow and profit in order to make sound decisions about a company’s operations and financial health.
The net balance of money coming into and going out of a business at a given moment is referred to as cash flow.
The amount left over after deducting all of a company’s operating costs from its revenue is known as net income. It’s what’s left over after costs are deducted from revenues and the books are balanced.
The main distinction between cash flow and Net Income is, cash flow shows the net movement of cash into and out of a business, whereas net income shows the amount of money left over after all expenditures have been paid.
Conclusion
Net income is a vital metric in financial analysis, offering valuable insights into a company’s profitability and financial viability. It represents the ultimate measure of success for businesses, reflecting their ability to generate profits from core operations. Understanding net income involves grasping its calculation and components.
Net income margins provide additional context by measuring a company’s profitability in relation to its revenues. Companies use net income to guide strategic decisions, distribute resources, and attract investors.
Furthermore, distinguishing between net income and cash flow is critical for making sound decisions regarding a company’s financial performance and prospects.
Individuals and professionals who understand the subtleties of net income can make informed financial decisions and contribute to a company’s long-term growth and success.


