
Determining the value of a private company is like solving a puzzle without all the pieces. Unlike publicly traded companies with readily available stock prices and extensive financial disclosures, private firms operate in a more opaque environment. This lack of transparency makes valuation challenging, as there are no market-driven indicators to rely on. Consider SpaceX, a privately held aerospace giant—while its valuation is estimated based on funding rounds, there’s no definitive market price like Tesla, its publicly traded counterpart. Similarly, a family-owned manufacturing firm may not have comparable transactions or investor interest to set a clear market value. A real-world example of this challenge was Facebook’s acquisition of WhatsApp in 2014. Since WhatsApp was a private company, Facebook had to determine its valuation based on user growth, revenue potential, and strategic value rather than relying on stock market data. Issues in valuation can arise due to inconsistent financial reporting, lack of transparency in revenue projections, and potential undisclosed liabilities. Because private companies don’t have the exact regulatory requirements as public ones, analysts must rely on alternative valuation methods, each with its strengths and limitations. Here’s how experts determine the worth of private businesses.
In this article, we will be discussing in detail three common methods for valuation of private companies.
Method 1. COMPARABLE COMPANY ANALYSIS (CCA)
Comparable Company Analysis (CCA) is one of the most widely used methods to value private companies. It involves comparing a private firm’s financial metrics with those of similar publicly traded companies. Analysts identify companies operating in the same industry with comparable business models, growth trajectories, and risk profiles. Key financial multiples such as Price-to-Earnings (P/E), Enterprise Value-to-EBITDA (EV/EBITDA), and Enterprise Value-to-Revenue (EV/Revenue) are used to estimate the private company’s value.
Enterprise value of the target private firm = EV/Revenue Multiple (average of the selected public companies) x Revenue of the target private firm
Or,
Enterprise value of the target private firm = EV/EBITDA Multiple (average of the selected public companies) x EBITDA of the target private firm
Or,
Equity value of the target private firm = P/E Multiple (average of the selected public companies) x Net Income of the target private firm
Let’s understand how CCA works in real life through the following example:
We have a private retail company and want to find its valuation.
Steps
1. Select Comparable Companies: Identify public companies that operate in the same industry (retail industry) and have similar size, revenue, growth potential, and risk profiles. In our example, we have selected retail companies like Walmart, Amazon, Target Corp, Costco, and Kroger.
2. Gather Financial Metrics and calculate the valuation of the selected public companies: Collect relevant financial data from the selected public companies, like revenue, EBITDA, and net income (the Revenue, EBITDA, or Net Income used to assess the target firm’s value can be derived from either historical data, such as the Last Twelve Months (LTM), or projected future figures of the selected public companies).
Also, calculate the Equity value and Enterprise value of the selected public companies.
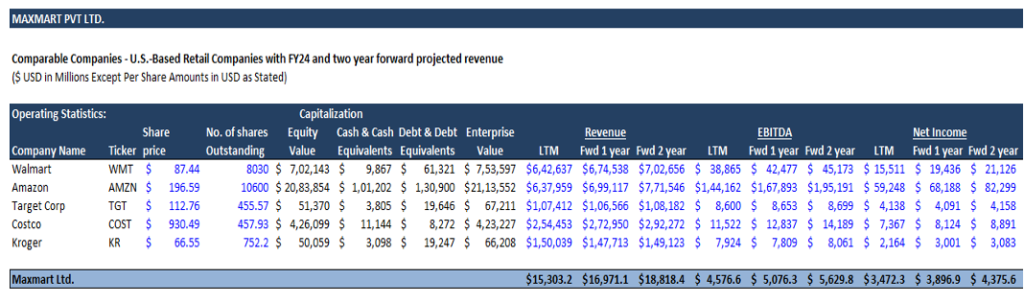
Note: We have gathered the selected public companies’ LTM and forward Revenue, EBITDA, and Net Income figures from the Market Screener website (https://www.marketscreener.com/quote/stock/AMAZON-COM-INC-12864605/calendar/). We have gathered the inputs to calculate the Equity value and Enterprise value of the company from the Yahoo Finance website and the latest annual reports of the company.
3. Calculate Valuation Multiples: Determine key valuation multiples (both LTM and forward) such as EV/Revenue, EV/EBITDA, and P/E ratio. We can then find the median, 75th percentile, 25th percentile, maximum, and minimum of the calculated valuation multiples of the public companies.
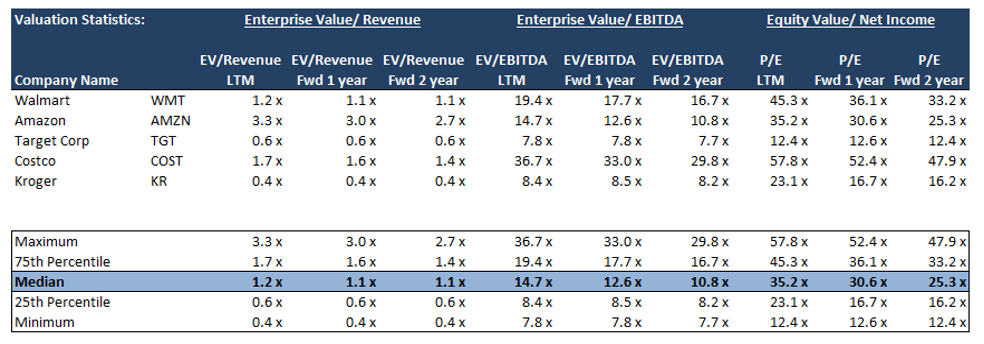
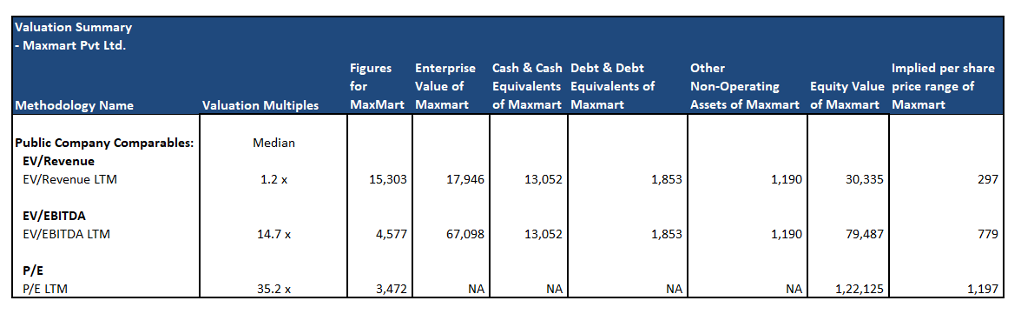
4. Apply the Multiple: Multiply the private company’s corresponding financial metric (e.g., EBITDA, revenue, or net income) by the average multiple (median, 75th percentile, 25th percentile, maximum or minimum) of the comparable public companies. We can derive the implied per-share price range for our private retail company by dividing the Equity value by the total number of diluted shares outstanding.
Note: The Excel template attached for the above work has a drop-down menu for the user to select the average valuation multiple and LTM or Forward metric.
From above we can see that the implied per-share price range at the median valuation multiple comes around $300 to $1200. The price when calculated from the P/E multiple is quite high (around $1200) as compared to the price calculated using the EV multiple. The price calculated from the EV multiple comes to around $300 to $800.
**
Method 2: DISCOUNTED CASH FLOW (DCF) METHOD
Discounted Cash Flow (DCF) analysis is a method of determining a company’s intrinsic value by projecting its future unlevered free cash flows and discounting them back to their present value using the private firm’s Weighted Average Cost of Capital (WACC). This approach involves creating a detailed financial model in Excel, which requires a thorough analysis and numerous assumptions.
The formula for calculating free cash flow is:
Free cash flow = EBIT (1 – tax rate) + depreciation + amortization – change in net working capital – capital expenditures
Or,
Free cash flow = EBIT (1- tax rate) – change in net working capital – change in fixed assets
= NOPAT- Net Investment
Once we have calculated the free cash flow for next 5-15 years, we need to calculate the terminal value.
The formula for the Terminal value is as follows:

Let’s understand the steps to calculate the intrinsic value of a private company using the DCF method.
Steps
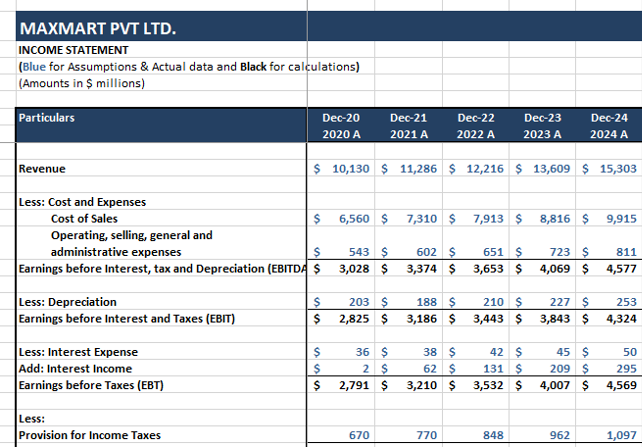
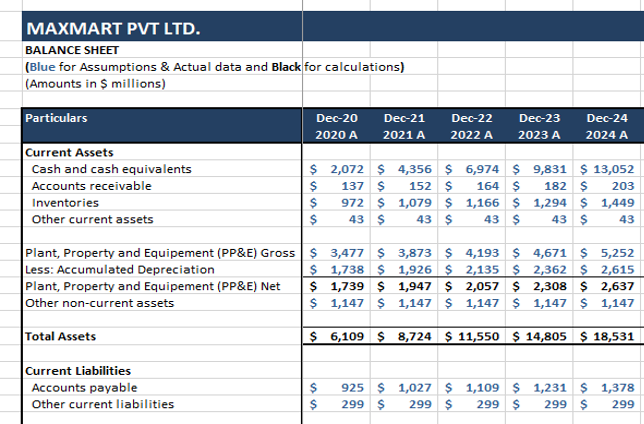
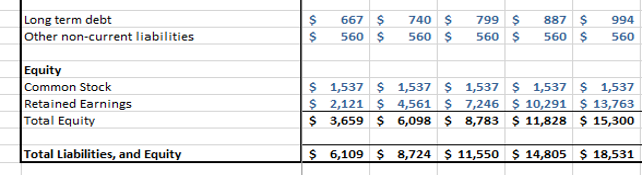
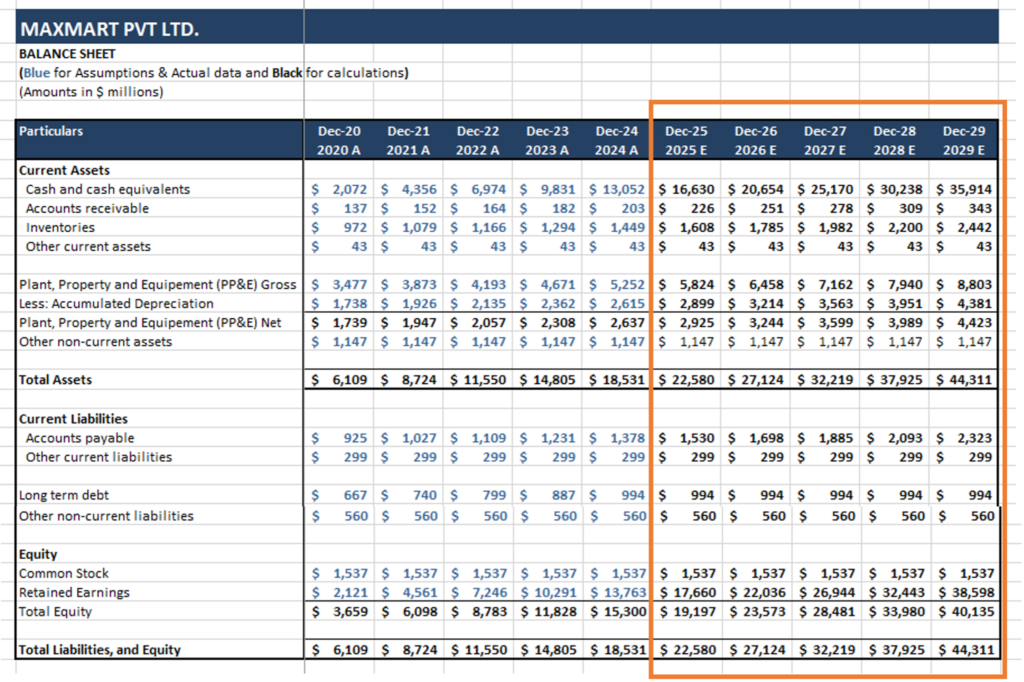
1. Gathering Historical Financial Statements: The first step is to gather the last 4-5 years’ historical financial statements such as the Income Statement and Balance Sheet. If now possible to collect the entire financial statements for the private company, ensure that basic details like Revenue, EBITDA, EBIT, tax rate, and net investment figures are available before proceeding with this valuation method.
Continuing with the above example of a retail private company, we have attached its balance sheet and income statement for the last 5 historical years.

2. Calculating The Discount Rate (WACC): To discount future cash flows, we need an appropriate discount rate, often represented by the Weighted Average Cost of Capital (WACC). WACC is calculated using the following formula:
WACC = (We * Ke) + (Wd *Kd * (1-Tc))
Where:
E = Market value of equity
D = Net Book value of Debt i.e., Book value of debt and debt equivalents less cash & cash equivalents
V = Total market value of equity and Net Book value of debt (E + D)
Ke = Cost of equity
Kd = Cost of debt
Tc = Corporate tax rate
We = E/V
Wd = D/V
However, for a private company, WACC calculation is not that straightforward. Calculating WACC for private companies is difficult due to the lack of available market data, such as beta or market value of equity. Since private firms do not have publicly traded stock, their capital structure and risk profile are harder to assess.
Hence, we can calculate the WACC of a private company as follows:
a) Target Capital Structure: We can calculate the Capital structure of our target private company by selecting similar public companies and gathering its Net debt value and Market capitalization. We can then calculate the median capital structure to be applied for WACC calculation as below.
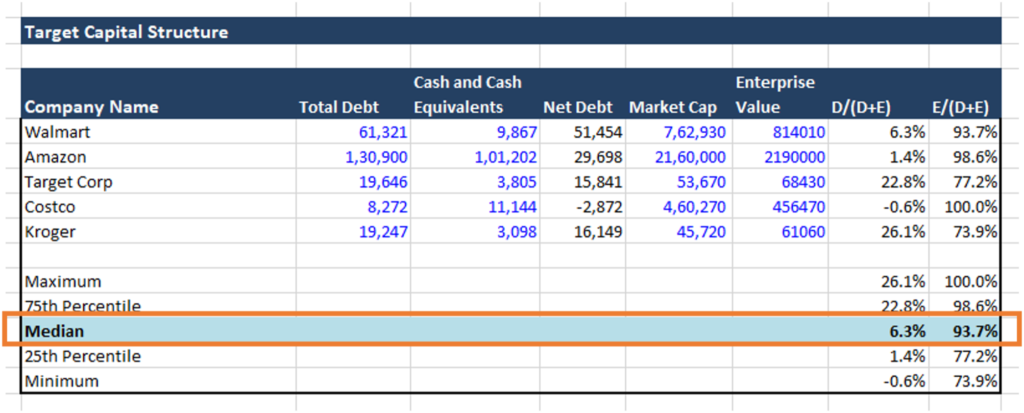
Hence in our example, we will take We as 93.7% and Wd as 6.3%.
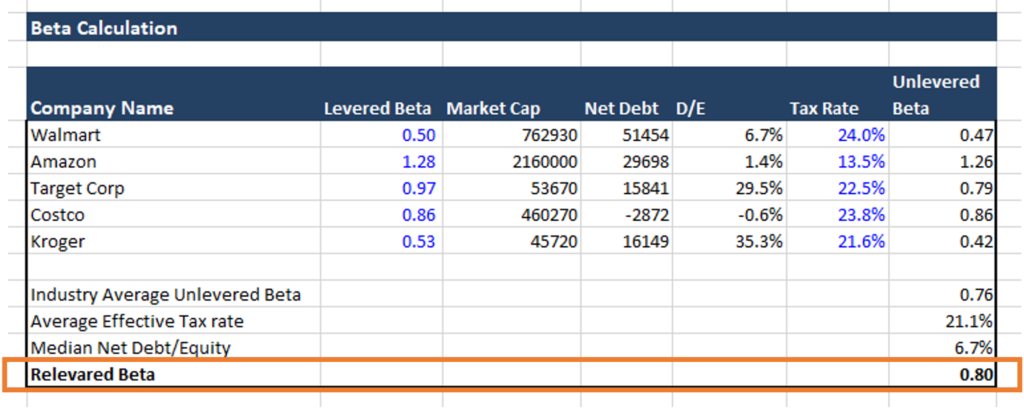
b) Calculating Industry Average Beta: For this, we have to calculate the levered beta of selected public companies. We have to then un-lever the beta using the following formula:
Unlevered Beta= Levered Beta/ (1+(1- Tax Rate) * Median Debt/Equity)
Once we get the unlevered beta for all the selected companies, we can calculate the Industry average unlevered beta and then re-lever the beta using the average effective tax rate and average Net Debt to Equity ratio.
Re-levered Beta= Industry average Unlevered Beta * (1+(1- Average Effective Tax Rate) * (Target Capital Net Debt/Equity)
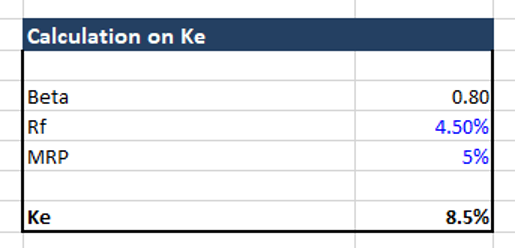
c) Calculation of Ke: Cost of Equity (Ke) is calculated as follows:
Ke = Rf + (MRP)*Beta
Rf is taken as the 10-year US Government bond rate which is 4.5%. MRP is assumed to be 5%.
Ke = 4.5% + 5%* 0.80
= 8.5%
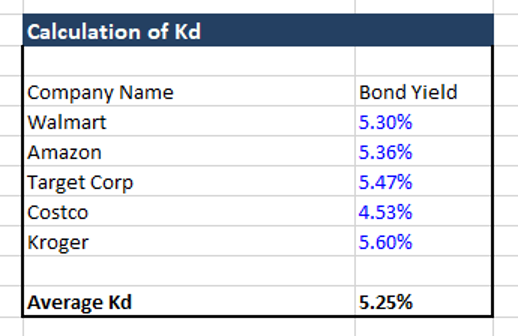
d) Calculation of Kd: To calculate the cost of debt, we can collect the Bond yield of the selected public companies and calculate the average bond yield.
We have collected the Bond yield for all the selected companies from public.com (https://public.com/bonds/screener?bondType=CORPORATE&pageNumber=0 ).
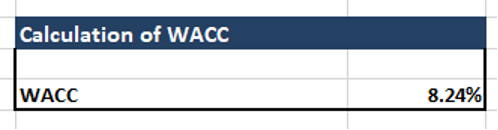
e) Calculation of WACC: Having calculated all the inputs above, we can calculate WACC as follows:
WACC= We*Ke + Wd* (1-Average Effective Tax Rate) * Kd
= 93.7%*8.5% + 6.3% *(1-21.1%)*5.25%
= 8.24%
3) Forecast the financial statements for the next 5 years’ using the Bottom-Up Approach (from 2025 to 2029): Once we have compiled the historical financial statements for 5 years and calculated WACC, we can forecast the next 5 years’ Financial Statements using the Bottom-Up Approach as below.
Note: All the calculations and assumptions for Bottom-up Approach forecasting can be found in the Key Inputs Sheet.
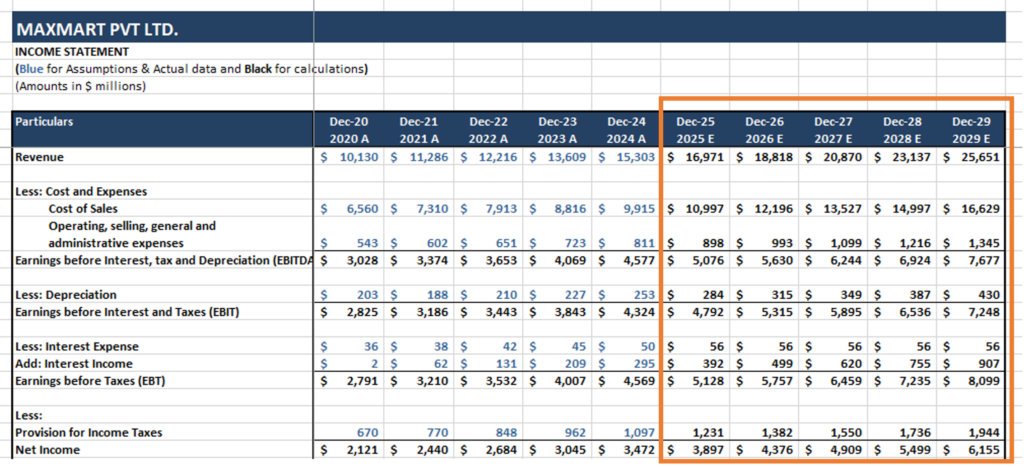
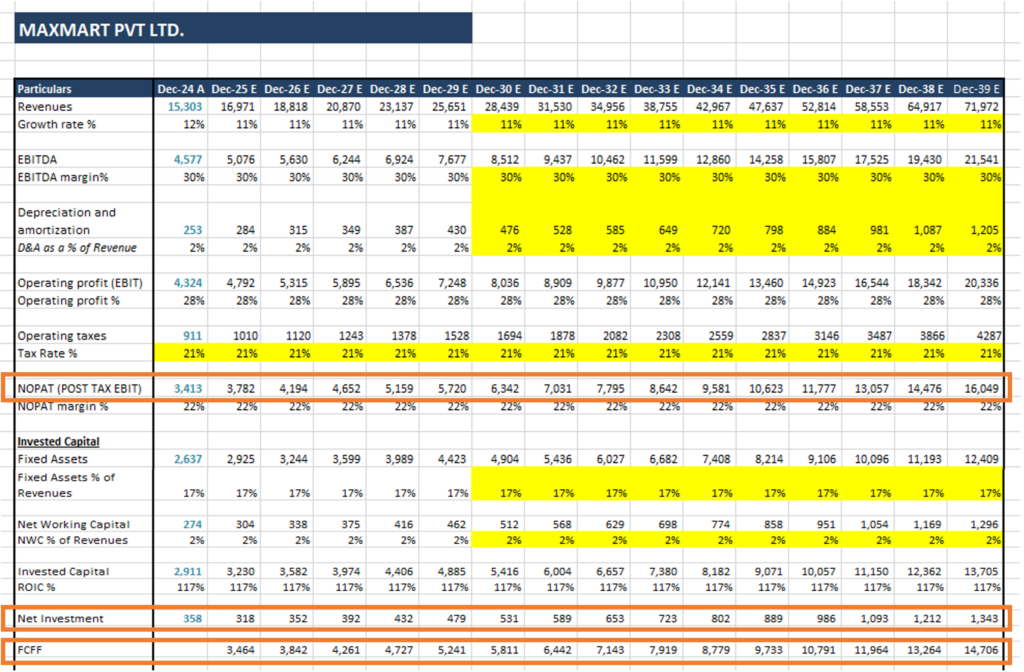
4) Projecting Free Cash Flows: In the above step we have forecasted the Financial Statements for the 5 years from 2025 to 2029 using the Bottom-up Approach. We will link the Revenue, EBITDA, Depreciation, and Net Investment details in our DCF model sheet in Excel. We will then project the Revenue, EBITDA, Depreciation, and Net Investment figures for the next 10 years using the top-down approach. In the Top-down Approach, we are assuming that the Revenue, EBITDA, Depreciation, Capex, and net working capital grow at the same rate as projected in the year 2029.
We can calculate the Free Cash Flow as below:
Free Cash Flow for Firm= EBIT (1-tax) – Net Investment
= NOPAT – Net Investment
For example, FCFF (2025) = NOPAT (2025)- Net Investment (2025)
= 3,782 – 318
= 3,464
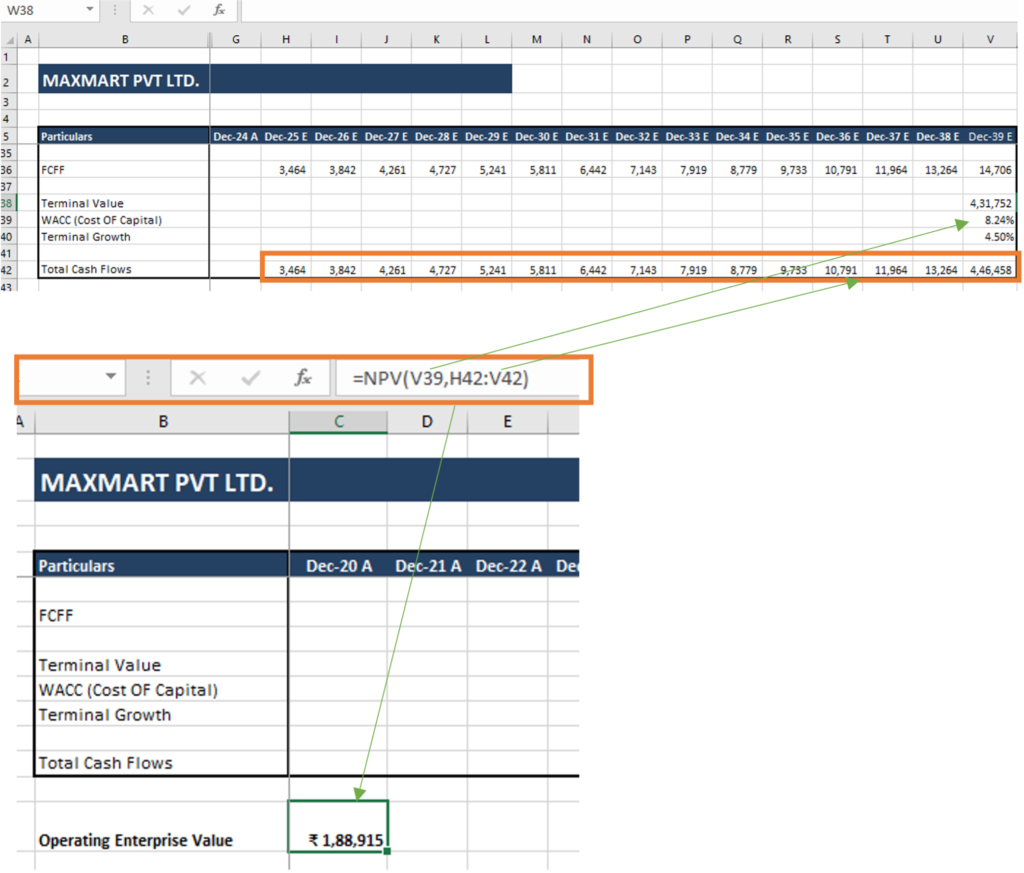
5) Calculating The Terminal Value: Beyond the explicit forecast period of 15 years, a terminal value is computed to capture the company’s value beyond the projection horizon. In this model, a terminal value is calculated as below.

=$16,049 * (1+4.5%) * (1-4.5%/117%)
(8.24% – 4.5%)
= $4,31,752 mn
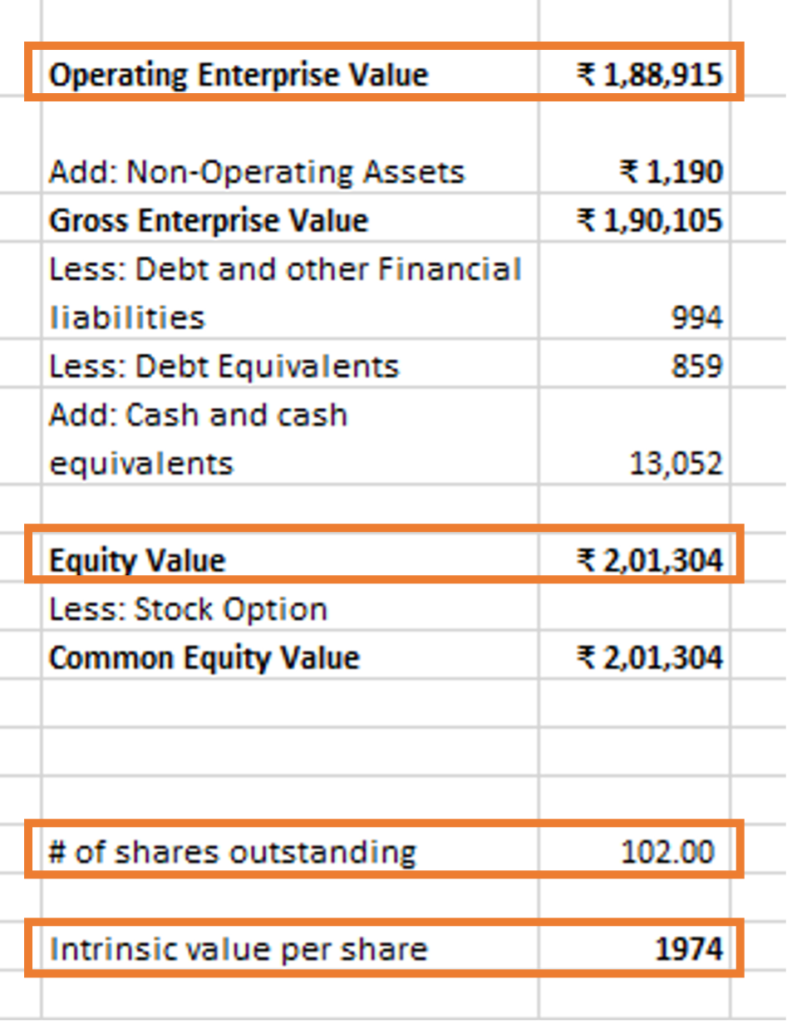
6) Discounting Cash Flows to Present Value: Using the WACC as the discount rate, the projected free cash flows and terminal value are discounted to their present value. The present value of free cash flows and terminal value comes to $1,88,915 mn. We call the present value of FCFF and the Terminal value “the Operating Enterprise Value”, and it is calculated using the NPV function in Excel.
7) Deriving The Intrinsic Value Per Share: Once the Operating enterprise value is calculated, we will add Non-Operating Assets not considered in the exercise of calculating free cash flow to arrive at the Gross Enterprise Value. From this Gross Enterprise Value, we will deduct net debt and debt equivalents and add cash and cash equivalents to provide the Equity Value.
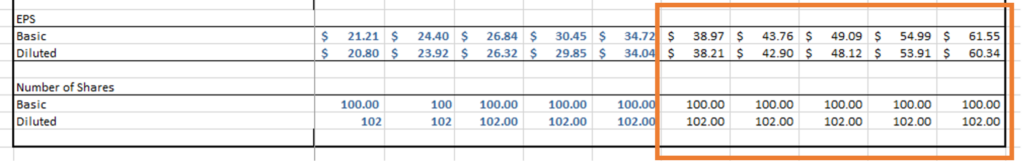
The Equity Value works out to $2,01,304 mn, which is divided by the number of shares outstanding to give intrinsic value per share. The number of shares outstanding for the private retail company is 102 million and the intrinsic value per share is $1974.
**
Method 3: PRECEDENT TRANSACTION ANALYSIS (PTA)
Precedent Transaction Analysis (PTA) assesses the value of a private company by examining the acquisition prices known as deal value of similar companies in recent transactions. This approach helps gauge what buyers are willing to pay in the current market.
Let us understand how to calculate the intrinsic value of the retail private company using PTA.
Steps
1. Identify Relevant Transactions and gather important financial figures: Find recent acquisitions of similar companies within the same industry. We have taken the following transactions and gathered the relevant data for the same.
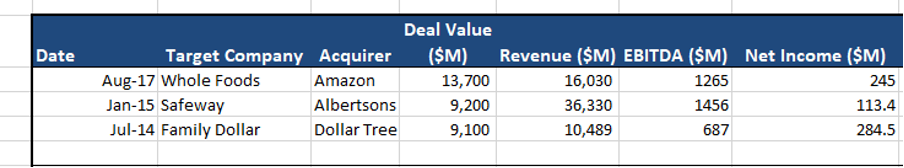
We will take the Revenue, EBITDA, and Net Income of the Target company just before or at the time the deal has taken place.
2) Calculate Deal Transaction Multiples: Calculate Deal transaction multiples like EV/Revenue or EV/EBITDA for all the selected company transactions. Then calculate the average (median/75th percentile/25th percentile/maximum or minimum) deal multiples.
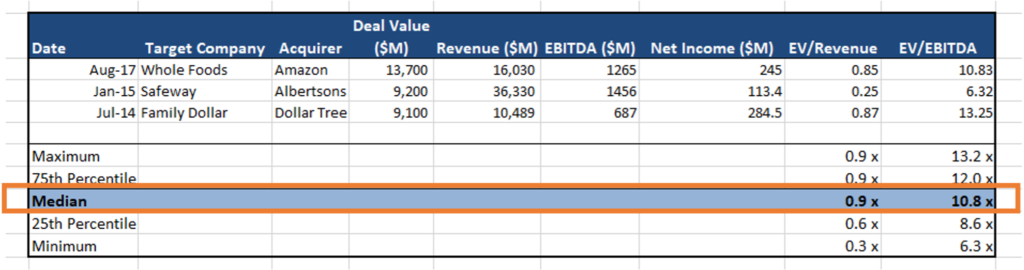
3) Apply the Multiples: Apply the average (median/75th percentile/25th percentile/maximum or minimum) transaction multiple to the private company’s corresponding financial metric.
Enterprise value of the target private firm = EV/Revenue Multiple (average of the selected public transactions) x Revenue of the target private firm
Or,
Enterprise value of the target private firm = EV/EBITDA Multiple (average of the selected public transactions) x EBITDA of the target private firm
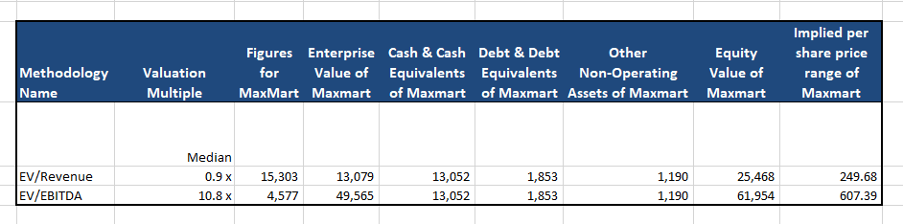
Above we can see at the median deal transaction multiple the implied per share price if the retail company is coming to $249.68 and $607.39.
**
WHY ARE THE VALUATION NUMBERS SO DIFFERENT?
We have studied above all the three common methods for the valuation of a private company. Let’s summarize the price range derived from each method in the table below.
| Method | Price 1 | Price 2 | Price 3 | Range |
| Comparable Company Analysis (CCA) | $ 307 | $ 748 | $ 1,168 | $307-$1168 |
| Discounted Cash Flow Analysis (DCF) | $ 1,974 | – | – | $1974 |
| Precedent Transaction Analysis (PTA) | $ 250 | $ 607 | – | $250-$607 |
We can see that the Value derived from the DCF method is very different from the other two methods. Let’s understand why there is so much disparity in the DCF valuation from CCA and PTA valuation.
In our DCF model, we have assumed that the Private retail company is a continuously growing company, and its Revenue and EBITDA grow at the same rate as the historical growth rate of around 11% and 30% respectively. However, while calculating the implied per-share value of the private company using the CCA method, we have calculated the average industry Revenue and EBITDA growth rate around 5% and 6% respectively. Instead, of taking the growth rate of Revenue and EBITDA as 11% and 30% respectively. In our DCF model, if we apply the industry average growth rate of 5% and 6%, we will get the implied per-share value for the retail company around $400. This implies that we are expecting our private retail company to perform better than the industry average growth rate.
PROS AND CONS OF THE VALUATION METHODS DISCUSSED ABOVE
Each valuation method discussed above has its Pros and Cons. Companies should select the best option out of the available options considering the availability of the data. Some companies also perform all the valuation methods and arrive at an average implied value.
| Method | Pros | Cons |
| Comparable Company Analysis (CCA) | – Easy to apply using market data | – May not find perfect comparable companies |
| – Reflects real market conditions | – Market multiples can be volatile | |
| Precedent Transaction Analysis (PTA) | – Uses real-world acquisition data | – Deal terms and conditions may differ |
| – Reflects actual buyer willingness to pay | – Limited number of relevant transactions | |
| Discounted Cash Flow (DCF) | – Incorporates company-specific projections | – Highly sensitive to assumptions, discount rate, and terminal value |
| – Considers future growth potential | – Difficult to determine accurate WACC for private firms |
IMPORTANT THINGS TO KEEP IN MIND WHILE DOING THE VALUATION OF PRIVATE COMPANIES
Private companies differ from Public companies in terms of liquidity, marketability, and accounting transparency. So analysts before conducting the valuation of private companies should consider the following:
- Normalize Financials: Adjust for owner’s compensation, remove non-recurring items, and account for related-party transactions.
- Apply Discounts: Consider discounts for lack of marketability (DLOM) and lack of control (DLOC).
- Assess Growth and Risk: Evaluate realistic revenue growth and apply higher risk premiums.
- Review Capital Structure: Analyze the debt-equity mix and future funding needs.
- Evaluate Management and Governance: Assess management quality and succession planning.
- Analyze Industry and Market Conditions: Consider industry trends and economic cycles.
These adjustments refine valuation models and mitigate potential inaccuracies.
CONCLUSION
Choosing the right valuation method depends on the industry, financial stability, and purpose of the valuation. Investors often use a combination of methods to ensure accuracy and reliability. By understanding these techniques, stakeholders can make informed decisions when investing in or selling private businesses.

