
INTRODUCTION
A Financial Model is the backbone of effective decision-making in the modern business landscape. These indispensable tools transform historical financial data into powerful forecasts, helping companies assess future performance while evaluating risks and returns. Typically organized around the three fundamental financial statements—income statement, balance sheet, and cash flow statement—financial models are crucial for management teams seeking clarity in strategic and capital decision-making. Yet, the effectiveness of a financial model relies heavily on its foundation. To construct a robust and reliable model, finance professionals must prioritize three key areas: planning, structuring, and formatting. This article serves as a comprehensive guide for entry-level and intermediate finance professionals, detailing best practices at each stage of financial modelling to sharpen their analytical skills and enhance decision-making processes.
1. PLANNING YOUR FINANCIAL MODEL: LAYING THE GROUNDWORK FOR SUCCESS
The planning phase is the foundation upon which your financial model will be built. Financial modelling can be used for various purposes some of them being Equity research, Project finance, financial planning, Mergers and Acquisitions, leveraged buyouts, start-up investing or credit analysis. A well-thought-out plan ensures that your model meets its intended purpose, remains flexible for future updates, and avoids errors from the outset. Here are the best practices for planning a financial model:
a. Define the Purpose and Scope of the Model: Start by identifying the purpose of your model. Is it to evaluate a potential investment, forecast revenue, find whether a stock is overvalued or undervalued or analyse financial risks? Clearly defining the model’s goal will help guide the structure and ensure the right data is incorporated. For instance, if you’re building a financial model to project Tesla’s future earnings, you need to focus on inputs such as production capacity, sales, and market demand.
b. Gather Reliable Data: Ensure you have access to reliable historical data and assumptions. This step is critical to avoid inaccuracies in your model’s outputs. Data points like past revenue, cost structures, and market trends help build a solid foundation for forecasting. When planning a financial model for a company like Apple, you’d gather historical sales data, product demand trends, and research projections for upcoming products. To gather reliable historical data example for Apple Inc., access its investor relations website for financial statements and SEC filings, and utilize platforms like Yahoo Finance and Bloomberg for performance metrics. Additionally, consult market research firms such as Gartner and IDC for insights on product demand trends and industry forecasts.
c. Outline Key Assumptions: List the assumptions that will drive your model’s calculations. These could include growth rates, cost of capital, or operating expenses. Be transparent about your assumptions and, wherever possible, base them on verifiable data or industry benchmarks. For example, if your model assumes an increase in revenue for Ericsson based on expanding 5G coverage, be sure to provide evidence to support that assumption as below.

Source: Press release https://www.ericsson.com/en/press-releases/2023/2/ericsson-mobility-report-business-review-edition-5g-drives-revenue-growth
**
2. STRUCTURING YOUR FINANCIAL MODEL: THE BLUEPRINT FOR EFFICIENCY
The structure of a financial model determines how easy it is to use, audit, and update. A well-structured model flows logically from inputs to outputs, allowing anyone—whether a team member or stakeholder—to follow the logic and make sense of the results. Best practices in structuring a model ensure that it’s intuitive and error-free. You can download the best practices financial model.
a. Use a Modular Approach: Divide your model into clear, distinct sections that separate inputs, calculations, and outputs. This simplifies tracking changes and helps quickly identify and resolve any errors. Most financial models can be divided into five essential tabs:
- Cover Page Tab: Include the model’s purpose, the author’s contact information, and any disclaimers.
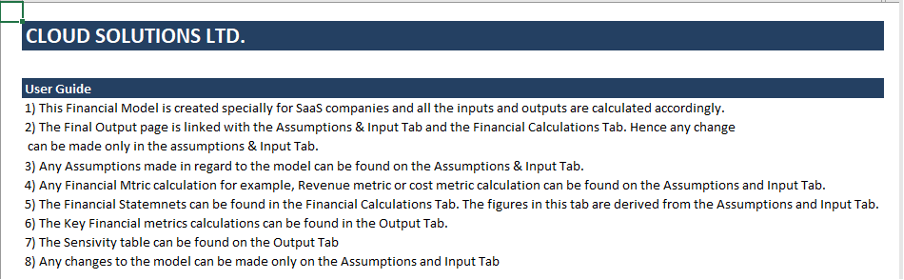
- User Guide Tab: Explains the purpose of the model, where the user can find inputs, where to find the calculations and where to find the output.
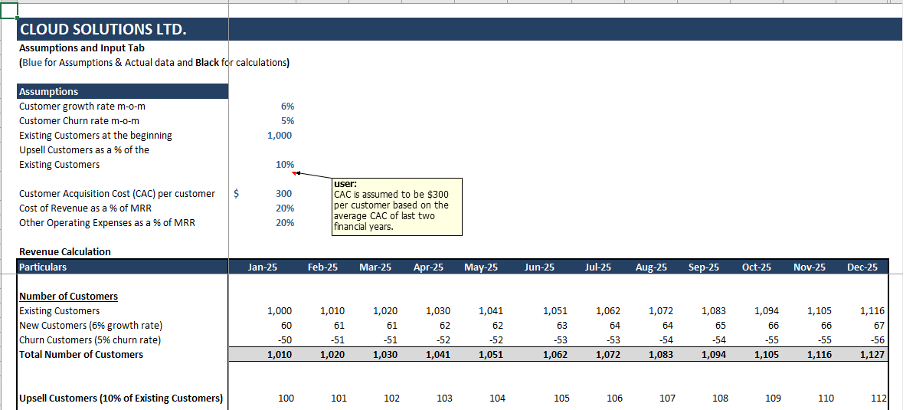
- Assumptions & Inputs Tab: This tab contains all the essential inputs and assumptions that drive the financial model. These inputs include variables such as revenue growth rates, cost projections, and operational metrics, which form the foundation for forecasting financial statements and performance outcomes.
- Financial Calculation and Projections Tab: This section focuses on calculating and projecting financial statements interlinkages—such as the income statement, balance sheet, and cash flow—based on the key inputs. It provides a structured view of the company’s future financial performance, informed by the assumptions made in earlier tabs. We can also create scenario and sensitivity analysis tables along with the financial calculations so that we can test real time how different assumptions (like changes in growth rates, costs, etc.) impact the outcomes. It provides insights into risks and potential outcomes.
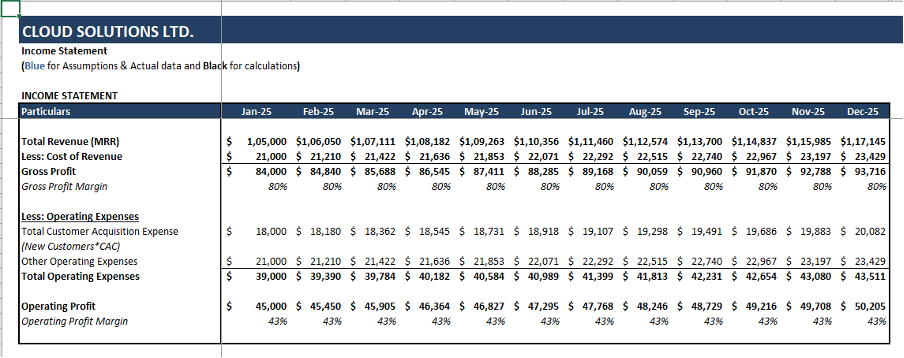
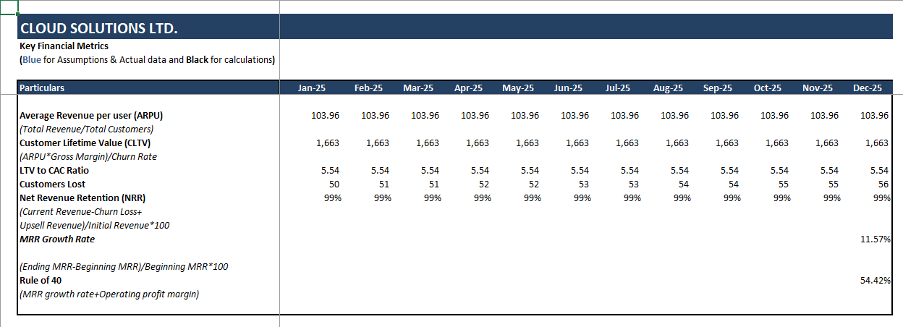
- Outputs Tab or Performance Dashboard Tab: This section provides a clear summary of key financial metrics and performance indicators derived from the financial model. Dashboards are often integrated within this tab to present the data visually through charts, graphs, and tables, allowing for a quick, at-a-glance view of a company’s financial health and performance trends.

b) Maintain a Logical Flow: Ensure your model follows a logical sequence from inputs to outputs. A good rule of thumb is to place assumptions and inputs at the beginning, calculations in the middle, and outputs at the end. This setup ensures that changes to assumptions flow down through the model and update the results automatically.
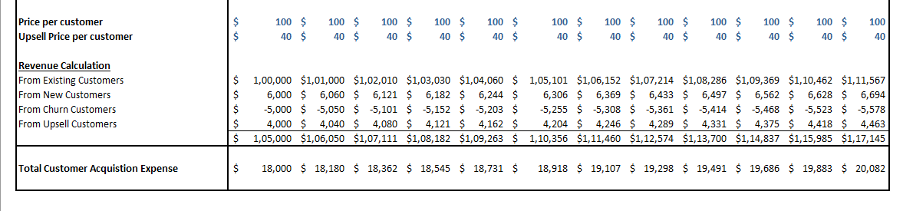
c) Link Data, Don’t Copy: One of the most important structural practices is to link data across tabs rather than copy-pasting it. Linking ensures that any changes in one area are reflected everywhere else. For instance, if you’re forecasting a company’s revenue, you might want to link production volume data from the Assumptions & Input tab directly to your revenue calculation in the Financial Projections tab, ensuring consistency. Here’s an example where the revenue in the Income Statement is connected to the Assumptions and Input Tab, as illustrated below.
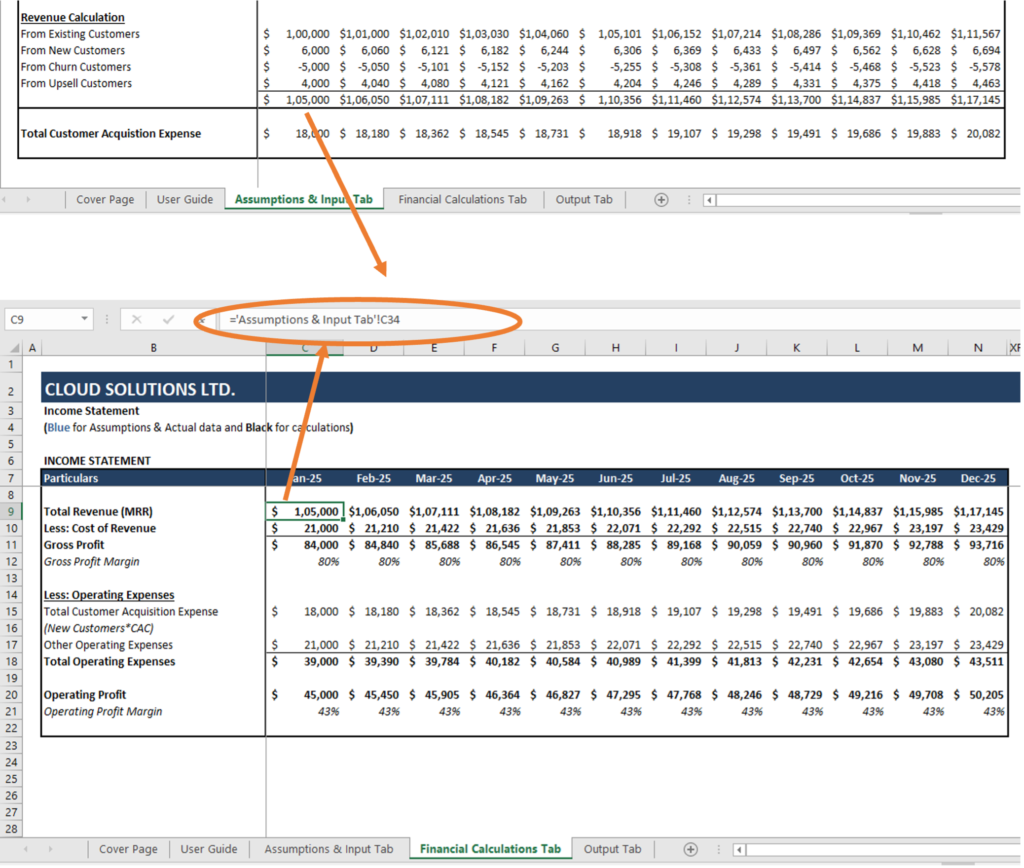
The Assumptions & Input Tab shows how Revenue is calculated and assumptions regarding the unit price and volume. The final revenue calculation is linked to the Income statement. Anyone can trace back and make changes to the Assumptions & Input data in order to change the revenue figures on the Income Statement.
**
3. FORMATTING YOUR FINANCIAL MODEL: ENHANCING READABILITY AND ACCURACY
Proper formatting ensures that your financial model is not only functional but also easy to read and understand. A model with clear formatting allows users to quickly identify assumptions, calculations, and results, while reducing the risk of errors. Here are some of the best practices for formatting:
a) Colour Code Inputs, Outputs, and Formulas: A standard formatting technique in financial modelling is to colour code cells based on their function. This helps differentiate between input cells (assumptions), output cells (results), and formulas (calculations). For example:
- Inputs (hard-coded data) like historical values and assumptions could be coloured blue.
- Calculations, Formulas or references could be left in black.
- Formulas and calculations that link to other sheets could be highlighted in green.
- Errors to be fixed could be highlighted in red.
- Formulas and calculations linking to other excel files could be highlighted in purple.
This visual distinction improves readability, making it easier to understand which cells can be adjusted and which are protected. If you’re working with a model for a company, having clear colour coding can prevent someone from accidentally altering a formula rather than an input. In all the examples above note that the assumptions are highlighted in blue and all calculations and formula in black.
b) Use Consistent Number Formatting: Always use consistent number formats for figures like currencies, percentages, and units. This avoids confusion and keeps your model clean. For instance, if you’re modelling the revenue growth of a company, use the same percentage format throughout, or if currency is used, consistently apply a dollar or euro symbol. This simple practice helps users follow the calculations more easily.
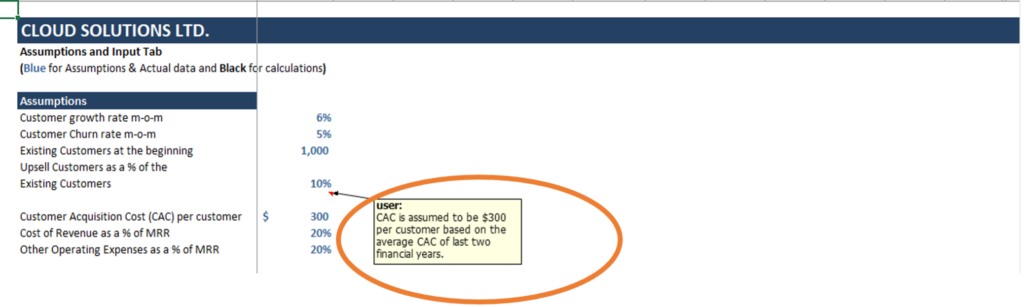
c) Add Comments and Documentation: Include comments in the model to explain assumptions or calculations that might be complex or not immediately obvious. This is especially useful when passing the model to another user or when presenting it to stakeholders. For example, in a financial model for the above company, you might leave a comment next to an assumption about growth in subscriber’s rate to explain the reasoning behind it as follows.
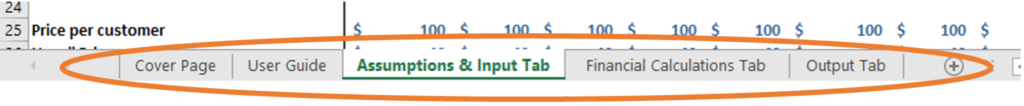
d) Use Clear Labels and Titles: Label each section, tab, and key figure clearly. This ensures that users can navigate the model easily and quickly find the data or calculation they’re looking for. For instance, in the Outputs tab, clearly label sections like “Net Income,” “Operating Cash Flow,” and “EBITDA” so that stakeholders can immediately grasp the key financial highlights. Below is the example of the company where we have maintained clear titles to the tab having Cover Page, Assumptions & Inputs, Financial Calculations & Output Tab.
**
SOME OTHER BEST PRACTICES TO MAKE ROBUST FINANCIAL MODELING TEMPLATES
1. Incorporate Error Checks: A well-constructed model should include built-in error checks to ensure its integrity. Error-checking mechanisms—like control totals, circularity checks, and warnings—allow users to catch mistakes early. This is particularly crucial in models for complex operations, like General Electric, where multiple divisions feed into one consolidated model. Error checks ensure the balance sheet balances and highlight discrepancies before they become major issues.
2. Build Flexibility and Room for Growth: A financial model must be adaptable to changes while being capable of expanding as the business grows. As businesses grow, their financial needs evolve, and models should be able to incorporate new data, business lines, or regions without requiring an overhaul. For example, Alphabet Inc., with its multiple subsidiaries and revenue streams, would require a financial model that scales as the company continues to innovate and expand.
3. Version Control and Backup: Tracking changes is crucial in financial modelling, especially when working in teams. Version control ensures that everyone is working on the latest version of the model, while backups provide security in case of errors or data loss. When managing the financial model for a complex company, having a version history allows the team to review previous iterations and maintain a clear audit trail.
4. Test for Plausibility: Ensure that the results of your financial model make sense. After building your model, step back and ask whether the outputs align with realistic expectations. For example, if your model projects unrealistically high revenue growth for a retail company, it’s time to revisit the assumptions or formulas used.
5. Avoid having same inputs or assumptions at multiple locations of excel file: Keep your inputs streamlined and transparent. To avoid confusion and errors, consolidate all your inputs in dedicated assumptions and input tabs, ensuring they are referenced from a single source throughout the model. This approach simplifies updates and enhances clarity.
6. Avoid hiding sheets or rows: Instead of hiding rows or columns in lengthy spreadsheets, use the “group” feature to collapse sections. This keeps your model organized while ensuring all data remains easily accessible for review or updates.
CONCLUSION
Mastering financial modelling is not just about plugging numbers into Excel. It’s about following a set of best practices that ensure your model is accurate, transparent, and easy to use. By taking the time to plan your model, structuring it logically, and formatting it clearly, you’ll create a powerful tool that can inform crucial business decisions and adapt to changing circumstances.
From forecasting Apple’s future product sales to modelling Tesla’s production capacity, these best practices will serve as your guide to building financial models that are robust, scalable, and insightful. Whether you’re presenting to stakeholders or running scenario analyses, a well-planned, structured, and formatted financial model will provide clarity and help guide strategic decision-making.

