
Money is the lifeblood of any firm. Funds are crucial because they are necessary to finance assets such as equipment, inventories, and technology, to meet working capital requirements, and to manage SG&A expenditures.
In the corporate world, having access to funds is critical for survival, growth and innovation. Funds can be obtained either by issuing equity or through borrowings. But lending and borrowing is not an easy task. To make a secure investment, lenders should check the borrower’s creditworthiness and operating efficiency. Therefore, for this task, Debt Service Coverage Ratio is essential.
What is the Debt Service Coverage Ratio?
The Debt Service Coverage Ratio (DSCR) is a financial measure that evaluates a borrower’s capacity to repay debt commitments. It is determined by dividing the company’s annual net operating income (NOI) by its periodic debt service.
Debt Service Coverage Ratio = Net Operating Income/ Total Debt Service.
- Net Operating Income = Revenue – Operating Expenses
- Total Debt Service = Principal + (Interest x (1- Tax Rate))
| Note – | When we multiply (1- Tax Rate) with any value, we get the after-tax value. Example: In this case we have interest. Company A has taken a loan of $500,000, with 10% interest and 30% tax rate. Interest before tax = $50,000* 10% = $50,000. Interest After Tax = Interest* (1- Tax Rate) = $50,00* (1-30%) = $50,000* (0.70) Interest After Tax = $35,000 |
DSCR ratio is calculated in ‘x’-times, which shows net operating income should be ‘x’ times the amount of the annual debt service.
- DSCR > 1 indicates that the business has strong cash flows and will be able to repay interest and principal amount.
- DSCR = 1 shows the break-even point of net operating income to the debt service of a business.
- DSCR < 1 indicates the business is in a cash flow negative situation and might not be able to service debt in future.
DSCR is used both by lenders and investors. Lenders use the debt service coverage ratio to estimate the creditworthiness and repayment power of the borrower. On the other hand, investors use the debt service coverage ratio to evaluate the operating efficiency of a business.
Generally, DSCR equals 1.2 times or above showing the strong cash flow of the business and the ability to satisfy its debt commitments.
Real Life Example of Exxon Mobil
Let’s compute Exxon Mobil Debt Service Coverage Ratio for the year 2022:
Debt Service Coverage Ratio = Net Operating Income/ Total Debt Service.
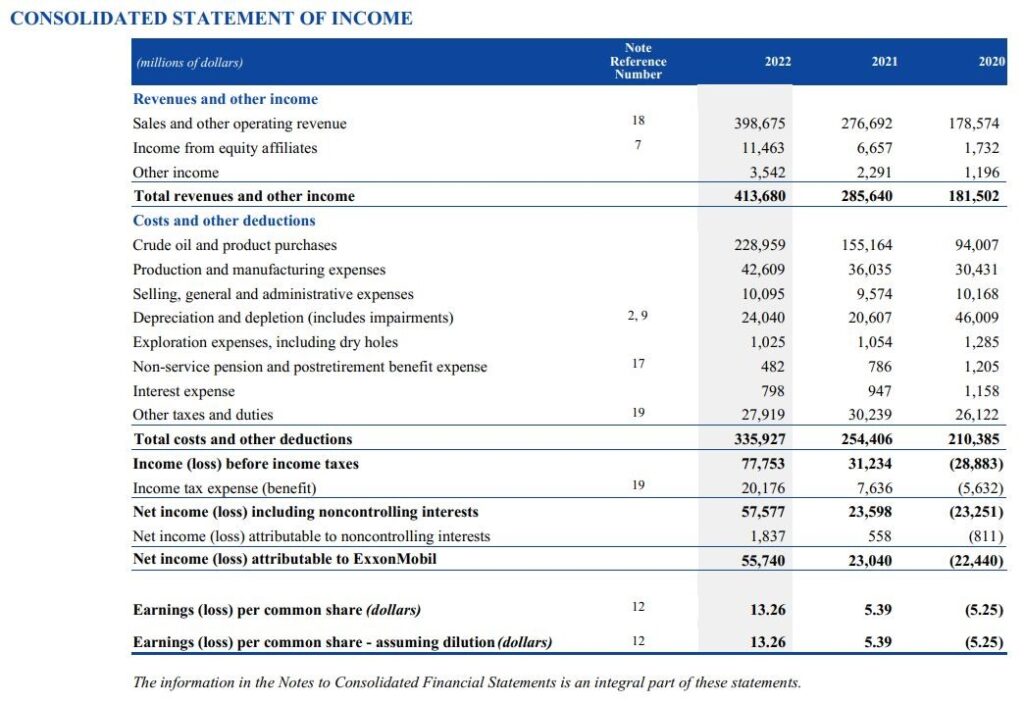
| = Total Revenue – Operating Expenses = 398,675 – (228,959 + 42,609 +24,040+10,095 + 1,025) = 398,675 – 306,728 = 91,947 | = 91,947 |
| Total Debt Services | = Principal (Long term + Short term) + (Interest * (1- Tax Rate)) |
| = (40,559 + 634) + (798 * (1 – 33%) | |
| = 41,193 + (798 * 0.67) | |
| Total Debt Services | = 41,727.7 |
Note – For Effective Tax Rate refer Source, Notes to Accounts – 19, Page: 114 – 115.
| Debt Services Coverage Ratio | = Net Operating Income/ Total Debt Service. |
| = 91,947/ 41,727.7 | |
| Debt Services Coverage Ratio | = 2.2 times |
The Debt Service Coverage Ratio of Exxon Mobil is 2.2 times. Which means net operating income of Exxon Mobil is 2.2 times more than that of its Total Debt Service.
What is Debt Service?
In Debt Service, the term debt means the amount of money owed to someone, and service signifies the act of dealing with something. Therefore, Debt Service refers to the amount of cash required to pay the principal and interest on a debt for a year.
Debt Service = Principal + Interest
As seen in the above example, the Debt Service of Exxon Mobile is $41,727.7 million.
Difference Between Debt Service and Debt Service Coverage Ratio
Debt service is the amount payable to the lender during a given period. Debt Service Coverage Ratio is the ability to generate cash flows of businesses to repay the principal and interest.
In debt service, we calculate the entire debt payment amount, which includes the principal and interest. To measure a business’s operating efficiency, we use DSCR, which compares net operating income to total debt service.
Why do we take net operating income while calculating the Debt Service Coverage Ratio?
Net Operating Income (NOI) is the amount left after subtracting all operating expenses from revenue.
Net Operating Income = Revenue – Operating Expenses
NOI is used to analyse the profitability of a business. We use net operating income while calculating the Debt Service Coverage Ratio because it highlights the position of cash sustained by the business before deducting interest and tax. If Net Operating Income is more than interest and tax, it shows that the business is efficient in making these payments in future.
Comparative Analysis of Debt Service Coverage Ratio
A comparison between Exxon Mobil and Chevron Corporations would help us comprehend the Debt Service Coverage Ratio better.
Financials of Chevron Corporations
Source: https://www.chevron.com/-/media/chevron/annual-report/2022/documents/2022-Annual-Report.pdf
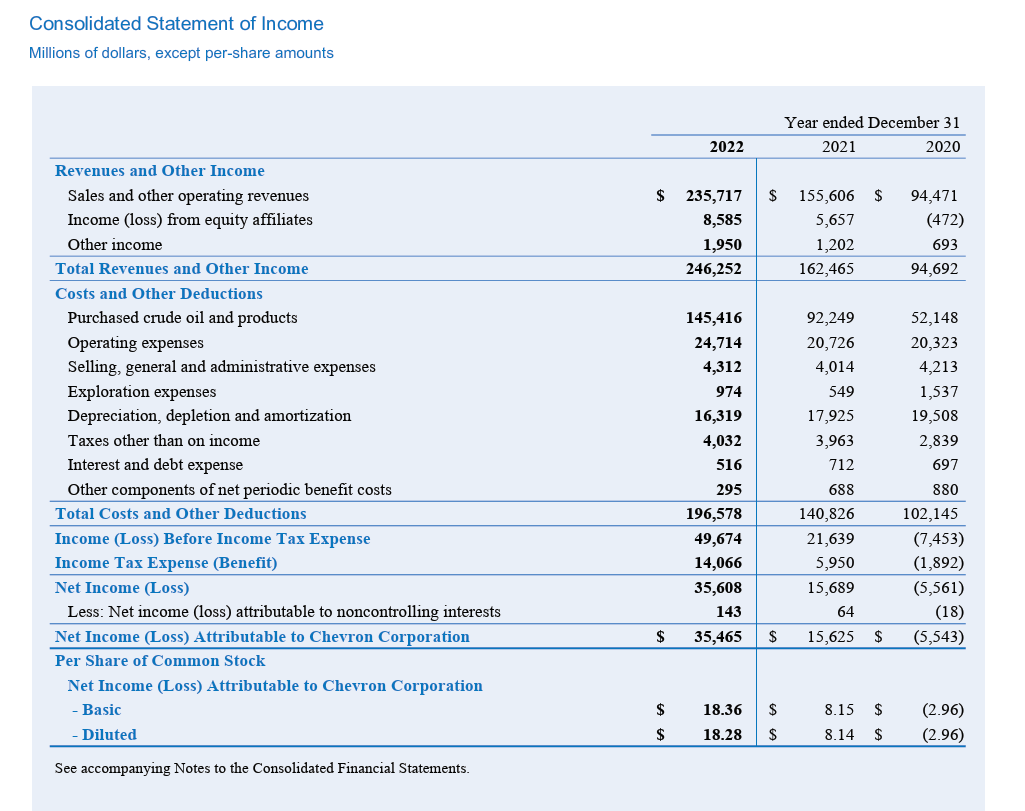
| = Total Revenue – Operating Expenses = 235,717 – (145,416 + 24,714 + 4,312 + 974 + 16,319) = 235,717 – 191,735 = 43,982 | = 43,982 |
| Total Debt Services | = Principal (Long term + Short term) + (Interest * (1- Tax Rate)) |
| = (21,375 +1,964) + (516 * (1 – 28.3%) | |
| = 23,339 + (516 * 0.717) | |
| = 23,339 + 369.97 | |
| Total Debt Services | = 23,708.97 |
Note – For Effective Tax Rate refer Source, Notes to Accounts – 17, Page: 82
| Debt Services Coverage Ratio | = Net Operating Income/ Total Debt Service. |
| = 43,982/ 23,708.9 | |
| Debt Services Coverage Ratio | = 1.9 times |
The Debt Service Coverage Ratio of Chevron Corporations is 1.9 times, indicating net operating income of Chevron exceeds its debt service by 1.9 times.
- DSCR of Exxon Mobile = 2.2 times.
- DSCR of Chevron = 1.9 times.
When compared to Exxon Mobil, we can observe that Chevron has a slightly lower DSCR.
Relation between Debt Service Coverage Ratio & Loan to Value
Loan to Value (LOV) Ratio is a measure used by lenders to determine the proportion between the loan amount and appraised value of an asset usually a property.
Loan to value = Loan Amount/ Appraised Property Value
The ratio indicates that the loan taken for an asset is in what proportion to the value of that asset. Lenders use LOV ratio to establish the risk of default associated with the loan value given to the borrower. If the LOV ratio is low that means there is a low risk of default because the loan amount taken is less in proportion to the appraised value. On the other hand, if the LOV ratio is high this indicates there is higher risk because the assets are being financed with a greater part of debt than equity and loan amount is more in proportion to the appraised value.
LOV, along with Debt Service Coverage Ratio, is used by lenders to assess the right loan amount and a business’s creditworthiness. The ratios assist lenders in assessing the risk and financial efficiency of a firm or investment.
A greater DSCR typically correlates with a lower loan-to-value ratio, representing the company’s capacity to meet its debt obligations. A low DSCR corresponds to a high loan-to-value ratio, indicating that the business has a low cash flow and is primarily financed with debt, which is dangerous from the lender’s perspective.
Debt Service Coverage Ratio vs Debt to Asset Ratio
Another way to assess the debt repaying capacity of a business is to use the debt to asset ratio to understand how much is the value to be repaid relative to value of the assets being financed. If this is a low number, there is enough margin of safety to pay back the debt from selling the assets of the company.
Conclusion
In conclusion, the Debt Service Coverage Ratio (DSCR) serves as a vital tool for lenders, investors, and businesses alike in evaluating financial health and creditworthiness of businesses. By comparing a company’s net operating income to its total debt service, the DSCR provides insights into the ability to repay debt obligations and manage cash flows effectively.
Furthermore, understanding the relationship between DSCR and other financial indicators, such as the Loan to Value (LOV) ratio, provides a complete picture of a company’s financial situation and risk profile. Lenders use these ratios to make informed lending decisions and evaluate borrowers’ overall creditworthiness.
In summary, the Debt Service Coverage Ratio serves as a vital benchmark for financial stability and smart debt management, allowing firms to make confident borrowing and lending decisions while mitigating potential financial risks.

