What is Credit Spreads?
Credit Spreads is an analytical strategy investors use to compare the yields or returns of two debt instruments with the same maturity. The objective of the credit spread strategy is to assess the additional yield that investors ask for the additional risk taken, associated with the debt securities.
Investors use credit spread for two main reasons:
- To assess the creditworthiness of the issuer.
- To measure the risk and return related to the debt securities.
Formula to Calculate Credit Spreads:
| Credit Spreads | = Yield of Corporate Bond – Yield of Treasury Bond |
To measure the riskiness of corporate bonds, investors usually take the returns of treasury bonds to calculate credit spread. This is because treasury bonds are taken as low to no-risk debt instruments. T-bonds are considered risk-free debt securities because the government issues them, and these instruments’ default rates are considered nil.
Some investors also use the benchmark bond returns for credit spread calculation.
| Credit Spread | = Yield of corporate Bonds – Yield of Benchmark Bond |
A benchmark bond is a debt instrument that serves as a standard for assessing the risk and return of other debt instruments.
Investors use benchmark bonds to understand the return aspect, market sentiments, risk association, liquidity and transparency between the selected corporate bond and the benchmark bond.
Basis point (bps) is the standard that measures credit/ default spread. 1-per cent is equal to 100 basis points. Therefore, if the credit spread is 2%, it will be 200 basis points.
Real Life Example of Credit Spreads – Shell Plc.
To get a better understanding of credit spread, let’s calculate the credit spread of Shell plc for 2023:
| Credit Spreads | = Yield of Corporate Bond – Yield of Treasury Bond |
Calculation of Corporate Bond Yield of Shell plc:
Remember from an investor’s perspective, the yield is the return earned on a financial instrument. Here, the yield is equal to the interest rate when looked at from the company’s point of view.
Therefore, we will calculate and take the interest rate of Shell plc as a Corporate Bond Yield.
Interest Rate is calculated using interest expense and the average debt value of 2022 and 2023.
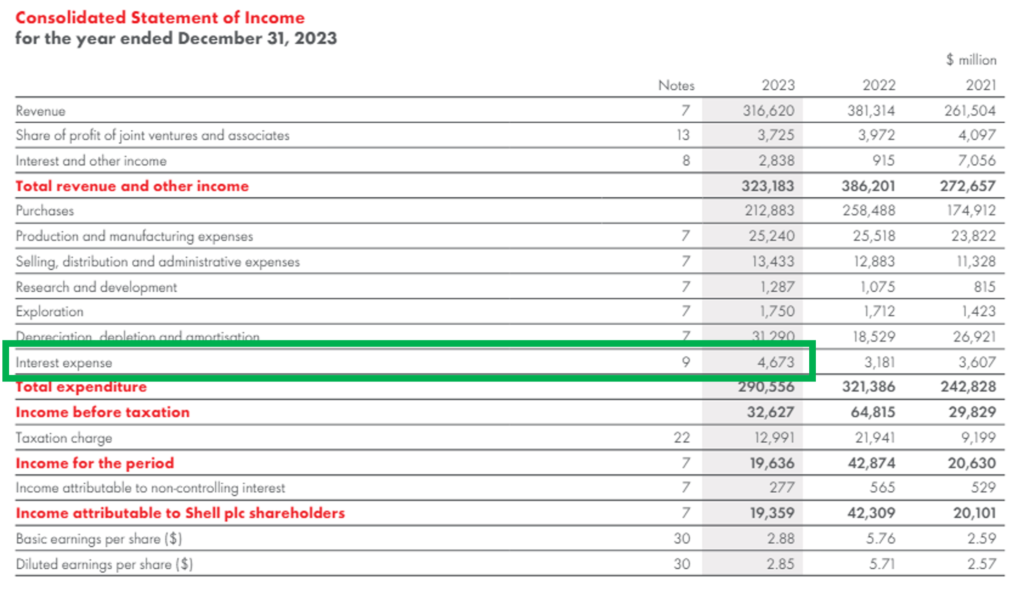
Interests Expesnes of 2023:
| Interest Expense | = 4,673 |
Calculation of Average Debt :
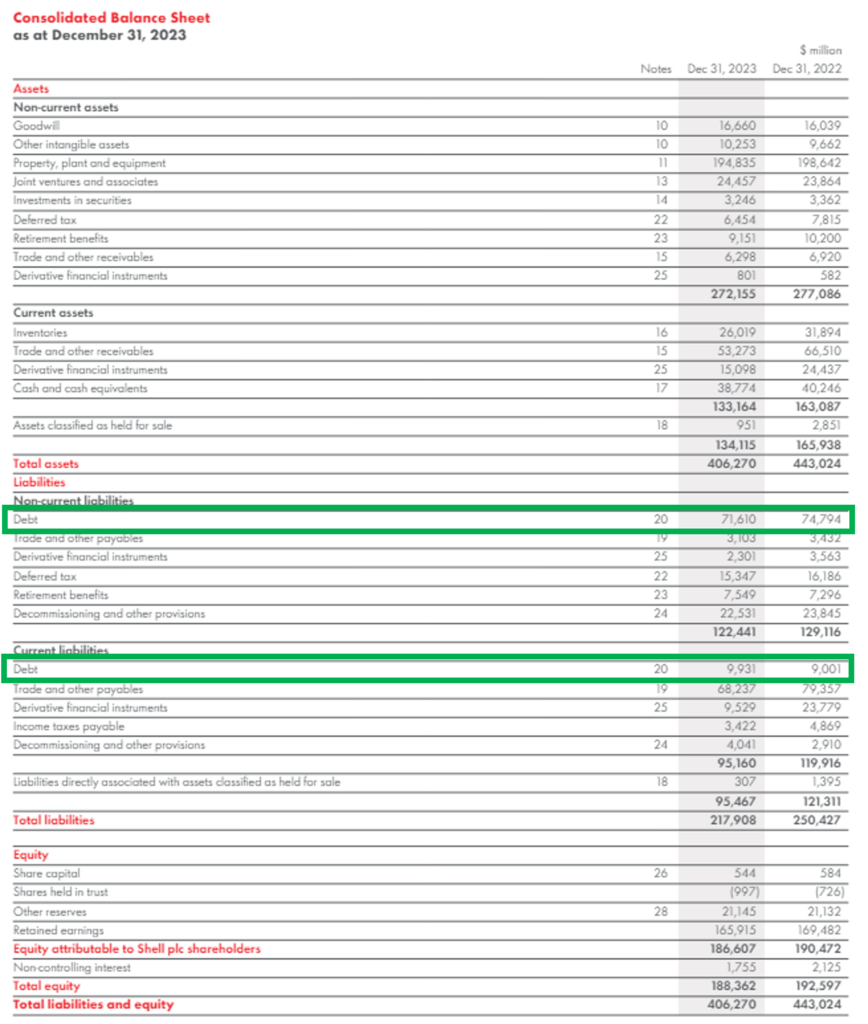
Source: https://www.annualreports.com/HostedData/AnnualReports/PDF/NYSE_SHEL_2023.pdf
| Total debt of 2023 | = Long-Term Debt + Short-Term Debt |
| = 71,610 + 9,931 | |
| Total debt of 2023 | = 81,541 |
| Total debt of 2022 | = Long-Term Debt + Short-Term Debt |
| = 74,794 + 9,001 | |
| Total debt of 2022 | = 83,795 |
| Average Debt | = (Total Debt 2023 + Total Debt 2022) / 2 |
| = (81,541 + 83,795)/ 2 | |
| Average Debt | = 82,668 |
Calculation of Interest Rate:
| Interest Rate | = (Interest Expense/ Average Debt) * 100 |
| = (4,673/ 82,668) * 100 | |
| Interest Rate | = 5.65% |
The corporate bond yield for Shell is 5.65%.
We know that to calculate the credit spread, we consider debt securities with the same maturities. Here, we are taking Shell Corporate Bonds assuming the time maturity of 10 years.
Calculation of time maturity for Shell Corporate Bonds:
For the calculation of the maturity period of the corporate bonds of Shell plc, we have taken the weighted average of all the time maturities of the corporate bonds issued by Shell plc.
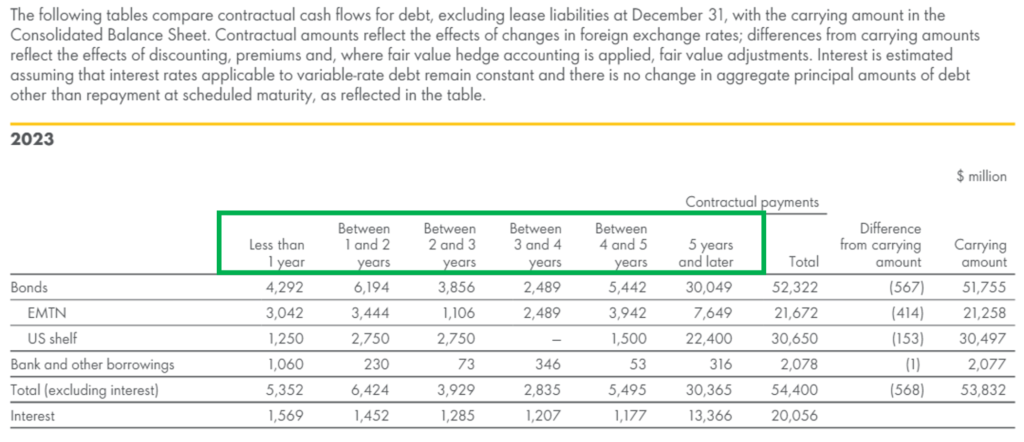
Note: The debt maturity table on page: 289 in the annual report of Shell plc shows different maturities of debt instruments issued by Shell plc.
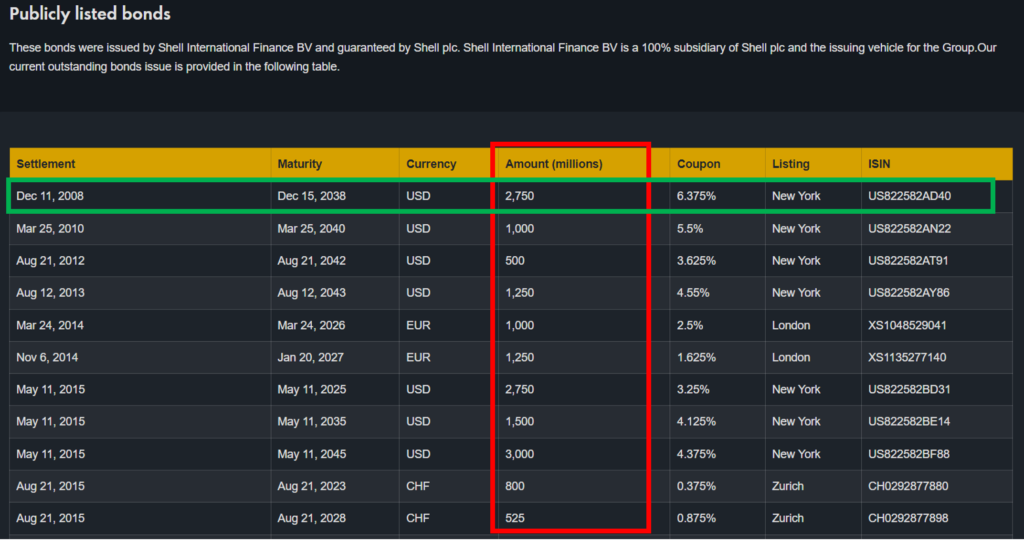
Source: https://www.shell.com/investors/debt-information/outstanding-bonds.html
Using the data of all 30 publically listed bonds of Shell plc we will calculate the time maturity of corporate bonds of Shell plc.
For this calculation, we will first calculate the outstanding time to maturity from the current year. We have taken the current year as 2024. Therefore, the outstanding maturity of the first settlement will be:
| Outstanding Maturity Period | = Maturity Year – Current Year |
| = 2038 – 2024 | |
| Outstanding Maturity Period | = 14 years |
So, we will calculate the outstanding maturity period of all the entries.
Then calculate maturity time with the weighted average of the outstanding amount (highlighted in red) and outstanding maturity period.
The formula for maturity time calculation would be:
| Maturity Time | = ∑ (Outstanding Maturity Period * Outstanding Amount) / ∑ (Outstanding Amount) |
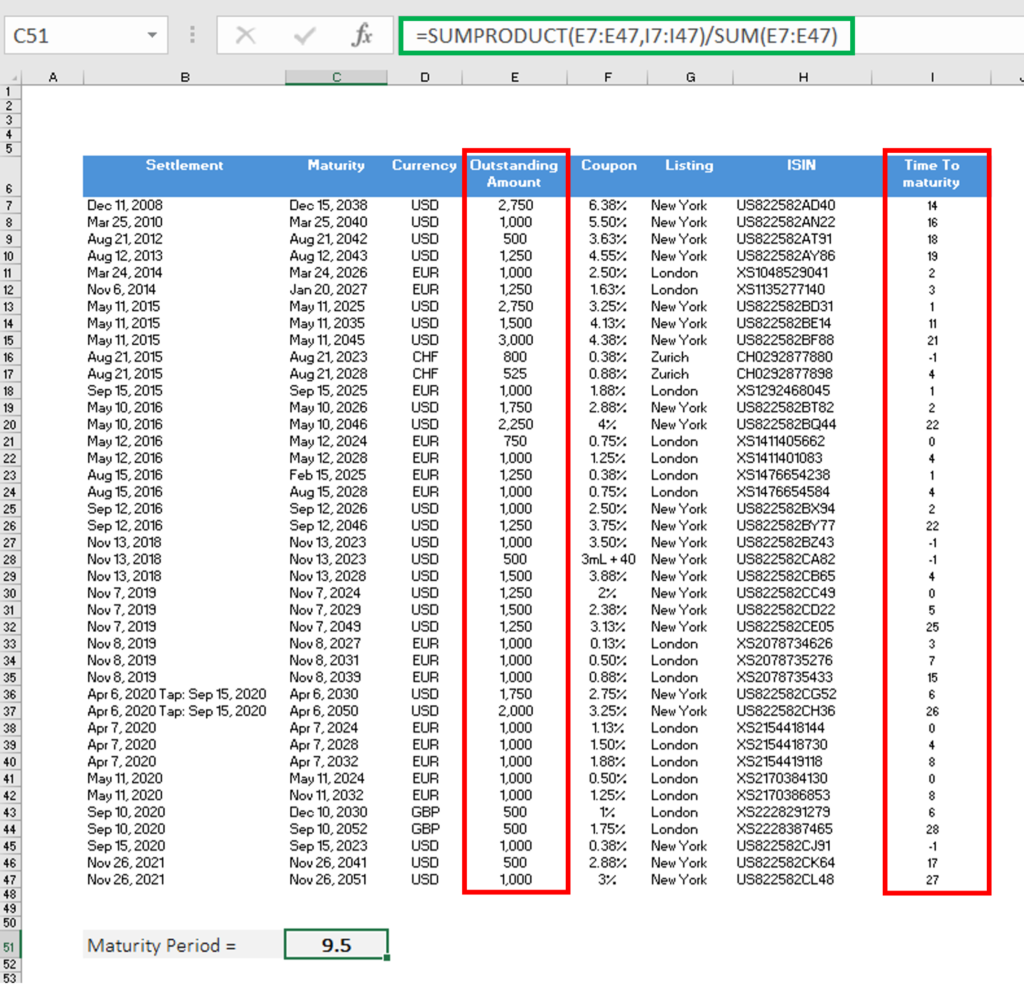
The maturity period came to 9.5 years but we will round it to 10 years for calculation ease.
Calculation of Credit Spreads for Shell Plc.
For the credit spread calculation, we will take the value of the 10-year treasury bond yield issued by the US government.
| Treasury Bond Yield | = 4.63% |
Source: https://www.cnbc.com/quotes/US10Y
| Credit Spread | = Yield of Corporate Bond – Yield of Treasury Bond |
| = 5.65 – 4.63 | |
| Credit Spread | = 1.02% |
The credit spread when we compared the Shell Corporate Bond and the 10-year Treasury Bond is 1.02%. Which equals to 102 basis points.
Movement in credit spreads
Movement in credit spreads refers to the changes experienced in the yield or return difference, between corporate and risk-free bonds with the same maturity.
Credit spread experiences two fundamental types of movements. The first is called the widening of credit spread, and the other is the narrowing of credit spread.
- Widening of Credit Spreads:
Credit spread widening occurs when the yield difference between the corporate and risk-free or benchmark bonds increases. Wide credit spreads may indicate a pessimistic orientation of investors, a deteriorating economic condition, headwinds in the industry, higher liquidity or default risk, etc.
- Narrowing of Credit Spreads:
Credit spread narrowing, also called tightening, occurs when the difference between the corporate bond yield and the risk-free or benchmark bond yield reduces. Credit spread tightening indicates investors’ confidence in the creditworthiness of corporates, tailwinds in the industry, economic growth, etc.
Reasons for movement in Credit Spreads
Movements in credit spreads represent the difference in yield between corporate bonds and benchmark government bonds of similar maturity, which can occur due to various reasons. Some common factors that influence movements in credit spreads include:
- The economic conditions change the risk and return profile of debt instrument issuers throughout the country. During the recession, the probability of default risk increases because debt service becomes challenging for the companies, widening the credit spread. The opposite happens when a country’s economy is growing. The credit spread narrows down because an organisation’s probability of generating revenue is high, and they can service debt, reducing the risk of default. Hence, credit spreads shrink when an economy grows.
- The industry performance is also responsible for the movement in credit spreads. If an industry is experiencing tailwinds like technological advancement, globalisation & trade opportunities, and industry expansion, it can lead to the narrowing of the credit spread. Headwinds in the industry, like supply chain disruption, labour and financial constraints can widen the credit spread.
- Credit ratings assigned by the agencies determine the creditworthiness of the companies. Organisations with higher credit ratings tend to be less risky than those with lower credit scores. A higher credit score means the credit spread will be short or narrow because the default risk is lower. And a low credit rating shows a wide credit spread as the chances of default are high.
- Company-specific factors like financial strength and management quality also influence the movement in the credit spread. A company with a healthy financial performance analysis position and strong management will show a narrow credit spread, compared with a company with poor financial health and weak management.
- Market sentiments arehow investors perceive the market or the overall mood of investors about the market. It also determines the credit spread of the debt instruments. Investors can have an optimistic mindset or a pessimistic mindset. An optimistic investor thinks that the market will prosper and the risk of default is low. Hence, the credit spread is narrow. An investor with a pessimistic mindset will assume that the market will fall. Thus, the credit spread is wide.
Summing Up
Credit spreads is the difference between the yields or returns of two debt instruments. It reflects the fundamental concept that investors demand additional yield for taking extra risk.
The credit spread experiences movements such as widening and narrowing, which results from investors’ sentiments, economic trends, industry dynamics, company performance, etc. Understanding the reasons behind these movements is essential for making informed investment decisions.
Credit spread analysis remains an indispensable tool for investors seeking to navigate the complexities of the debt market, helping them stay attuned to evolving market conditions and opportunities for prudent investment.

