
Introduction
In business finance and accounting, expenses form the most significant aspect of manufacturing, acquisition, and product pricing. These expenses are categorised as direct and indirect expenses. As the keystone of financial analysis, the Cost of Goods Sold (COGS) forms a significant part of expenses and as such impacts the profit margin. It is vital from businesses’ and investors’ perspectives to understand the intricacies of COGS.
What is the Cost of Goods Sold?
Cost of Goods Sold refers to the direct cost incurred by a business to produce goods and services. Cost Of Goods Sold includes fixed costs like factory rent and variable costs like raw materials, wages, etc. Some companies refer to COGS as the Cost of Sales. COGS is a combination of Direct Labour, Direct Materials, and Direct Expenses.
| Cost of Goods Sold | = Opening Stock + Purchases + Direct Expenses – Closing Stock |
Formula
- Opening Stock: Opening Stock is the unsold inventory of the previous year that the business expects to sell in the current year.
- Purchases: Purchases involve goods acquired by the business for consideration, either for manufacturing purposes or resale.
If a business buys goods for manufacturing, the business maintains three types of inventories.
- Raw Materials.
- Goods under Work in Progress.
- Finished Goods.
- Direct Expenses: It refers to all the expenses incurred by the business for the production of goods or services. It includes fuel & power, direct labour, direct materials, wages of workers, etc. These are the variable costs that impact the cost of a product.
- Closing Stock: Closing Stock equals the amount of unsold stock in a business at a given date. Closing stock is later carried forward to the next year as Opening Stock.
The Cost of Goods Sold is used to examine the production cost, which helps cost analysts determine the cost structure of a product.
Real-Life Example of COGS calculation of Tata Motors:
To get a better understanding, we shall calculate the Cost of Goods Sold of Tata Motors for the year ending 2022:
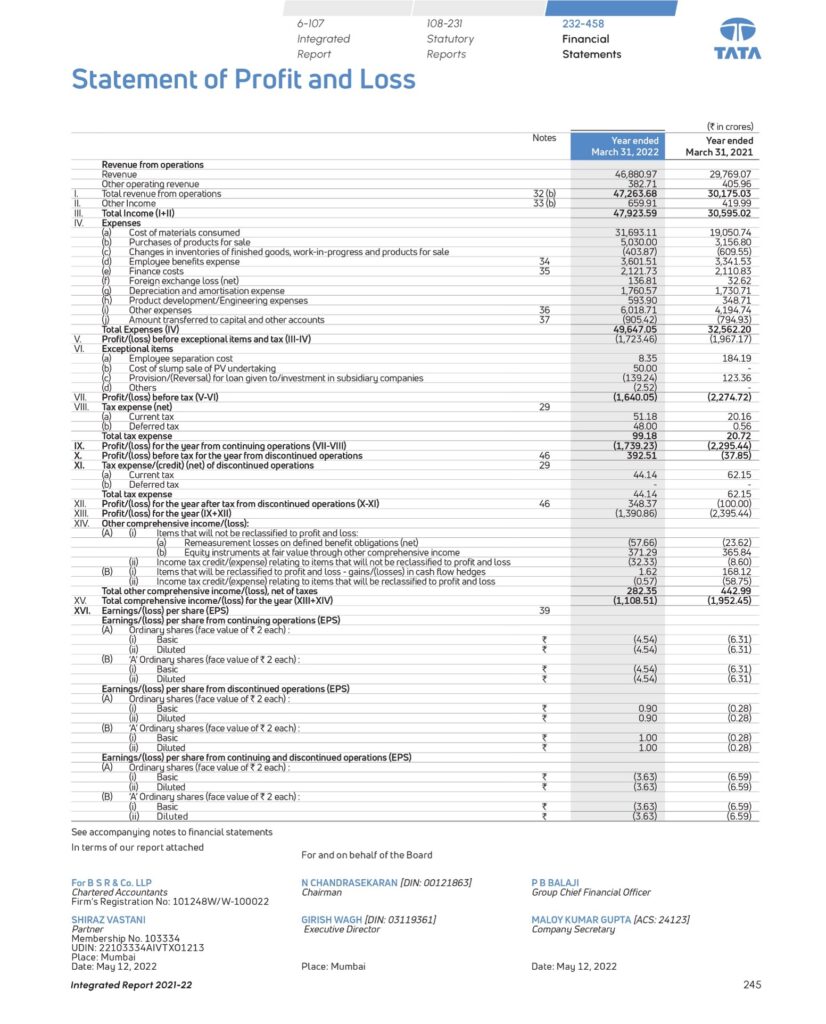
| Cost Of Goods Sold | = Cost of Materials Consumed + Purchases of products for sale + Change in inventories |
| = 31,693.1 + 5,030 + (403.8) | |
| Cost Of Goods Sold | = 36,319.3 |
Hence, the value of the Cost of Goods Sold of Tata Motors for the year 2022 is ₹ 36,319.3 crores.
Why do we subtract Closing Stock when calculating COGS?
We remove closing stock when calculating the Cost of Goods Sold because closing stock at the end of the year will be taken as an asset rather than an expense. This stock is held by the business at the end of the year and is expected to be turned into cash in the next financial year.
Therefore, we only take the volume of goods sold in a period while calculating COGS and exclude the remaining unsold portion of goods as assets.
Cost of Goods Sold as Percentage of Revenue
COGS to Sales Ratio is calculated by dividing the Cost of Goods Sold by Sales.
COGS % Sales = (Cost of Goods Sold/ Sales) * 100
COGS % Sales represent what percent of sales is spent on direct costs for the production of goods and services. It is used by cost analysts as a Cost-Effective Measure, which helps to examine and minimise the cost structure of a product.
Example:
Let’s calculate the COGS % Sales of Tata Motors and Volkswagen Group for the year ending 2022, and perform a comparative analysis:
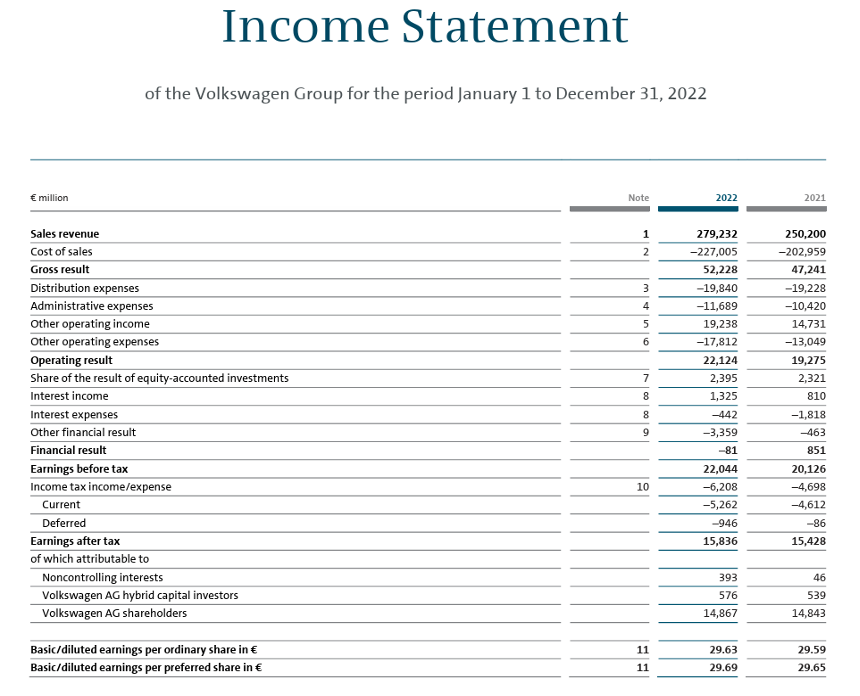
Image source: https://www.volkswagen-group.com/en/publications/more/annual-report-2022-1732
- Tata Motors
| Sales | = 46,880.9 |
| Cost of Goods Sold | = 36,319.3 |
Calculation of COGS % Sales:
| COGS % Sales | = (COGS/ Sales) * 100 |
| = (36,319.3/ 46,880.9) * 100 | |
| COGS % Sales | = 77.4 % |
- Volkswagen Group
| Sales | = 279,232 |
| Cost of Goods Sold | =227,005 |
Calculation of COGS % Sales:
| COGS % Sales | = (COGS/ Sales) * 100 |
| = (227,005/ 279,232) * 100 | |
| COGS % Sales | = 81.29 % |
With the help of the above example, we calculated the COGS % Sales of Tata Motors is 77.4% and 81.29% of the Sales of Volkswagen Group. By comparing both figures, we can conclude that Tata Motors has a lower COGS margin, which is better than Volkswagen’s because Tata Motors is spending relatively less percentage of its revenue on manufacturing.
Impact of COGS on Gross Profit
Cost of Goods Sold and Gross Profit are used by cost analysts to determine a business’s profitability and competitiveness. When the Cost of Goods Sold is subtracted from Revenue from Operations, we get Gross Profit. If, COGS increases the Gross Profit decreases, and when COGS decreases the Gross Profit increases. Hence, we can say that the Cost of Goods Sold and Gross Profit has an inverse relationship.
Accounting Relation
In International business and accounting, management of inventories and COGS are governed by IFRS and GAAP standards. These standards provide four methods for valuation of inventory and cost of goods sold:
- First-in-first-out: In this method, the company first sells the goods that were first manufactured or purchased by it. FIFO is mainly used in businesses involved in perishable goods.
- Last-in-last-out: In this method, the company sells its latest manufactured or purchased goods first and then turns over the remaining inventory.
- Average Cost Method: In this method, when inventory or goods are purchased at different prices, the company averages the price of the similar inventory. This is done to value COGS and to avoid the impact of extreme costs incurred on the acquisition of inventories or goods.
- Special Identification Method: This method uses a specified cost of each product to calculate the cost of goods sold for a period.
Why do some companies don’t have COGS?
COGS is generally claimed by the companies that are invested either in manufacturing or in merchandising (reselling business). Companies in manufacturing businesses maintain 3 types of inventories, raw materials, goods work-in-progress, and finished goods while merchandising businesses maintain an inventory of finished goods only. But some companies that cater services do not have to maintain such inventories. Thus, making them the businesses that cannot claim COGS.
The key to recognising a company with or without the Cost of Goods Sold is to look for its inventory. Hence, companies involved in real estate, business consultancy, law firms, etc are a few industries that generally do not record the cost of goods sold as an expense.
How are COGS different from OPEX?
The Cost of Goods Sold and Operating Expenses, both are recorded in the income statement of a company. But both are incurred to support different activities of the business. As we know, COGS refers to the expenditure related to the production of goods and services and is considered the direct cost of production. On the other hand, operating expenses are incurred by a business to perform its day-to-day operations and includes selling, general, and administrative expenses. OPEX are not directly related to the production of goods therefore they are considered indirect.
Conclusion
In conclusion, the Cost of Goods Sold (COGS) serves as a vital financial metric, providing insights into a company’s production costs and overall profitability. By encompassing direct expenses associated with manufacturing or acquiring goods for sale, COGS plays a significant role in determining gross profit and evaluating cost structures. The relationship between COGS and gross profit highlights the importance of efficient inventory management and cost control measures in maximizing profitability.
Furthermore, while COGS is recorded by manufacturing and merchandising organisations, service-oriented enterprises may not have COGS and instead rely on operating expenses to maintain their operations. Understanding the differences between COGS and operating expenses is critical for proper financial analysis and decision-making, ensuring that businesses successfully manage their resources and remain competitive in the market.

