
Introduction
Cash Flow statement is one of the three financial statements prepared by a company. It details the cash inflows and outflows of a period to compute the net cash generated by the company for the same period. The cash flow statement divides its cash movement into three sections: cash flow from operations, cash flows from financing and cash flow from investing. In this article, we will understand the cash movement from financing activities.
What are Cash Flows From Financing Activities?
Financing activities involve transactions and events through which a business raises capital and repays its investors. These activities are crucial to a firm’s financial strategy as they determine how a company funds its operations and growth initiatives.
Financing activities include issuing stocks, taking out loans, and repurchasing shares. It also involves how a company manages its capital structure, balancing between debt and equity to optimise its financial health and strategic goals.
What is the Cash Flows from Financing Activities
Cash flow from financing activities is one of the three sections of a company’s cash flow statement, alongside cash flow from operating and investing activities. This section provides insights into the cash inflows and outflows associated with the funding methods of the company.
- Cash Inflows: Cash inflows show the funds received by the company through various financing activities, such as issuing new shares or taking on new loans.
- Cash Outflows: These are the funds expended by the company to pay dividends, repay borrowed funds, or buy back its shares.
Cash flow from financing activities is crucial for stakeholders to understand how a company finances its operations and growth, and how it returns capital to its investors. A positive balance shows a cash inflow in the company that boosts the asset investment levels. A negative balance indicates that the company is paying out capital, debt or dividends, representing cash outflow.
Recordings under Cash Flows from Financing Activities
Cash Inflow Activities include:
- When a company issues new shares, it receives cash from investors, increasing the cash inflow.
- A company generates cash inflow when taking on new debt in the form of loans or issuing bonds.
Cash Outflow Activities include:
- When a company repays its loans or bonds, it results in a cash outflow.
- Distributing profits to shareholders as dividends are recorded as cash outflow.
- Buying back of shares is the repayment of the share capital which results in cash outflow.
Formula of Cash Flows from Financing Activities:
Cash Flow from Financing Activities is a prime figure that helps investors and analysts understand a company’s financial health.
| Cash Flow from Financing Activities | = Debt raised + Equity Raise – Debt Repayments – Cash Paid as Dividends – Share Repurchase |
Interpretation of Cash Flows from Financing Activities
Investors and analysts use cash flow from financing activities to determine the financial or economic standing & capital structure of a company. It also provides an understanding of different components like share capital, debt and dividends. The following points give us a better understanding of cash flow from the financing head:
- Frequency of cash inflow: Investors and analysts monitor the CFF for numerous periods to understand a company’s operational efficiency.
- Capital Financing: Capital financing monitors the capital sourcing of a company. If a company is frequently raising funds by issuing shares, it indicates that the company is diluting the value of the investors by diluting the owners’ control. If a company is raising capital through debt, it means that the company is binding itself with the fixed obligation of interest payment.
- Stock repurchase and dividend distribution decisions: A company might program share repurchase to appreciate its value. Similarly, when a company is recording consistent profits, it tends to give out dividends as a financial strategy for building a positive perspective about the company among investors and boosting the stock price.
Real Life Example of Cash Flows From Financing Activities
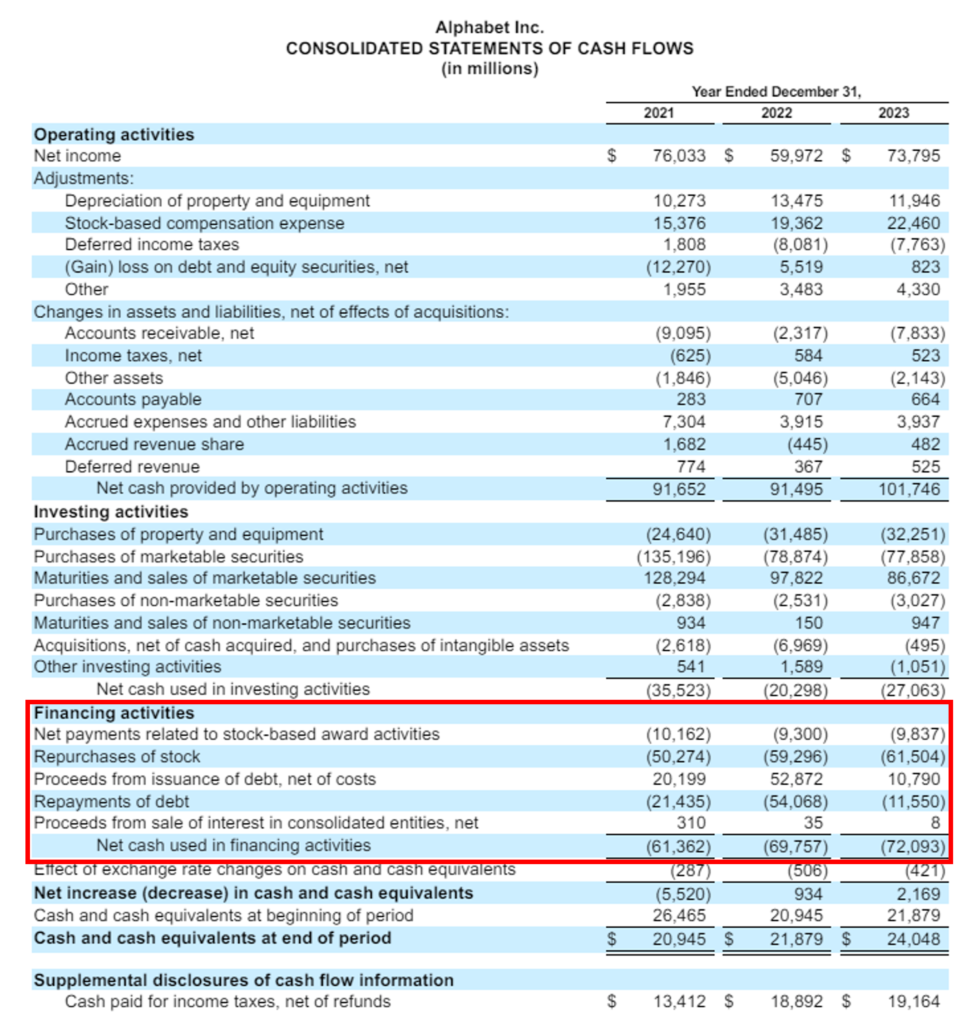
To understand Cash Flows from Financing Activities let’s look at the Cash Flow Statement of Alphabet for 2023:
Source: https://abc.xyz/assets/4b/01/aae7bef55a59851b0a2d983ef18f/596de1b094c32cf0592a08edfe84ae74.pdf
By looking at the 2023 figures we can see that the Alphabet has recorded multiple entries like:
- Net payments related to stock-based award activities reflecting employee tax withholding payments related to stock-based compensation of $9,837 million.
- Stock Repurchase of $61,504 million.
- $10,790 million proceeds from the issuance of debt.
- Debt repayments of $11,550 million, and
- $8 million from proceeds from the sale of interest in consolidated entities.
Showing a negative balance of $72,093 million, meaning the company used $72,093 million in 2023. We can also see that there are only two cash inflow entries, proceeds from the issuance of debt and proceeds from the sale of interest in consolidated entities. The rest are all cash outflow recordings.
Alphabet’s 3-year Analysis of Cash Flow from Financing Activities:
If we look at the figures for 2021, 2022 and 2023 of cash flow from the financing head we can see that:
- Alphabet has increased the volume of its stock repurchase program every successive year by looking at the figures for 2021, 2022, and 2023 as $50,274, $59,296 & $61,504 million respectively. This can be because the company wants to boost its stock prices or investor’s confidence.
- Also, the cash inflow from debt issuance spiked in 2022 to $52,872 million compared to lower debt issuing figures in 2021 as $20,199 million and $10,790 million in 2023.
- The cash inflow from proceeds from the sale of an interest in consolidated entities went down drastically from $310 million in 2021, $35 million in 2022 to only $8 million in 2023.
- Every year we can see a cash outflow of the debt repayment under the financing head of the cash flow statement as $21,435, $54,068 and $11,550 million in 2021, 2022 and 2023 respectively.
Financial Shenanigans on the Cash Flow Statement
Financial Shenanigans are the manipulation or misrepresentation of financial statements to gain an advantage over competitors, improve corporate performance or more. Financial shenanigans can include fraudulent accounting, fraudulent entities, or fraudulent acts.
Just like income statements and balance sheets, cash flow statements can be manipulated to reflect a distorted view of a company. Companies tend to shift the cash flows from financing activities to operations head to present a self-desired and distorted Cash Flow from Operations balance.
For example, companies tend to record activities of financing heads like bank borrowings, loans and stock issuance under the operating head to inflate the balance of Cash Flow from Operating Activities.
Conclusion
The cash flow from financing activities is essential for understanding a company’s financial health and strategic choices. This section of the cash flow statement highlights how a business secures funds, manages debt, and rewards shareholders. By examining these cash inflows and outflows, investors and analysts can evaluate the company’s growth sustainability and capital structure management. It’s crucial to watch for any misclassifications that might distort financial reality and mislead stakeholders. A careful review of financing activities ensures more informed investment decisions and enhances corporate transparency.

