
In the ever-evolving landscape of business, companies like Tesla and Apple face a myriad of uncertainties that could impact their future success. How can these giants prepare for fluctuating market conditions, regulatory changes, or sudden shifts in consumer preferences? The answer lies in two powerful analytical tools: scenario and sensitivity analysis. Scenario analysis helps firms like Microsoft anticipate various future conditions—such as economic downturns or technological breakthroughs—by modeling different “what-if” scenarios. Meanwhile, sensitivity analysis allows companies like General Electric to pinpoint how minor changes in factors like raw material costs or interest rates can significantly affect their financial outcomes. Together, these tools offer a strategic edge, enabling businesses to navigate uncertainty with greater confidence and agility. Let’s explore both the Scenario and Sensitivity analysis and understand how companies can use them practically.
WHAT IS SCENARIO ANALYSIS?
Scenario analysis is a strategic tool that allows businesses to map out multiple potential futures based on various external factors. Think of it as preparing for different paths the future could take. For instance, a company like General Electric might develop different scenarios to assess how changes in energy regulations or global supply chain disruptions would affect their profitability. By creating “what-if” scenarios—such as best-case, worst-case, and base-case scenarios—businesses can visualize how different circumstances will affect their key metrics, from revenues to market share.
Best-Case Scenario: This scenario outlines the most optimistic outcome, assuming all factors align perfectly. For example, General Electric might envision a future where new regulations lead to increased demand for their energy-efficient technologies, resulting in higher revenues and improved profitability.
Worst-case scenario: This scenario explores the most adverse conditions, considering the potential negative impacts of unfavorable events. For instance, it might involve severe disruptions in the supply chain, leading to higher costs and reduced production capacity, which could significantly impact General Electric’s financial performance.
Base-Case Scenario: This represents a realistic, moderate outcome based on current trends and typical conditions. It provides a balanced view of expected conditions, such as steady market growth and manageable regulatory changes, offering a reference point for comparison against the more extreme scenarios.
The real value of scenario analysis lies in its ability to offer insights into how a business might perform under drastically different circumstances. It enables companies to plan for the unexpected, ensuring they are not caught off guard when things don’t go as planned.
Some of the questions answered by scenario analysis
- What impact will regulatory changes have on our profitability? By simulating different regulatory environments, companies can understand how new laws or policies might affect their bottom line.
- How will fluctuations in market conditions influence our revenue and market share? Scenario analysis helps businesses assess how economic downturns, shifts in consumer demand, or competitive pressures could alter their financial performance.
- What are the potential effects of supply chain disruptions on our operations? Companies can explore how disruptions in their supply chain might impact production costs, delivery schedules, and overall operational efficiency.
- How can we prepare for both positive and negative shifts in our industry? By evaluating best-case and worst-case scenarios, businesses can develop strategies to capitalize on opportunities and mitigate risks.
Scenario analysis provides a structured way to anticipate and plan for a range of potential futures, helping companies stay agile and resilient in a constantly changing environment.
WHAT IS SENSITIVITY ANALYSIS?
While scenario analysis considers multiple factors that could change in the future, sensitivity analysis focuses on one or two variables at a time, showing how a small change can ripple through the business. Imagine Tesla analyzing how a 1% change in battery costs would affect overall profitability. Sensitivity analysis allows companies to isolate key variables—such as interest rates, raw material costs, or sales volume—and see which of these variables has the biggest impact on their financial performance.
By pinpointing which factors are most sensitive to change, companies can make more targeted adjustments. For example, if a slight increase in production costs drastically impacts profits, then controlling costs becomes a priority. Sensitivity analysis helps identify these pressure points, allowing companies to allocate resources more effectively and focus on areas that matter the most.
Some of the questions answered by Sensitivity Analysis
- Which financial variables have the greatest impact on the financial performance of the company? Sensitivity analysis identifies which individual factors, such as material costs or interest rates, most significantly affect outcomes like profitability and cash flow.
- How does a change in one variable affect overall results? It provides insights into how fluctuations in specific factors, such as a 2% increase in raw material costs, influence key financial metrics.
- What are the critical pressure points in our business model? By highlighting which variables are most sensitive, companies can focus on managing those pressure points to mitigate risk and optimize performance.
- How should we prioritize resource allocation? Sensitivity analysis helps in deciding where to allocate resources most effectively, ensuring that efforts are concentrated on the factors that have the most significant impact on financial outcomes.
Sensitivity analysis provides detailed insights into how individual variables affect a company’s financial health, supporting more precise decision-making and efficient resource management.
DIFFERENCE BETWEEN SCENARIO AND SENSITIVITY ANALYSIS
Below are the differences between Sensitivity and Scenario analysis.
| Aspect | Scenario Analysis | Sensitivity Analysis |
| Purpose | Examines the impact of different future states or scenarios. | Analyzes the effect of changes in individual variables on performance. |
| Focus | Multiple factors and their combined effects on outcomes. | One or two variables change and their specific impact. |
| Approach | Develops various scenarios (e.g., best-case, worst-case, base-case). | Changes one or two variables at a time while keeping other variables constant. |
| Use Case | Used to prepare for a range of potential future conditions. | Used to understand how sensitive an outcome is to specific changes. |
| Output | Provides a range of possible outcomes based on different scenarios. | Shows how changes in a particular variable affect results. |
| Example | Evaluating different market conditions like economic growth or regulatory changes. | Assessing how a 5% increase in raw material costs impacts profitability. |
| Complexity | Considers multiple interacting factors and their effects. | Focuses on the impact of individual factors, often simpler to analyze. |
| Application | Strategic planning and risk management for various future conditions. | Detailed risk assessment and optimization of specific components. |
| Decision Support | Helps in forming flexible strategies and contingency plans. | Assists in identifying critical variables and adjusting strategies accordingly. |
USING BOTH SCENARIO AN SENSITIVITY ANALYSIS FOR MAXIMUM INSIGHT
While scenario and sensitivity analysis are effective individually, their value increases significantly when applied in combination. Scenario analysis provides a broader view of potential outcomes, while sensitivity analysis offers granular insights into how specific variables can affect performance. Together, these tools equip businesses with a robust framework for risk management and strategic planning.
For example, a U.S. airline company could create different scenarios based on fluctuating oil prices, regulatory changes, and shifts in consumer travel habits. Once these scenarios are in place, sensitivity analysis can reveal how much changes in fuel costs or ticket prices would impact the bottom line. This comprehensive approach helps businesses build strategies that are not only resilient but also flexible enough to handle multiple potential futures.
EXAMPLE OF HOW COMPANIES USE SCENARIO AND SENSITIVITY ANALYSIS
Let’s understand how real-life companies may use scenario and sensitivity analysis. We are talking here two examples: one from the Energy sector and one from the Technology sector.
Shell Plc: As a major player in the energy sector, Shell plc faces significant risks from fluctuating oil prices and regulatory changes. Scenario analysis might help Shell plc assess the impact of different oil price scenarios on its profitability. For example, they could model a best-case scenario where oil prices rise due to supply shortages, leading to higher revenues. Conversely, a worst-case scenario might involve a significant drop in oil prices due to an oversupply in the market, severely affecting profit margin. On the other hand, sensitivity analysis could focus on how small variations in production costs or changes in environmental regulations impact overall financial performance. For instance, a 5% increase in production costs might significantly reduce profit margins, helping Shell plc identify critical cost-control areas and prepare for potential cost pressures.
The report published below by Shell plc focuses on different approaches and perspectives Shell uses to anticipate future challenges and opportunities, especially in the energy sector. Key scenarios considered by Shell include:
- Oil Crisis of 1973: Shell predicted the possibility of an oil crisis, allowing the company to respond effectively to the 1973 oil shock, which led to massive economic impacts globally.
- Energy Scenarios to 2050: Shell developed two major scenarios—Blueprints and Scramble—that explore how the world might address surging energy demand, limited supply, and climate change. Blueprints focus on regulatory and technological collaboration for sustainable solutions, while Scramble assumes governments prioritize their own energy needs, leading to a reactive approach to climate change.
- Stress Nexus of Energy, Water, and Food: As global urbanization increases, Shell has explored the interdependencies between energy, water, and food systems. This nexus helps identify where innovations and sustainable practices are necessary to meet growing demands for these essential resources.
- Pathway Lenses for Future Transitions: Shell’s “Pathway Lenses” explores how gaps between people’s aspirations and what they have create opportunities for reform and innovation in economic, political, and environmental systems.
These scenarios allow Shell to plan for various plausible futures, enabling better long-term strategic decisions. (source: https://www.shell.com/news-and-insights/scenarios/what-are-shell-scenarios/_jcr_content/root/main/section_509167378/promo/links/item0.stream/1652289755448/a0e75f042fee5322b72780ee36e5ba17c35a4fc6/shell-scenarios-40yearsbook080213.pdf )
Apple: As a leading technology company with a global supply chain, Apple frequently navigates various operational challenges. Scenario analysis might be used to evaluate the impact of significant trade tensions with China or a global semiconductor shortage on their operations. For example, a best-case scenario might assume trade relations improve, and supply chains run smoothly, allowing Apple to meet production targets and maintain profitability. Conversely, a worst-case scenario could involve severe supply chain disruptions leading to delayed product launches and higher costs. Sensitivity analysis, in this context, could examine how a small increase in manufacturing costs or shipping delays affects Apple’s product margins. For example, a 1% rise in production costs could significantly impact profit margins, guiding Apple in managing and mitigating these cost changes effectively.
Both ExxonMobil and Apple utilize these analyses to anticipate potential issues and make informed decisions, helping them navigate complex environments and maintain financial stability.
HOW CAN EXCEL HELP US DO BOTH SENSITIVITY AND SCENARIO ANALYSIS?
Scenario Analysis: Excel’s Scenario Manager tool is ideal for scenario analysis. It allows users to define and save multiple sets of input values (scenarios) and see how these variations affect the outcome of a model. By creating scenarios such as best-case, worst-case, and base-case, users can easily compare how different assumptions impact key metrics like revenue or profit.
Sensitivity Analysis: For sensitivity analysis, Excel’s Data Table tool is particularly useful. It enables users to analyze how changes in one or two input variables affect the results of a formula. By setting up a data table, you can quickly see how variations in individual variables, such as interest rates or production costs, influence financial outcomes.
Both tools in Excel facilitate comprehensive analysis by allowing users to model various scenarios and understand the impact of individual variables on their financial projections.
Let us understand how to practically do both the analysis in Excel below.
Sensitivity Analysis using Data Table in Excel
EcoGadgets Inc. saw its revenue grow from $1,000 in year 1 to $1,150 in year 2, a 15% increase. However, costs have also risen from $400 to $517.5, increasing as a percentage of revenue from 40% to 45%. Despite this, the company’s profit has only grown from $600 to $632.5. The company wants to analyze its profitability by testing it against the key sensitive variables. It has identified two key variables impacting the profit of the company- cost as a percentage of sales and revenue growth percentage. Let’s see how we can perform the sensitivity analysis in Excel below.
Below is the Income Statement of the company.
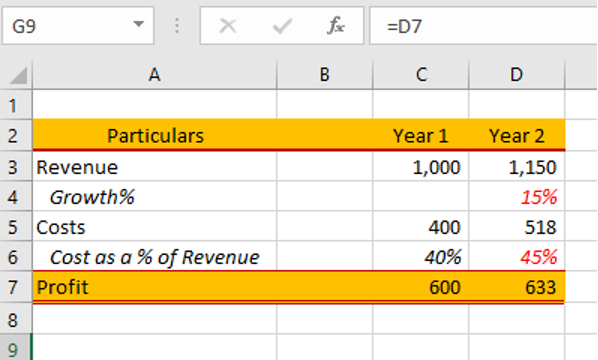
We want to see how the profit for year 2 changes with the change in Revenue growth % and Cost as a % of Revenue. For this, we will first build the framework for the sensitivity table as below where later we will be filling in the profit for each combination of revenue growth and cost percentage. In the yellow box cell G9, we will link the cell of year 2 Profit (cell D7).
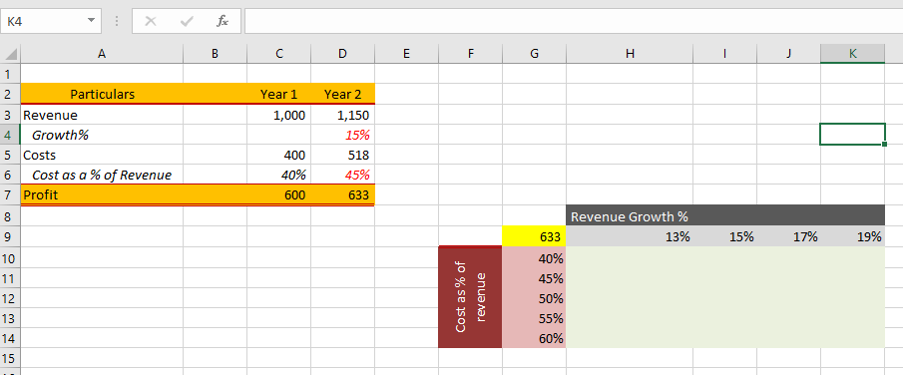
Next, we will select the area along with the assumptions where we want to use the table formula. See the selected area below. Go to the Data tab and from what-if-analysis, we will select the data table. The assumptions should be put in the menu box that pops up. The row input in this case is the y/y growth (cell D4) and the column input is COGS as a % of revenue (cell D6).

We will get the final output by clicking the OK button below.
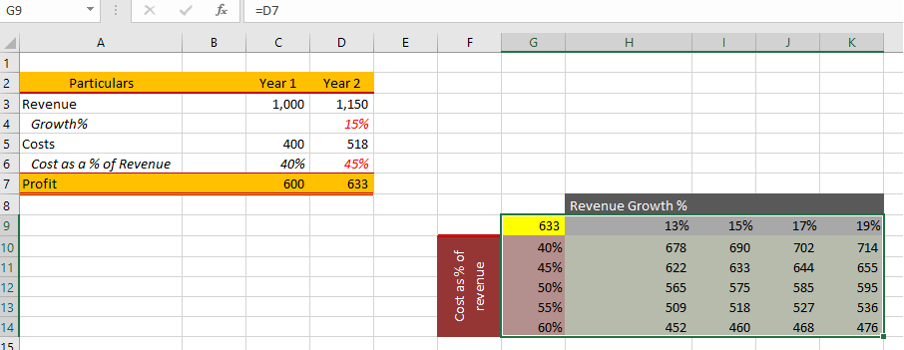
We can see from above that the company that depending on expected revenue growth and cost %, the profitability of the company can vary quite a lot from USD 452 mn to USD 714 mn. Depending on what the expectation might be from the company, we can point to the above data table to get to an estimate of expected profits of the business.
Scenario Analysis using Scenario Manager in Excel
Let’s say we are working with GreenGadgets Corp., a company that sells eco-friendly gadgets. The company is trying to project its profits for the next two years and wants to understand how changes in key variables—such as retail price, cost of goods sold (COGS), and unit sales growth—will affect the bottom line. This is where scenario analysis in Excel becomes a powerful tool.
Below is the profit calculation of the company.
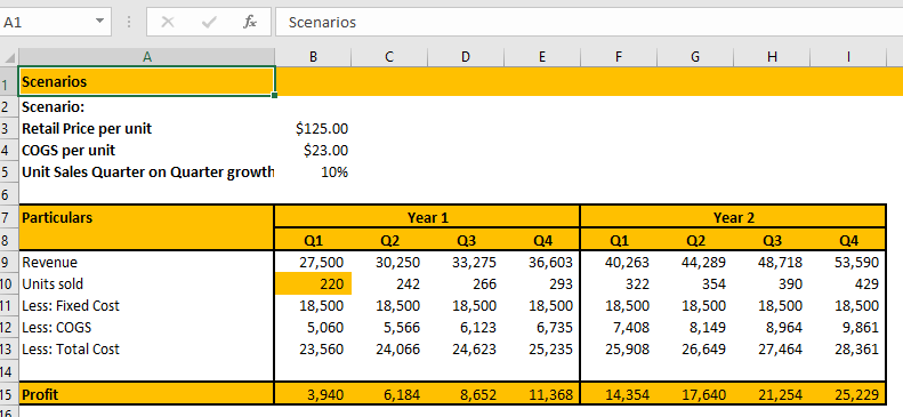
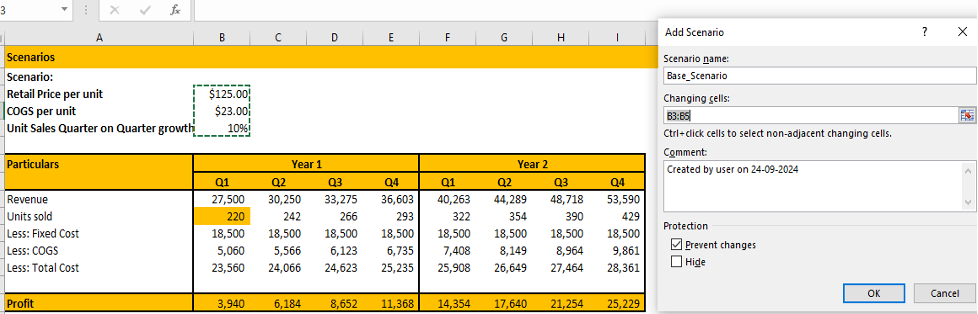
First, we need to define the baseline scenario. In the current scenario, the retail price of the product is $125, the COGS is $23 per unit, and the company expects a unit sales growth factor of 10% each quarter.
Based on these assumptions, the company projects its performance for Year 1 and Year 2, broken down quarterly. The number of units sold begins at 220 in Q1 of Year 1 and increases by 10% each quarter. Revenue is calculated by multiplying the units sold by the retail price of $125 per unit. The cost of goods sold (COGS) is determined by multiplying the units sold by the COGS per unit, which is $23. Fixed costs remain consistent at $18,500 per quarter throughout the period. The sum of the COGS and fixed costs is the total costs. Finally, profit is calculated by subtracting total costs from Revenue, providing the company with a clear understanding of its quarterly financial performance.
Now the company has to test the profitability of the company under different scenarios.
Scenario 1: Let’s take a scenario where GreenGadgets Corp. due to an unexpected surge in market demand, growth skyrockets to an impressive 15%. This spike in demand creates a favorable environment for the company to strategically raise its retail price from $125 per unit to $130. With this newfound market strength, the company capitalizes on the increased volume, unlocking the benefits of economies of scale. This operational advantage allows it to reduce its cost of goods sold (COGS) from $23 per unit to just $21.
Scenario 2: Let’s take a second scenario where GreenGadgets Corp., where the market slows, and the company’s growth rate drops to 5%. This downturn forces the company to reduce its retail price from $125 per unit to $120 to stay competitive and retain its customer base. At the same time, rising production costs push the cost of goods sold (COGS) from $23 per unit to $25, squeezing profit margins even further.
| Scenario # | Retail Price per unit | COGS per unit | Sales Growth Q-o-Q |
| Base case | $125 | $23 | 10% |
| Scenario 1 | $130 | $21 | 15% |
| Scenario 2 | $120 | $25 | 5% |
Now given the base scenario and Scenario 1 and Scenario 2 let’s see how can we use the scenario manager below.
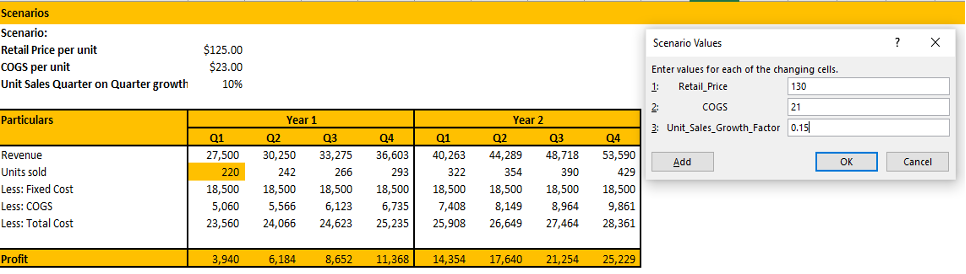
First, select the cells whose values you want to change. In our example, we want to change the Retail price, COGS, and unit sales growth factor to obtain a different value for the Income, units sold, COGS, and profit for both year 1 and year 2. Go to Data Tab> what-if-analysis>Scenario manager> Add new> name the Scenario as Base_Scenario> Select the cells which we want to change> and then hit OK.
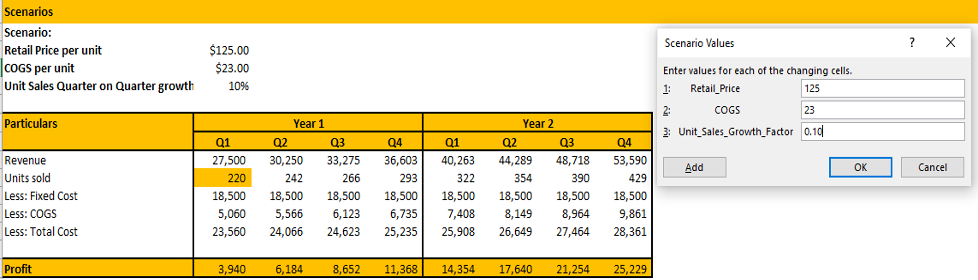
After entering OK a scenario is created and can be viewed as below.
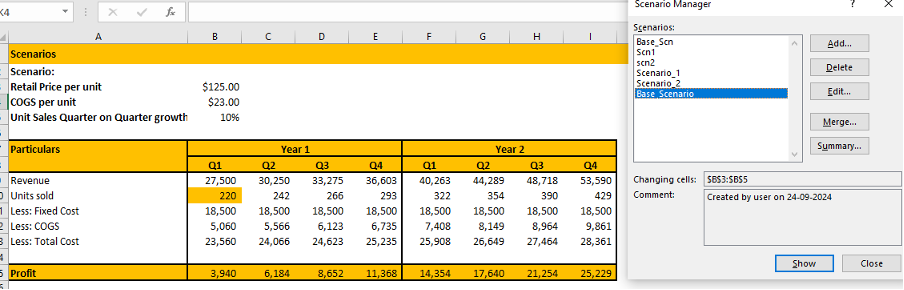
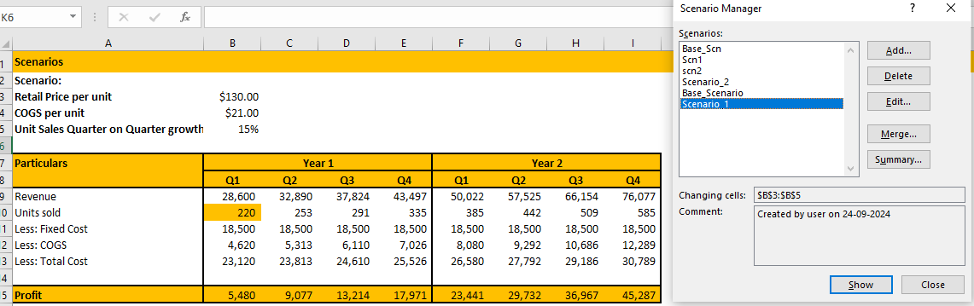
Similarly create scenario_1 and scenario_2 as below.
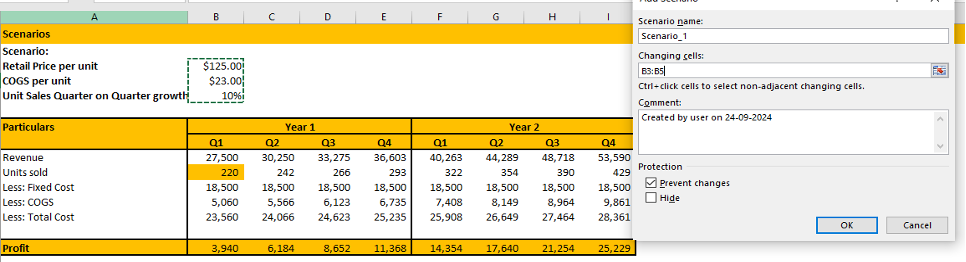
Scenario 1 results look like below.
And Scenario 2 results look like
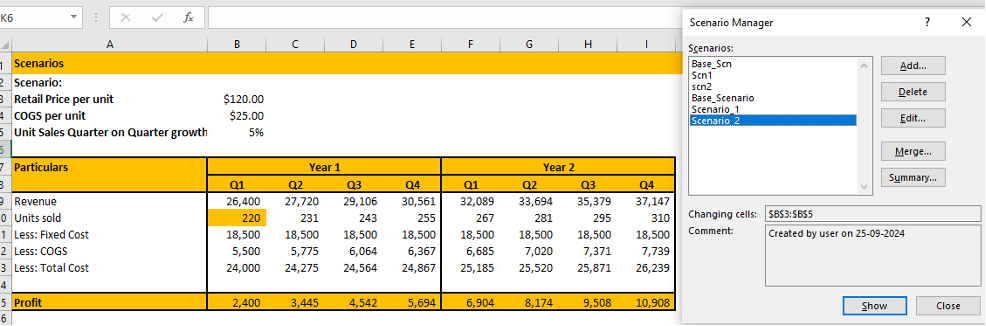
Once the table is complete, the company can review the potential outcomes and make informed decisions about pricing strategy, cost management, or growth expectations.
In the above, example we can see that the company has highest profit under scenario 1 and lowest under scenario 2. The company based on above analysis can prepare itself better for any uncertainties lying ahead of it.
CONCLUSION
In an unpredictable world, businesses that proactively assess potential risks and opportunities are better equipped to navigate change. By integrating scenario and sensitivity analysis into their planning processes, companies can sharpen their foresight, reduce risk exposure, and ultimately make more informed decisions. Whether bottom-up forecasting for the next fiscal quarter or the next decade, these analytical tools provide a competitive edge that every forward-thinking business needs.

